Report on the Environment
Conceptual Framework
What is the sustainability framework?
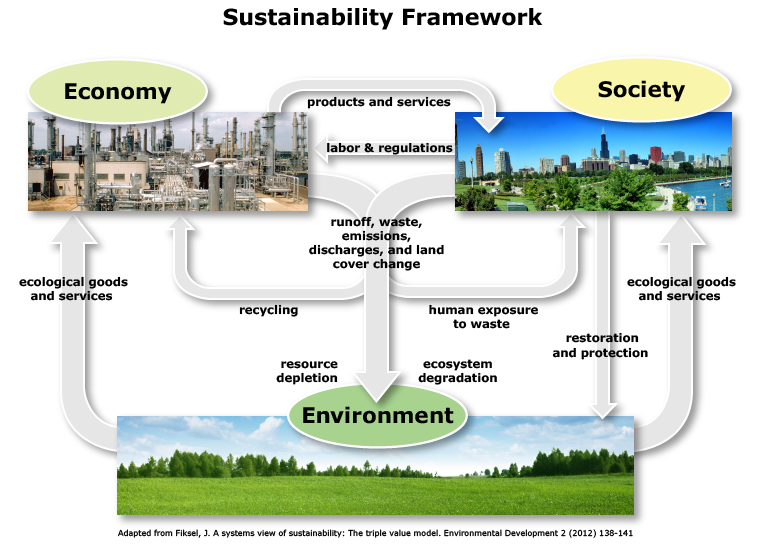
The sustainability framework, depicted below, is a conceptual framework—in other words, it uses words, symbols, and/or pictures to show how scientists think things are related to each other. This framework represents the world as three interrelated and interacting systems: economy, society, and environment. The arrows in the figure show the flows among the three systems. Learn more »
About the Three Systems
- The economy comprises activities that provide products and services to people. These include manufacturing, agriculture, mining, power generation, drinking water treatment, wastewater treatment, solid waste management, health care, construction, and commercial fishing and aquaculture.
- Society represents people, their actions, and their quality of life. This includes human health and well-being, government and other institutions, buildings, transportation and utility infrastructure, and recreation.
- The environment represents the natural world, including native animals and plants, mineral deposits, soil, water, and air.
Interrelationships Among the Systems
- The environment provides ecological services to the economy and to society. Examples include provision of goods such as fish, crops, air, water, timber, raw materials, and fuel; purification of air and water; pollination of crops and natural vegetation; maintenance of biodiversity; decomposition of wastes; moderation of weather extremes; contribution to climate stability; and provision of recreation.
- The economy produces products and services for society. It deposits wastes into the environment, and can also protect and restore environmental systems through recovery and recycling operations.
- Society supplies labor and talent to the economy. It generates wastes that are deposited in the environment or recycled to the economy. It regulates the economy and protects the environment.
« Collapse text
Understanding how systems are related helps EPA address increasingly complex and interconnected problems as it fulfills its mission to protect human health and the environment. In the ROE, EPA uses the sustainability framework as a conceptual foundation from which to show how ROE indicators relate to some of the key issues of concern to EPA. ROE indicators help EPA understand the trends in factors that contribute to these issues and the trends in adverse impacts associated with the issues.
How do ROE indicators relate to issues of concern to EPA?
With the sustainability framework as the foundation, EPA has created a series of figures to show how ROE indicators relate to six issues of concern to the Agency. For each issue, there are three successive figures:
- Overview. First, an “Overview” figure shows elements of the economy, society, and environment that contribute to the issue; factors that affect stressors (e.g. pollutant levels); the environmental, economic, and societal impacts that make this an issue; and how all of these are inter-related.
- Contributors: Red boxes signify elements that contribute to the issue, and red-highlighted text describes factors affecting stressors.
- Impacts: Blue boxes signify elements affected by the issue and blue-highlighted text describes adverse impacts.
- Key attributes. The second figure shows the key attributes associated with the issue, and how they inter-relate. Key attributes are measureable characteristics that represent sources, stresses, and effects most directly related to the issue. Each attribute is a potential area for indicator development. Ideally, indicators would be available for all attributes in the figure, to monitor the trends associated with the issue over time.
- Contributors: Attributes that represent sources and stresses that contribute to the issue are shown in red boxes.
- Impacts: Attributes that represent adverse impacts associated with the issue are shown in blue boxes.
- Relevant ROE indicators. The final figure shows (in dark blue “bubbles”) the ROE indicators relevant to the issue and which attributes they are associated with. Attributes with indicators are highlighted; attributes without indicators are faded. To view an indicator, click on the indicator bubble.