Air Toxics Emissions
![]() Exhibit 1. Air toxics emissions in the U.S. by source category, 1990-2014
Exhibit 1. Air toxics emissions in the U.S. by source category, 1990-2014
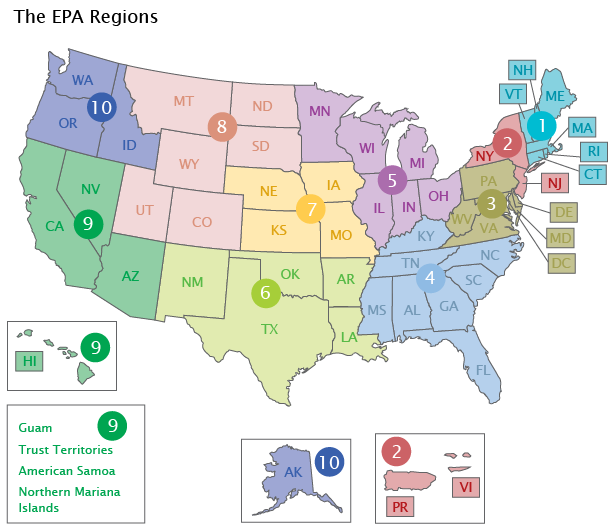
![]() Exhibit 2. Air toxics emissions in the U.S. by EPA Region, 2002-2014
Exhibit 2. Air toxics emissions in the U.S. by EPA Region, 2002-2014
![]() Exhibit 3. Emissions of selected air toxics in the U.S. by source category, 1990-2014
Exhibit 3. Emissions of selected air toxics in the U.S. by source category, 1990-2014
Click the legend to turn layers on or off. Hover your mouse over the display to reveal data.
Click the legend to turn layers on or off. Hover your mouse over the display to reveal data.
Choose a chemical from the list. Click the legend to turn layers on or off. Hover your mouse over the display to reveal data.
- Introduction
Toxic air pollutants, also known as air toxics or hazardous air pollutants (HAPs), are those pollutants that are known or suspected to cause cancer or are associated with other serious health (e.g., reproductive problems, birth defects) or ecological effects. Examples of air toxics include benzene, found in gasoline; perchloroethylene, emitted from some dry cleaning facilities; and methylene chloride, used as a solvent by a number of industries. Most air toxics originate from anthropogenic sources, including mobile sources (e.g., cars, trucks, construction equipment), stationary sources (e.g., factories, refineries, power plants), and indoor sources (e.g., building materials, cleaning solvents). Some air toxics are also released from natural sources such as volcanic eruptions and forest fires. Secondary formation of certain air toxics, such as acetaldehyde and formaldehyde, can also occur when precursor chemicals react in the atmosphere. The Clean Air Act identifies 187 air toxics associated with industrial sources, many of which are also associated with mobile sources. In addition, EPA identifies mobile source air toxics by evaluating the compounds emitted by mobile sources that have the potential to cause serious adverse health effects.
People exposed to toxic air pollutants at sufficient concentrations and durations may have an increased chance of getting cancer or experiencing other serious health effects. These health effects can include damage to the immune system, as well as neurological, reproductive (e.g., reduced fertility), developmental, respiratory and other health problems. In addition to exposure from breathing air toxics, some toxic air pollutants such as mercury can deposit onto soils or surface waters, where they are taken up by plants and ingested by animals and are eventually magnified up through the food chain. Like humans, animals may experience health problems if exposed to sufficient quantities of air toxics over time.
Air toxics emissions data are tracked by the National Emissions Inventory (NEI). The NEI is a composite of data from many different sources, based primarily upon emission estimates and emission model inputs provided by state, local, and tribal air agencies for sources in their jurisdictions, and supplemented by data developed by the EPA. Different data sources use different data collection methods, and many of the emissions data are based on estimates rather than actual measurements. For most mobile sources, emissions data are based on mobile source models for on-road and nonroad vehicles, often using state-supplied model inputs (U.S. EPA, 2018a). For most fuel combustion sources and industrial sources, emissions are provided by state, local, and tribal agencies and are estimated primarily using source testing and emission factors.
NEI data have been compiled since 1990 and cover all 50 states and their counties, D.C., the U.S. territories of Puerto Rico and the Virgin Islands, and some of the territories of federally recognized American Indian nations. The NEI includes baseline air toxics data for the 1990-1993 period and since then has been updated every 3 years. The baseline period represents a mix of years depending on data availability for various source types. While NEI data for air toxics were also compiled for 1996 and 1999, the methodology used in those years for air toxics differed considerably from the methodology that was used in 2002, 2005, 2008, 2011, and 2014. Therefore, the 1996 and 1999 data are not presented because comparing these two inventory years to those that used different methodologies might lead to invalid conclusions. While the 1990 methods were also different, the baseline data are still shown and the overall decreasing trends since 1990 are a valid result, supported by ambient data measurements.
This indicator first presents emissions data for all air toxics combined, both at the national level and broken down into the ten EPA Regions. Consistent with the other emissions indicators, the national data are organized into the following source categories: (1) “Stationary sources,” which include fuel combustion sources (coal-, gas-, and oil-fired power plants; industrial, commercial, and institutional sources; as well as residential heaters and boilers) and industrial processes (chemical production, petroleum refining, and metals production) categories; (2) “Prescribed burns;” (3) “Wildfires,” for insights on contributions from some natural sources; (4) “On-road vehicles,” which include cars, trucks, buses, and motorcycles; and (5) “Nonroad vehicles and engines,” such as farm and construction equipment, lawnmowers, chainsaws, boats, ships, snowmobiles, aircraft, and others.
In addition to presenting emissions data aggregated across all 187 air toxics, the indicator presents emissions trends for seven individual air toxics. These air toxics—acetaldehyde, acrolein, benzene, 1,3-butadiene, carbon tetrachloride, formaldehyde, and tetrachloroethylene—were selected for display in this indicator because they account for a large portion of the estimated nationwide cancer risk attributed to outdoor air pollution and because they have sufficient air quality trend data (the Air Toxics Concentrations indicator). Additionally, acrolein was selected for display because it is one of the key pollutants that contribute most to overall nationwide non-cancer risk, according to EPA’s most recent National Air Toxics Assessment (U.S. EPA, 2018c). When reporting on individual air toxics, this indicator presents emissions data for the source categories most relevant to the pollutant of interest.
- What the Data Show
Trends Aggregated Across All 187 Air Toxics
According to NEI data, estimated annual emissions for the 187 air toxics combined decreased 58 percent, from 7.2 million tons per year in the baseline period (1990-1993) to 3.0 million tons per year in 2014 (Exhibit 1). This downward trend resulted from reduced emissions from stationary and mobile on-road and nonroad sources. Some changes in NEI methods are also reflected in these reductions, though it is not possible to know how much different the reduction would be without those methods changes.
Although a complete set of state and local air toxics emissions data are not available for the 1990-1993 baseline period, regional trends can be characterized from 2002 to 2014. In 2002, air toxics emissions in the ten EPA Regions ranged from 164,000 tons in Region 1 to 1,043,000 tons in Region 4. From 2002 to 2014, air toxics emissions decreased in nine EPA Regions, with decreases ranging from 14 percent (Region 6) to 62 percent (Region 2). Air toxics emissions in Region 10 are unchanged between the 2002 and 2014 inventory years (Exhibit 2).
Trends for Selected Air Toxics
Exhibit 3 shows emissions trends for seven pollutants believed to be among the pollutants that contribute to the greatest cancer and noncancer risks that are attributed to air toxics, according to an EPA assessment (U.S. EPA, 2018c). The pollutant-specific bar charts in this exhibit show how emissions trends vary from one pollutant to the next. Estimated emissions decreased between the baseline period (1990-1993) and 2014 for five of the seven air toxics with data for this time frame: acrolein (7 percent), benzene (58 percent), 1,3-butadiene (45 percent), carbon tetrachloride (98 percent), and tetrachloroethylene (97 percent). Acetaldehyde increased by 40 percent and formaldehyde emissions increased by 6 percent during this time frame, and the increased emissions of both pollutants were driven both by methodological changes and contributions from forest wildfires and prescribed burns.
- Limitations
- The emissions data are largely based on estimates. Although these estimates are generated using well-established approaches, including extensively reviewed mobile source models, the estimates have inherent uncertainties.
- The methodology for estimating emissions is continually reviewed and is subject to revision. Trend data prior to any revisions must be considered in the context of those changes.
- The indicator (Exhibit 1) is an aggregate number that represents contributions from 187 different chemicals with widely varying toxicities and human exposures. Therefore, the nationwide trend for total air toxics and the resulting health effects likely differs from emissions trends for specific chemicals. Similarly, because the indicator is a nationwide aggregate statistic, the trend may not reflect emissions trends for specific locations.
- Not all states and local air quality management agencies provide the same data or level of detail for a given year.
- There is uncertainty associated with identifying which air toxics account for the greatest health risk nationwide. Toxicity information is not available for every compound, and emissions and exposure estimates used to characterize risk have inherent uncertainties. Additional limitations associated with the National Air Toxics Assessment are well documented (U.S. EPA, 2018c).
- NEI emissions from on-road mobile sources prior to 2002 were estimated using the MOBILE model, and 2002, 2005, 2008, 2011, and 2014 emissions for this source category were estimated using different versions of the MOVES model which applied different methods. Therefore, the outputs may not be directly comparable across years; the change in model is reflected as part of the trend shown.
- Methods for estimating air toxic emissions for nonroad sources changed substantially in the 2014 NEI. This inventory relied on MOVES2014b, which replaced speciation data used to estimate nonroad toxics with newer information. Thus, the nonroad sources air toxic emissions data for 2014 are not directly comparable to data from earlier years.
- Changes shown from 1990-2014 include both emissions changes and methods changes. While trends shown are generally representative, actual changes from year to year could have been larger or smaller than those shown.
- The 2008 NEI reduction in the sum of air toxics emissions relative to 2005 and after 2008 is largely an artifact of emissions inventory methods for certain “stationary sources.” In some inventory years (e.g., 2005, post-2008), EPA used data augmentation methods to fill gaps when states failed to report volatile organic compound emissions from solvent processes. However, in other inventory years (e.g., 2008), no data augmentation methods were used. Therefore, the emissions changes reported for this source category do not necessarily represent the actual trend.
- Data Sources
Summary data in this indicator were provided by EPA’s Office of Air Quality Planning and Standards, based on anthropogenic air toxics emissions data in the NEI. The most recent data are taken from Version 2 of the 2014 NEI (U.S. EPA, 2018b). These and earlier emissions data can be accessed from EPA’s emission inventory website (https://www.epa.gov/air-emissions-inventories). The 1990 data and the MOVES data used for 2002 and 2005 are not available through the NEI website, but these data can be accessed from EPA’s emission modeling website (https://www.epa.gov/air-emissions-modeling). This indicator aggregates NEI data by source category and EPA Region.