Non-Indigenous Benthic Species in the Estuaries of the Pacific Northwest
Click the legend to turn layers on or off. Hover your mouse over the display to reveal data.
- Introduction
Non-Indigenous Benthic Species in the Estuaries of the Pacific Northwest
Non-indigenous species (NIS) are one of the greatest threats to aquatic ecosystems and can impact local and regional economies (Lowe et al., 2000). The number of invasive species in estuaries of the Pacific Northwest (including Puget Sound, Columbia Estuary, and Coos Bay) is rising, and these areas can become sources of invasives to other locales. Coastal waters are particularly vulnerable to NIS transported in ballast water and introduced via aquaculture (Puget Sound Action Team, 2002). It is becoming apparent that NIS are capable of impacting estuaries along the Pacific coast, even though they are rarely addressed in routine monitoring studies. One limitation is the lack of standardized invasion metrics and threshold values.
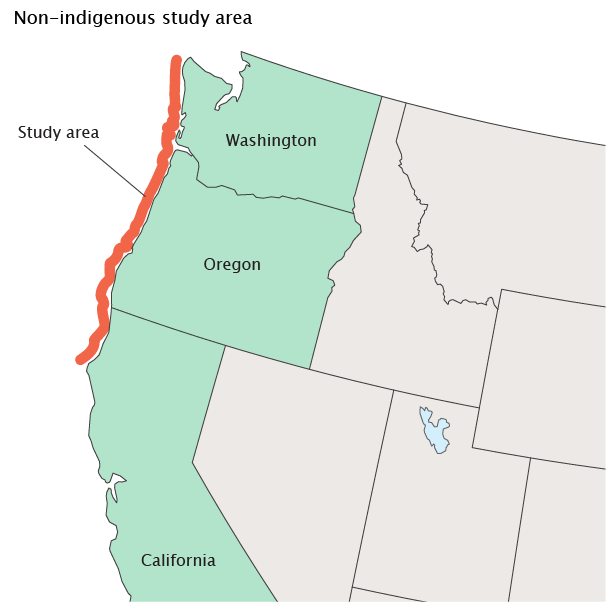
This indicator focuses on estuarine soft-bottom communities of the Columbian Biogeographic Province located along the Pacific coast from Cape Mendocino, California, north to the Strait of Juan de Fuca at the entrance to Puget Sound, Washington. It is limited to sites with salinities of 5 parts per thousand or higher. The indicator is based on the percent abundance of NIS individuals relative to the combined abundance of native and NIS individuals in a benthic grab sample.
The data for this indicator were collected by EPA’s Environmental Monitoring and Assessment Program (EMAP) using a probability survey over the 1999-2001 period (Nelson et al., 2004, 2005) and by a special probabilistic study focusing on estuaries not exposed to ballast water or aquaculture. Probability sampling provides unbiased estimates of the percent abundance of natives and NIS in all estuaries in the study area, but because the data for the special study have not yet been statistically expanded, data for this indicator are based on stations sampled rather than area.
Interpretation of this indicator requires threshold values to distinguish among different levels of invasion. To determine the lowest expected level of invasion within the Columbian Biogeographic Province, EPA examined the extent of invasion in estuaries with minimal exposure to ballast water discharges and aquaculture of exotic oysters, which are the primary invasion vectors in the region. Using observed percentages of NIS at the minimally exposed estuaries as a reference, the threshold for “minimally invaded” survey sites was set at 10 percent NIS (i.e., sites were classified as minimally invaded if NIS constituted 0 to 10 percent of the individuals collected). Survey sites were classified as “highly invaded” if NIS were more abundant than native species (more than 50 percent NIS) and as “moderately invaded” if NIS constituted 10 to 50 percent of the individuals.
- What the Data Show
Approximately 15 percent of the stations in the Columbian Province were highly invaded (i.e., abundance of NIS was greater than abundance of natives) and another 20 percent were moderately invaded (Exhibit 1). The EMAP survey showed that NIS were among the most frequently occurring anthropogenic stressors in this biogeographic region when compared to indicators of sediment contamination or eutrophication (Nelson et al., 2004).
The extent of invasion was not uniform, however, among exposed and minimally exposed estuaries. Estuaries with greater exposure to these invasion vectors were more invaded; 44 percent of the stations in the exposed estuaries were moderately to highly invaded compared to only 21 percent of the stations in minimally exposed estuaries (Exhibit 1). Nonetheless, the observation that 21 percent of the stations in these “pristine” estuaries were at least moderately invaded indicates that NIS can disperse widely once they are introduced into a region, so even estuaries with no direct exposure to ballast water or aquaculture are at risk of invasion.
- Limitations
-
This indicator presents baseline data only; trend information is not yet available.
-
Studies in the San Francisco Estuary (Lee et al., 2003) and in Willapa Bay, Washington (Ferraro and Cole, in progress) have shown that the percent of NIS can vary substantially among different types of soft-bottom communities—e.g., unvegetated sediment versus sea grass beds. Thus, regional background values for the Columbian Province as a whole may not be appropriate for specific community types.
-
This indicator represents percent NIS in individual benthic grabs of the soft-bottom community, but does not characterize the total number of NIS in the estuaries. It does not include benthic NIS not subject to grab sampling, particularly hard substrate organisms.
-
The data for the indicator were only collected during a summer index period and thus do not capture seasonal variations.
- The threshold values for “minimally invaded,” “moderately invaded,” and “highly invaded” are preliminary and require further research in order to establish their ecological significance. Specific values may differ in other biogeographic provinces.
-
This indicator presents baseline data only; trend information is not yet available.
- Data Sources
Data for this indicator were collected by two different studies: EPA’s National Coastal Assessment (NCA) and a special EPA study of minimally exposed estuaries. The complete results from these studies were not publicly available at the time this report went to press, but summary data from the 1999 NCA are available from Nelson et al. (2004, 2005), and the underlying sampling data can be obtained from EPA’s NCA database (U.S. EPA, 2007) (https://www.epa.gov/national-aquatic-resource-surveys/data-national-aquatic-resource-surveys). Results from the special study of minimally exposed estuaries will be published in the near future. Until then, data for this indicator can be obtained from EPA’s Western Ecology Division (U.S. EPA, 2006).