
Nitrogen and Phosphorus in Rivers and Streams
 Exhibit 1. Nitrogen in rivers and streams of the contiguous U.S., 2008-2014
Exhibit 2. Phosphorus in rivers and streams of the contiguous U.S., 2008-2014
Exhibit 1. Nitrogen in rivers and streams of the contiguous U.S., 2008-2014
Exhibit 2. Phosphorus in rivers and streams of the contiguous U.S., 2008-2014


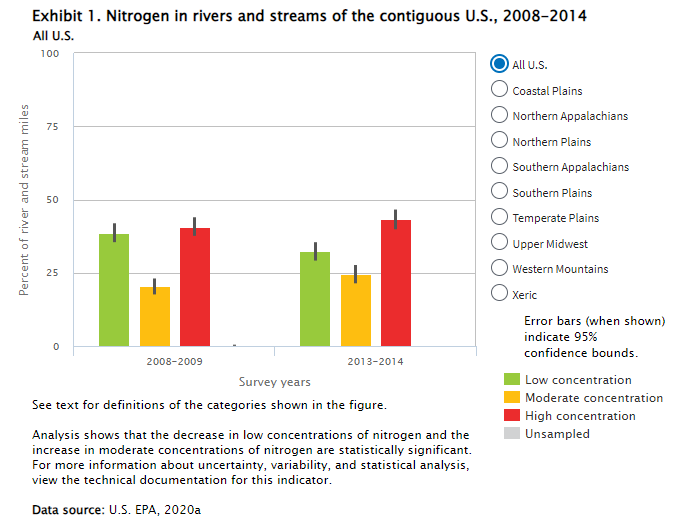


Hover your mouse over the display to reveal data. Click the "statistics" button above to add error bars to the display.
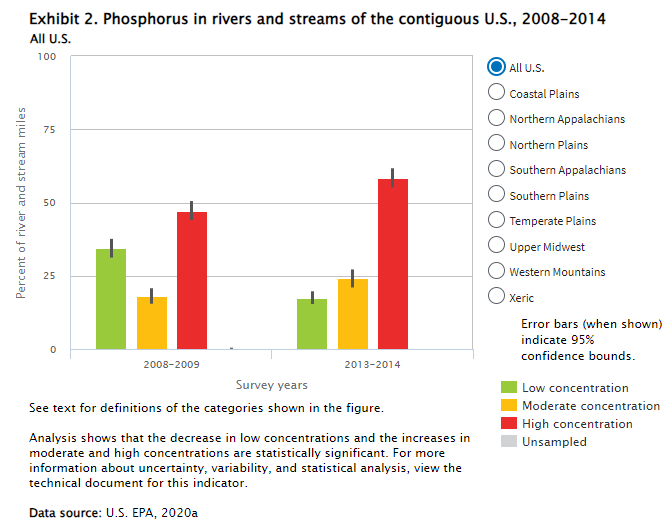
Hover your mouse over the display to reveal data. Click the "statistics" button above to add error bars to the display.
- Introduction
Nitrogen and phosphorus are essential elements in aquatic ecosystems. Both nutrients are used by plants and algae for growth (U.S. EPA, 2021). Excess nutrients, however, can lead to increased algal production in rivers, streams, and downstream lakes and coastal waters. In addition to being visually unappealing, excess algal growth can contribute to the loss of oxygen needed by fish and other animals, which in turn can lead to altered biological assemblages. Sources of excess nutrients include municipal sewage and septic tank drainfields, agricultural runoff, excess fertilizer application, and atmospheric deposition of nitrogen (Herlihy et al., 1998).
This indicator measures total nitrogen and total phosphorus based on data collected for EPA’s National Rivers and Streams Assessment (NRSA), a survey conducted throughout the contiguous U.S. approximately every five years. Crews sampled nearly 2,000 stream sites during spring and summer in each survey period using standardized methods (U.S. EPA, 2016b, 2020b). At each site, a water sample was collected at mid-depth in the river or stream and analyzed following standard laboratory protocols. The NRSA is based on a probabilistic design, so the results from representative sample sites can be used to make a statistically valid statement about nitrogen and phosphorus concentrations in all of the nation’s streams.
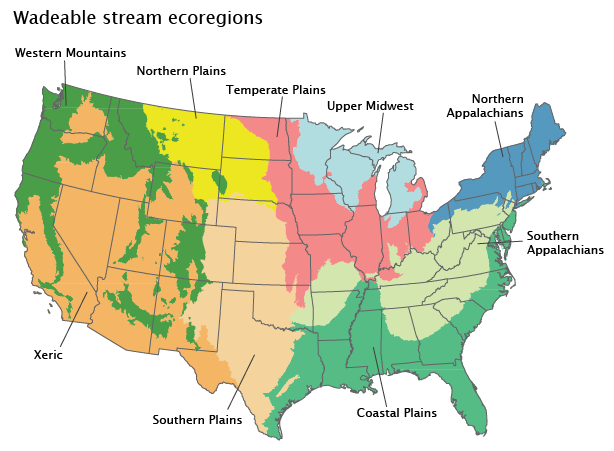
Because naturally occurring nutrient levels vary from one geographic area to another, rivers and streams were divided into nine broad ecoregions (U.S. EPA, 2020a), which were defined by the NRSA based on groupings of EPA Level III ecoregions (Omernik, 1987; U.S. EPA, 2012). In each ecoregion, a set of relatively undisturbed sites was sampled to determine the range of nutrient concentrations that would be considered “low.” Next, observed nitrogen and phosphorus concentrations from all sites were compared with the distribution of concentrations among the ecoregion’s reference sites. If the observed result was above the 95th percentile of the ecoregion’s reference distribution, the concentration was labeled “high.” This threshold was used because it offers a high degree of confidence that the observed condition is statistically different from the condition of the reference streams. Concentrations below the 75th percentile of the reference range were labeled “low,” indicating a high probability that the site is similar to the relatively undisturbed reference sites. Concentrations falling between the 75th and 95th percentiles were labeled “moderate.”
- What the Data Show
Nationwide, 32 percent of river and stream miles had low total nitrogen concentrations in 2013-2014, down from 39 percent in 2008-2009 (Exhibit 1). High nitrogen concentrations were found in 43 percent of river and stream miles in 2013-2014, up from 41 percent in 2008-2009. While the decrease in river and stream miles with low total nitrogen concentrations was statistically significant, the increase in river and stream miles with high nitrogen concentrations was not.
Low concentrations of phosphorus were found in 18 percent of river and stream miles in 2013-2014, down from 34 percent in 2008-2009 (Exhibit 2). High phosphorus concentrations were found in 58 percent of river and stream miles in 2013-2014, up from 47 percent in 2008-2009. Both of these national-scale changes were statistically significant.
Conditions vary by ecoregion (Exhibits 1 and 2). The Western Mountains had the highest percentage (60 percent) of river and stream miles with low nitrogen in 2013-2014. The Northern Plains had the highest proportion (40 percent) of river and stream miles with low phosphorus and the second-highest percentage (47 percent) of river and stream miles with low nitrogen in 2013-2014. The Southern Appalachians had the highest percentage of river and stream miles with high phosphorus (80 percent) and the Temperate Plans had the highest percentage of river and stream miles with high nitrogen (66 percent) in 2013-2014. Approximately half of the category scores shown in Exhibits 1 and 2 changed significantly between 2008-2009 and 2013-2014.
- Limitations
- Although the probability sampling design results in unbiased estimates for total nitrogen and phosphorus concentrations during the spring/summer sampling period, concentrations may be different during other seasons. Consistent use of the index period for sampling enables comparisons of population-wide changes over time.
- The 2008-2009 NRSA was the first to sample rivers and streams of all sizes. Thus, this indicator provides an assessment of change between two points in time. Some of these changes are statistically significant, and some are not. Detecting long-term trends will require more years of data.
- Data Sources
The results shown in this indicator come from EPA’s 2013-2014 NRSA (U.S. EPA, 2020a), which includes 2013-2014 data as well as revised estimates of 2008-2009 conditions that were originally published in EPA’s 2008-2009 NRSA (U.S. EPA, 2016). Data from individual stream sites can be obtained from https://www.epa.gov/national-aquatic-resource-surveys/data-national-aquatic-resource-surveys.