
Ambient Concentrations of Manganese Compounds in EPA Region 5
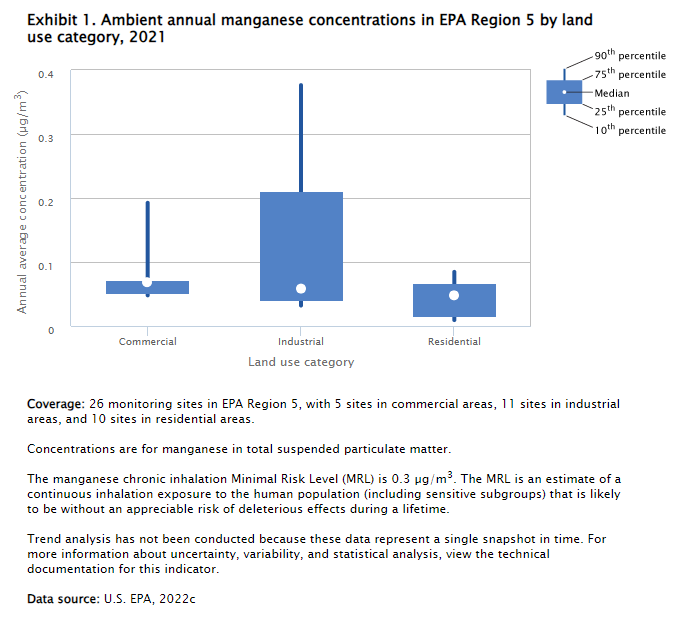
 Exhibit 1. Ambient annual manganese concentrations in EPA Region 5 by land use category, 2021
 Exhibit 2. Ambient annual manganese concentrations in EPA Region 5, 2000-2021




Hover your mouse over the display to reveal data.

Click the legend to turn layers on or off. Hover your mouse over the display to reveal data.
- Introduction
Manganese is a naturally occurring metal that is ubiquitous in the environment. Exposure to low levels of manganese in the diet is considered to be nutritionally essential for people and animals (ATSDR, 2012). However, exposures to elevated concentrations of manganese are harmful to human health and have been associated with subtle neurological effects, such as slowed eye-hand coordination. Manganese compounds are hazardous air pollutants emitted by iron and steel production plants, ferroalloy producers, power plants, coke ovens, and many smaller metal processing facilities. Manganese also may be contributed in border communities by vehicles using Canadian fuel with the additive methylcyclopentadienyl manganese tricarbonyl (MMT), though use of MMT in Canadian gasoline has decreased dramatically in recent years (ATSDR, 2012).
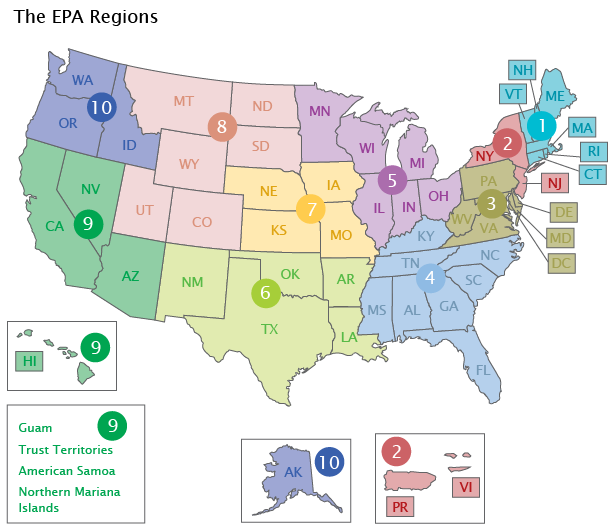
Although manganese compounds are air pollutants of concern nationwide, they are of special concern in EPA Region 5, which includes Illinois, Indiana, Michigan, Minnesota, Ohio, Wisconsin, and 35 tribes. For example, the Toxics Release inventory (TRI) shows that Region 5 has the highest manganese emissions of all EPA Regions, contributing 37 percent to the nationwide total over the past 5 TRI reporting years (2017-2021). Emissions from industrial sources in Region 5 occurred from various facilities, such as those that manufacture steel or process iron ores and alloys for steelmaking. Between 1998 and 2021, manganese emissions from point sources as reported to the TRI declined both nationally and in EPA Region 5. During this 34-year period, national manganese stack emissions reported to TRI decreased 76 percent, and Region 5 emissions declined 62 percent (U.S. EPA, 2022a).
EPA’s Air Toxics Screening Assessment (AirToxScreen) is intended to provide a better understanding of the health risks resulting from inhalation exposure to air toxics. The 2018 AirToxScreen results (U.S. EPA, 2022b) identify manganese compounds as the sixth largest contributor to neurological non-cancer health risk in the U.S. Based on the 2018 AirToxScreen, modeled estimates of ambient manganese compounds show that among the 100 census tracts with the highest concentrations nationwide, 49 are located in EPA Region 5.
This indicator presents ambient concentrations of manganese compounds measured as total suspended particulates (TSP) by direct monitoring. This indicator addresses manganese in the TSP fraction (not PM10 or PM2.5) because it is the most complete dataset in EPA Region 5 in terms of geographic and temporal coverage. TSP metals data have been commonly used in human health risk assessments. PM10 may be a more appropriate size fraction for evaluating people’s inhalation exposure to toxic metals (U.S. EPA, 2007), but PM10 metals data are sparse at this time, both nationally and in EPA Region 5. Data from a limited number of sites in EPA’s Air Quality System (AQS) with collocated PM10 and TSP speciation monitors suggest that the proportion of manganese in PM10 versus TSP is about 50 percent at most sites and can be as high as 75 percent. TSP manganese data therefore should be considered a conservative estimate of PM10 manganese exposures. PM2.5 metals data are plentiful since the establishment of the Speciation Trends Network in 2000, but this size fraction is believed to underestimate human exposures.
Data were considered for both urban and suburban monitoring sites in EPA Region 5. Average manganese concentrations were calculated for the 26 monitoring sites with a complete year of data reported to the AQS national database in 2021; and a concentration trend was determined using the 29 monitoring sites with 11 or more complete years of data between 2000 and 2021. As annual average concentrations are representative of long-term inhalation exposures, the ambient monitoring data are displayed in comparison with the manganese Minimal Risk Level (MRL). The MRL was developed by the Agency for Toxic Substances and Disease Registry (ATSDR) as an estimate of a chronic inhalation exposure (365 days or longer) that is likely to be without appreciable risk of adverse non-cancer effects. The MRL for manganese is 0.3 micrograms per cubic meter (μg/m3), based on impairment of neurobehavioral function in people. At exposures increasingly greater than the MRL, the potential for harmful effects increases (ATSDR, 2012). Monitoring sites were classified into different categories based on land use as defined in AQS.
- What the Data Show
In 2021, the median of the annual average ambient concentrations of manganese as TSP in EPA Region 5 were 0.048 µg/m3 at the 10 residential sites, 0.068 µg/m3 at the 5 commercial sites, and 0.058 µg/m3 at the 11 industrial sites (Exhibit 1). The 90th percentile concentrations in 2021 were 0.085 µg/m3 at the residential sites, 0.192 µg/m3 at the commercial sites, and 0.376 µg/m3 at the industrial sites. In 2021, two of the monitoring sites had annual average manganese concentrations higher than the MRL; both sites were categorized as industrial. Occasional spikes at these monitors can result in more variability in manganese concentrations and drive higher averages.
Average annual manganese concentrations averaged across 29 trend sites exhibited considerable year-to-year variation and decreased 53 percent between 2000 and 2021 (Exhibit 2). The median of site averages decreased 47 percent between 2000 and 2021. The trend sites had the following land use designations: commercial (6 sites), industrial (15 sites), and residential (8 sites).
- Limitations
- AQS data represent several sites per state, but do not have full geographic or temporal coverage. Some emissions “hotspots” are included, while others may exist that have not been monitored.
- The land use categories are only generally indicative of the area represented by an ambient air monitor. For example, a site categorized as “industrial” may adjoin a densely populated community where many residents are exposed to ambient pollution.
- Data Sources
Summary data in this indicator were provided by EPA Region 5, based on ambient air monitoring data for manganese compounds reported in EPA’s AQS (U.S. EPA, 2022c) (https://www.epa.gov/aqs). Trends in this indicator are based on the subset of monitoring stations located in EPA Region 5 that have sufficient manganese concentration data to assess trends over the period of record.