
Ambient Concentrations of Carbon Monoxide
 Exhibit 1. Ambient 8-hour CO concentrations in the U.S., 1990-2021
 Exhibit 2. Ambient 8-hour CO concentrations above the level of the current NAAQS in the U.S., 1990-2021
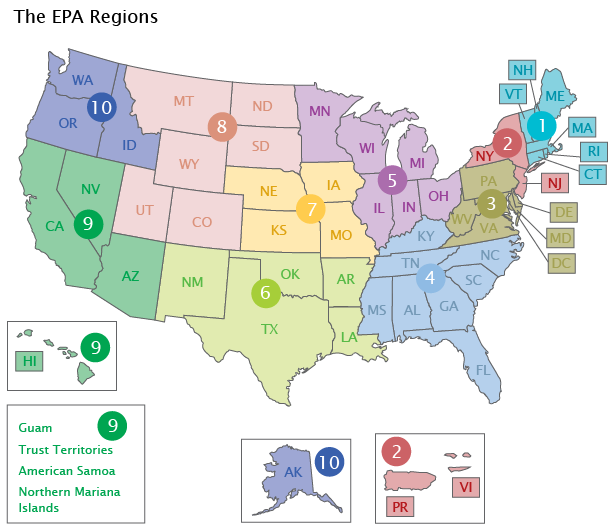
Exhibit 3. Ambient 8-hour CO concentrations in the contiguous U.S. by EPA Region, 1990-2021
Exhibit 2. Ambient 8-hour CO concentrations above the level of the current NAAQS in the U.S., 1990-2021
Exhibit 3. Ambient 8-hour CO concentrations in the contiguous U.S. by EPA Region, 1990-2021


Click the legend to turn layers on or off. Hover your mouse over the display to reveal data.
Hover your mouse over the display to reveal data.

Click the legend to turn layers on or off. Hover your mouse over the display to reveal data.
- Introduction
Carbon monoxide (CO) gas forms primarily when carbon fuels are not burned completely. Elevated ambient air concentrations of CO are hazardous because inhaled CO enters the bloodstream and reduces the amount of oxygen that the blood can deliver to the body's organs (like the heart and brain) and tissues. At extremely high levels, CO can cause death. People with several types of heart disease already have a reduced capacity for pumping oxygenated blood to the heart, which can cause them to experience myocardial ischemia (reduced oxygen to the heart), often accompanied by chest pain (angina), when exercising or under increased stress. For these people, short-term CO exposure further affects their body's already compromised ability to respond to the increased oxygen demands of exercise or exertion (U.S. EPA, 2010).
Motor vehicle exhaust currently accounts for the majority of CO emissions nationwide, and as much as 75 percent of CO emissions in cities with high traffic congestion. Other anthropogenic sources of CO emissions include fossil fuel combustion for heating and power generation, metals processing, and chemical manufacturing. The highest ambient air concentrations of CO most frequently occur during and just after the morning and evening rush hours (U.S. EPA, 2010).
This indicator presents ambient air CO concentrations in parts per million (ppm) from 1990 to 2021, based on continuous measurements averaged over 8-hour time frames. The 8-hour standard is indicative of exposures occurring over a sustained period of time, for example, an outdoor worker's exposure over the course of a work day. This indicator displays trends in the annual second highest 8-hour CO concentrations for 53 sites in 41 counties nationwide that have consistent data for the period of record in the State and Local Air Monitoring Stations network or by other special purpose monitors. It also shows trends in the average 8-hour measurements in each EPA Region. This indicator's exhibits display the National Ambient Air Quality Standard (NAAQS) for CO as a point of reference, but the fact that the national or any regional second highest 8-hour values fall below the standard does not mean that all monitoring sites nationally or in the EPA Regions also are below the standard. The indicator displays trends in the number of the 53 trend sites nationwide at which reported CO concentrations were above the level of the 8-hour standard in each year from 1990 to 2021, but this statistic is not displayed for each EPA Region.
- What the Data Show
The 2021 annual second highest 8-hour CO concentration averaged across 53 monitoring sites nationwide was 79 percent lower than that for 1990. This 2021 concentration is tied for the lowest level observed over the past 32 years (Exhibit 1). The downward trend in CO concentrations parallels the downward trend observed in CO emissions, which has been attributed largely to decreased emissions from mobile sources (the CO Emissions indicator). In addition, of the 53 sites used to determine this trend (out of 252 total monitoring sites that were operating in 2021), the number reporting CO concentrations above the level of the CO standard declined to zero in 1996 and remained at zero until 2020, when one monitoring site reported CO concentrations above the level of the CO standard (Exhibit 2).
Also shown in Exhibit 1 are the 90th and 10th percentiles based on the distribution of annual statistics at the monitoring sites. This provides additional graphical representation of the distribution of measured concentrations across the monitoring sites for a given year. Thus, the graphic displays the concentration range where 80 percent of measured values occurred for that year.
Consistent with the nationwide trend, CO levels in most EPA Regions steadily decreased since 1990, with percent reductions over this period ranging from 69 percent (Region 5) to 85 percent (Regions 1 and 8) (Exhibit 3). The long-term CO concentration trend for Region 10 steadily decreased from 1990 to 2021, with the exception of an increase in 2020 resulting from intense wildfire and smoke in close proximity to monitors in the Portland, Oregon area mid-September 2020.
- Limitations
- Because most CO monitoring sites are located in high-traffic urban areas, the nationwide trends presented in this indicator might not accurately reflect conditions outside the immediate urban monitoring areas.
- Because of the relatively small number of trend sites in some EPA Regions, the regional trends are subject to greater uncertainty than the national trends. Some EPA Regions with low average concentrations may include areas with high local concentrations, and vice versa. In addition, the 53 trend sites in this indicator are not dispersed uniformly across all states in the EPA Regions. The 53 trend sites are located in 21 states. In the remaining 29 states, there currently are insufficient long-term data from the available monitoring sites to include in this indicator.
- To ensure that long-term trends are based on a consistent set of monitoring sites, selection criteria were applied to identify the subset of CO monitoring sites with sufficient data to assess trends since 1990. Monitoring sites without sufficient data are not included in the trend analysis. Some excluded monitoring sites reported CO concentrations above the level of the CO standard over the time frame covered by this indicator. In 2021, no monitoring sites in the U.S. measured CO concentrations above the level of the NAAQS.
- Data Sources
Summary data in this indicator were downloaded from EPA’s National Air Quality: Status and Trends of Key Air Pollutants website (U.S. EPA, 2022a) (https://www.epa.gov/air-trends). The summary data are based on CO ambient air monitoring data in EPA’s Air Quality System. National and regional trends in this indicator are based on the subset of CO monitoring stations that have sufficient data to assess trends since 1990.