Acidity in Lakes and Streams
![]() Exhibit 1. Lake and stream acidity in selected acid-sensitive regions in the U.S., 1991-2016
Exhibit 1. Lake and stream acidity in selected acid-sensitive regions in the U.S., 1991-2016
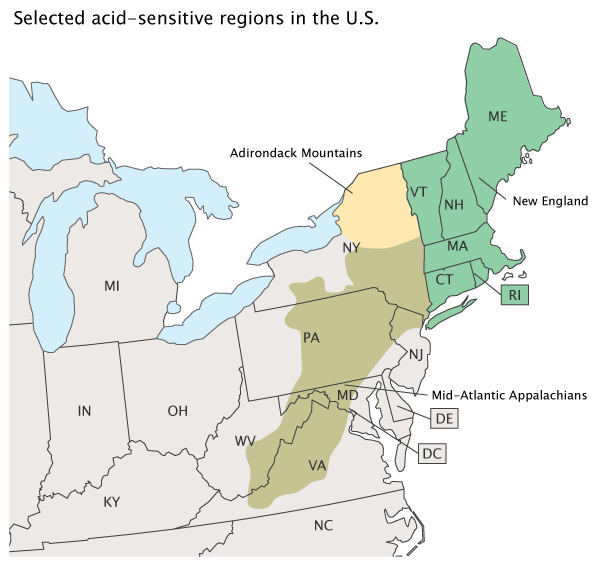
![]() Exhibit 2. Areas with acid-sensitive waters in the contiguous U.S.
Exhibit 2. Areas with acid-sensitive waters in the contiguous U.S.
Click the legend to turn layers on or off. Hover your mouse over the display to reveal data.

Use the controls to pan or zoom the map.
- Introduction
Acid deposition (e.g., nitrate and sulfate) resulting from air pollution can have serious effects on both terrestrial and aquatic ecosystems. For example, aquatic organisms in acidified waters can develop calcium deficiencies that weaken bones and exoskeletons and cause eggs to be weak or brittle. Acidified waters can impair the ability of fish gills to extract oxygen from water and change the mobility of certain trace metals (e.g., aluminum, cadmium, manganese, iron, arsenic, and mercury), which in turn can reduce the health or cause the death of fish and other species (NAPAP, 1991). Acid deposition indicators reflect the impacts and patterns of acid deposition on ecosystems and explain whether actions taken to control acid deposition are causing improvements or recovery of impacted ecosystems.
The susceptibility of a surface water body (e.g., a lake or stream) to acidification depends on the ability of the water and soils to neutralize the acid deposition it receives. The best measure of this ability is known as acid neutralizing capacity (ANC), which characterizes the ability of a water body to neutralize inputs of acidity. Every surface water has a measurable ANC, which depends largely on the surrounding watershed’s physical characteristics such as geology, soils, hydrology, and size. The ANC of a surface water reflects the relative proportions of positive (cation) and negative (anion) ions entering the water from sources such as the atmosphere, soil, and the bedrock surrounding and underlying the water body. The higher the ANC, the more acid deposition a surface water body can neutralize, making it less susceptible to acidification and ecological impacts. As ANC decreases and approaches zero, the ability of the environment to neutralize acidity from air pollution decreases. Surface water with a high ANC, greater than 200 microequivalents per liter (µeq/L) is often insensitive to acidification; surface water with an ANC less than 50 µeq/L is considered highly sensitive to acidification (is often seasonally acidic); and surface water with an ANC less than 0 µeq/L is considered chronically acidic, meaning the watershed no longer has the capacity to neutralize further acid deposition and impacts to aquatic life are likely (U.S. EPA, 1988, 2003). ANC can be negative when anions exceed non-proton cations (i.e., when there are free protons [H+ ions] in solution) and aquatic life is often absent.
The National Acid Precipitation Assessment Program identified several regions in the U.S. as containing many of the surface waters sensitive to acidification (Exhibit 2). Where soil buffering capacity is poor, lakes and streams may be particiularly vulnerable to acidification (NAPAP, 1991).
This indicator is derived from ANC measurements on probability survey samples representing 8,664 lakes and 75,113 km of streams in the three geographic regions shown in Exhibit 2. These measurements were collected as part of the 74 monitored lakes and 56 monitored streams of the Temporally Integrated Monitoring of Ecosystems (TIME) project and on 70 additional acid-sensitive lakes and 70 acid-sensitive streams of the Long-Term Monitoring (LTM) project, for which data are available between 1991 and 2016 (U.S. EPA, 2018a). The lakes sampled include only those in areas potentially sensitive to acidification with areas greater than 1 hectare. This indicator focuses only on the northeastern and mid-Atlantic U.S.; because monitoring is not ongoing for western, Midwestern, and southeastern water bodies, trend data for those parts of the country are not available.
- What the Data Show
TIME survey data from the early 1990s demonstrate acidity measurements of lakes in the Adirondack Mountains and New England, and from streams in the Mid-Atlantic Appalachians (southern New York, west-central Pennsylvania, Virginia, and eastern West Virginia) had increased to a degree where many water bodies were considered “chronically acidic” (most acidic). Since then, many of these water bodies improved and are no longer classified as such in 2016 (Exhibit 1). Specifically, between 1991-1994 and 2016, the percent of chronically acidic lakes in the Adirondack Mountains decreased by 59 percent (from 15.0 percent of lakes to 6.2 percent of lakes). Likewise, chronically acidic lakes in New England decreased by 47 percent (from 5.5 percent of lakes to 2.9 percent of lakes). The number of chronically acidic streams in the Mid-Atlantic region of the Appalachian Mountains (represented as stream kilometers) showed a less dramatic decline, largely due to local geology and soil characteristics. There, the number of chronically acidic stream kilometers decreased by 21 percent (from 4.3 percent of streams in 1991-1994 to 3.4 percent of streams in 2015). In addition, lakes and streams not chronically acidic have shown considerable improvement in water quality as air quality has improved. This trend suggests that surface waters in these three regions are beginning to recover from acidification, though acidic surface waters are still found.
The trend of increasing ANC in the Adirondack Mountains, New England, and the Mid-Atlantic Appalachian Mountains between the early 1990s and 2016 corresponds with a decrease in acid deposition in each of these regions (the Acid Deposition indicator) and reduced air emissions of the main precursors to acid deposition, which are sulfur dioxide (the Sulfur Dioxide Emissions indicator) and nitrogen oxides (the Nitrogen Oxides Emissions indicator).
- Limitations
- ANC sampling is limited to three regions, all in the Northeast and Mid-Atlantic. (There is no long-term coverage in the Southeast, West, or Midwest.) These three regions were chosen for sampling because previous research has shown that they are among the most sensitive to acid deposition due to the soils and other watershed characteristics. In addition, as the Acid Deposition indicator shows, many of these regions receive the highest rates of acid deposition in the U.S. For these reasons, the waters sampled are likely to be at the greatest risk of becoming acidified.
- Interpreting trends for this indicator is complicated because multiple factors contribute to changes in ANC levels. For example, in areas where watershed soil characteristics are changing (e.g., decreases in concentrations of base cations in the soil in the Mid-Atlantic region), even dramatic reductions in acid deposition will not necessarily result in large rebounds in ANC levels.
- Data Sources
Summary data in this indicator were provided by EPA’s Office of Atmospheric Programs and are taken from a publication documenting how surface waters have responded to reduced air emissions of acid rain precursors (U.S. EPA, 2003, 2018a) and from recent unpublished results (U.S. EPA, 2018b). Trends are based on data collected in two networks: the TIME project and the LTM project, which are operated by numerous collaborators in state agencies, academic institutions, and other federal agencies. The trend data in this indicator are based on observations documented in several publications (e.g., U.S. EPA, 2003, 2018a).