Sulfur Dioxide Emissions
![]() Exhibit 1. Anthropogenic SO2 emissions in the U.S. by source category, 1990-2014
Exhibit 1. Anthropogenic SO2 emissions in the U.S. by source category, 1990-2014
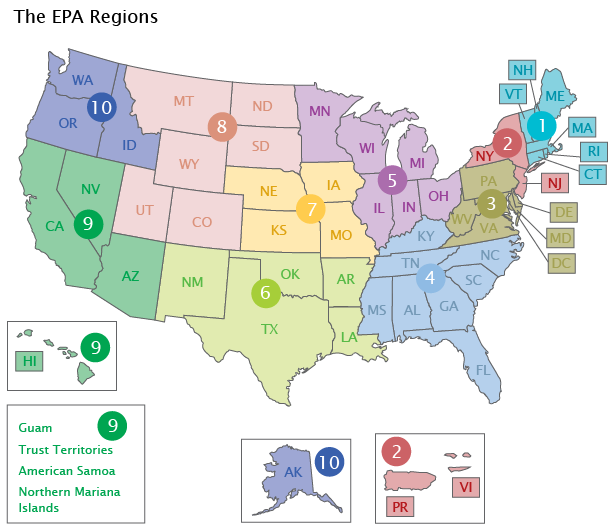
![]() Exhibit 2. Anthropogenic SO2 emissions in the U.S. by EPA Region, 1990-2014
Exhibit 2. Anthropogenic SO2 emissions in the U.S. by EPA Region, 1990-2014
Click the legend to turn layers on or off. Hover your mouse over the display to reveal data.
Click the legend to turn layers on or off. Hover your mouse over the display to reveal data.
- Introduction
Sulfur dioxide (SO2) belongs to the family of sulfur oxide (SOx) gases. These gases are formed when fuel containing sulfur (mainly coal and oil) is burned (e.g., for electricity generation) and during metal smelting and other industrial processes. High concentrations of SO2 are associated with multiple health and environmental effects. The highest concentrations of SO2 have been recorded in the vicinity of large industrial facilities. SO2 emissions are an important environmental issue because they are a major precursor to ambient PM2.5 concentrations.
Short-term exposure to airborne SO2 has been associated with various adverse health effects (ATSDR, 1998; U.S. EPA, 2017). Multiple human clinical studies, epidemiological studies, and toxicological studies support a causal relationship between short-term exposure to airborne SO2 and respiratory morbidity. The observed health effects have included respiratory symptoms, airway inflammation, and increased emergency department visits and hospitalizations for all respiratory causes. These studies further suggest that asthmatics, children, older adults, and people who spend a lot of time outdoors at increased exertion levels are potentially susceptible or vulnerable to these health effects (U.S. EPA, 2017). In addition, SO2 reacts with other air pollutants to form sulfate particles, which are constituents of fine particulate matter (PM2.5). Inhalation exposure to PM2.5 has been associated with various cardiovascular and respiratory health effects (see PM Concentrations indicator).
Many other environmental effects are associated with high concentrations of SO2. For example, airborne SO2, along with nitrogen oxides (NOx), contributes to acidic deposition (the Acid Deposition indicator); SO2 is a major precursor to PM2.5 (the PM Concentrations indicator); and SO2 contributes to impaired visibility (the Regional Haze indicator). SO2 also can harm vegetation by increasing foliar injury, decreasing plant growth and yield, and decreasing the number and variety of plant species in a given community. Finally, SO2 can accelerate the corrosion of materials (e.g., metals, concrete, limestone) that are used in buildings, statues, and monuments (U.S. EPA, 2008).
This indicator presents SO2 emissions from traditionally inventoried anthropogenic source categories: (1) “Fuel combustion: selected power generators,” which includes emissions from coal-, gas-, and oil-fired power plants that are required to use continuous emissions monitors (CEMs) to report emissions as part of the Acid Rain Program (ARP); (2) “Fuel combustion: other sources,” which includes industrial, commercial, and institutional sources, as well as residential heaters and boilers not required to use CEMs; (3) “Other industrial processes,” which includes chemical production and petroleum refining; and (4) “On-road vehicles,” which includes cars, trucks, buses, and motorcycles and “Nonroad vehicles and engines,” such as farm and construction equipment, lawnmowers, chainsaws, boats, ships, snowmobiles, and aircraft. Because a substantial portion of airborne SO2 comes from fossil fuel combustion in electric utilities, this indicator includes the separate “Fuel combustion: selected power generators” category in addition to the other categories presented in the other emissions indicators.
SO2 emissions data are tracked by the National Emissions Inventory (NEI). The NEI is a composite of data from many different sources, including industry through the CEM program, EPA models, and numerous state, tribal, and local air quality management agencies. Different data sources use different data collection methods, and many of the emissions data are based on estimates rather than actual measurements. For major electricity generating units, most data come from CEMs that measure actual emissions. For other fuel combustion sources and industrial processes, data are primarily from state, local, and tribal air quality management agencies and are estimated primarily using emission factors. Emissions from on-road and nonroad sources were estimated using EPA-approved models, often using state-supplied model inputs (U.S. EPA, 2018a).
NEI data have been compiled since 1990 and cover all 50 states and their counties, D.C., the U.S. territories of Puerto Rico and Virgin Islands, and some of the territories of federally recognized American Indian nations. Data are presented for 1990, 1996, 1999, 2002, 2005, 2008, 2011, and 2014. With the exception of 1993, the NEI data are published on a triennial cycle, thus an annual trend is not readily available. The NEI data are the basis of the national and regional air pollutant emission trends shown in this indicator (U.S. EPA, 2018c).
- What the Data Show
National estimated anthropogenic SO2 emissions decreased 80 percent between 1990 and 2014 (from 23.1 million tons to 4.5 million tons) (Exhibit 1). This downward trend resulted primarily from emissions reductions at electric utilities. In 2014, air emissions from electric utilities accounted for 72 percent of the nationwide SO2 emissions.
Estimated anthropogenic SO2 emissions declined in all EPA Regions between 1990 and 2014 (Exhibit 2). During this time frame, the largest percent reductions in SO2 emissions were seen in Regions 1 (92 percent) and 2 (94 percent), and the smallest reductions were observed in Regions 6 (58 percent) and 8 (70 percent).
- Limitations
- Though SO2 emissions from most electric utilities are measured directly using continuous monitoring devices, SO2 emissions data for most other source types are estimates. These estimates are generated using well-established approaches, including extensively reviewed mobile source models. These estimates have uncertainties inherent in the emission factors and emissions models used to represent sources for which emissions have not been directly measured.
- SO2 emissions estimates through the NEI are provided only for the triennial NEI years starting in 1990 and continuing through 2014, with the exception of 1993.
- SO2 emissions from “miscellaneous sources,” including forest wildfires and prescribed burning, are not included in the total anthropogenic emissions. Yearly fluctuations in forest wildfire emissions have the potential to mask trends in anthropogenic emissions and therefore have been excluded from this indicator’s exhibits.
- The methodology for estimating emissions is continually reviewed and is subject to revision. Trend data prior to these revisions must be considered in the context of those changes.
- Not all states and local air quality management agencies provide the same data or level of detail for a given year.
- NEI emissions from on-road mobile sources prior to 2002 were estimated using the MOBILE model, and 2002, 2005, 2008, 2011, and 2014 emissions for this source category were estimated using different versions of the MOVES model which applied different methods. Therefore, the outputs may not be directly comparable across years; the change in model is reflected as part of the trend shown.
- Data Sources
Summary data in this indicator were provided by EPA’s Office of Air Quality Planning and Standards, based on anthropogenic SO2 emissions data in the NEI. The most recent data are taken from Version 2 of the 2014 NEI (U.S. EPA, 2018b). These and earlier emissions data can be accessed from EPA’s emission inventory website (https://www.epa.gov/air-emissions-inventories). The MOVES data used for 2002 and 2005 are not available through the 2002 and 2005 website, but these data can be accessed from EPA’s emission modeling website (https://www.epa.gov/air-emissions-modeling). This indicator aggregates NEI data by source category and EPA Region.