
Grantee Research Project Results
2011 Progress Report: Epidemiological Studies on Extra Pulmonary Effects of Fresh and Aged Urban Aerosols from Different Sources
EPA Grant Number: R832415C002Subproject: this is subproject number 002 , established and managed by the Center Director under grant R832415
(EPA does not fund or establish subprojects; EPA awards and manages the overall grant for this center).
Center: Rochester PM Center
Center Director: Oberdörster, Günter
Title: Epidemiological Studies on Extra Pulmonary Effects of Fresh and Aged Urban Aerosols from Different Sources
Investigators: Peters, Annette , Utell, Mark J. , Zareba, Wojciech , Phipps, Richard , Wichmann, Heinz-Erich , Henneberger, Alexandra , Breitner, Susanne , Stoelzel, M , Rückerl, Regina
Institution: GSF-National Research Center for Environment and Health , University of Rochester
EPA Project Officer: Chung, Serena
Project Period: October 1, 2005 through September 30, 2010 (Extended to September 30, 2012)
Project Period Covered by this Report: October 1, 2010 through September 30,2011
RFA: Particulate Matter Research Centers (2004) RFA Text | Recipients Lists
Research Category: Human Health , Air
Objective:
OBJECTIVE(S) OF THE RESEARCH PROJECT
The objective of the epidemiological study is to examine the effect of fine and ultrafine particles on systemic responses, endothelial and cardiac function. The study was conducted in Augsburg, Germany, between March 19th 2007 and December 17th 2008.
The specific aims of the study are to:
Aim #1: Determine the effect of ambient fine and ultrafine particles on an acute phase reaction in the blood of subjects with type 2 diabetes mellitus (T2DM), impaired glucose tolerance (IGT) and potential genetic susceptibility (gen. susc.).
Aim #2: Determine the effect of ambient fine and ultrafine particles on pro-thrombotic states of the blood in the above subject panels.
Aim #3: Determine the effect of ambient fine and ultrafine particles on endothelial dysfunction as a key element of coronary vulnerability in a subset of the above subject panels.
Aim #4: Determine the effect of ultrafine particles on cardiac function as characterized by ECG
measures of autonomic function and repolarization in a subset of the above subject panels.
The objectives have not been altered during this reporting period.
Approach:
The period covered by the report included:
- The completion of all parts of data management.
- The performing of statistical analyses with emphasis on effects on ECG and blood parameters. (3) The preparation of manuscripts with emphasis on effects on ECG and blood parameters.
In the following we give an overview over selected descriptive and regression results.
Examinations
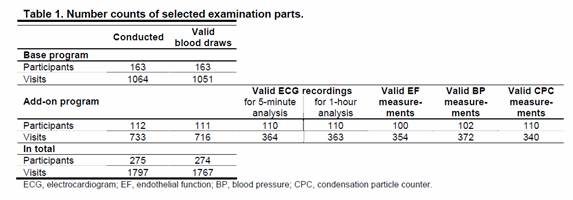
275 individuals participated in 1797 visits with a mean of 6.5 visits per person. At each visit (base program) a blood withdrawal was conducted. Air pollution was measured at a central measurement site in Augsburg throughout the complete study period. In addition (add-on program), for a subgroup of 112 participants personal measurements of ultrafine particles using a portable condensation particle counter (CPC) as well as temperature, humidity and noise were conducted in up to four visits. A diary collected data on behavior and exposure to air pollutant such as from cooking or ETS exposure during the period of personal measurements. Furthermore, endothelial function as a key element of coronary vulnerability and cardiac function characterized by electrocardiogram (ECG) measures were assessed in this subset. Table 1 shows different number counts in the base and add-on program.
Associations between air pollution and blood markers of inflammation and coagulation
As defined in specific aims #1 and #2 we investigated the association between blood markers of inflammation and coagulation in patients with IGT or type 2 diabetes and patients with a genetic susceptibility on the detoxifying pathway. Specifically, we looked at high sensitivity C-reactive protein (CRP), Interleukin 6 (IL-6), soluble CD40Ligand (sCD40L), plasminogen activator inhibitor 1 (PAI-1), fibrinogen, and myeloperoxidase (MPO).
Data on particles with an aerodynamic diameter smaller than 10 or 2.5 µm (PM10 and PM2.5, respectively), and particle number concentration (PNC) were collected at an urban background monitoring site south of the city center. We calculated individual 24 hour lags from lag 0 up to lag 4 as well as the 5-day average exposure. To estimate the associations between air pollutants and blood markers, additive mixed models with random patient effect were used. A confounder model was built for each blood marker separately, adjusting for long term time trend, meteorology (temperature, relative humidity), and weekday. Penalized splines were used to allow for non-linear confounder adjustment.
The first analyses were conducted taking patients with diabetes and patients with IGT together in one group based on the recommendations by the scientific advisory board. In secondary analyses, we also analyzed the three panels separately.
Panel description
On average, the panel of the genetically susceptible was younger and slimmer compared to the panel of T2DM or IGT. They also reported less accompanying cardiovascular diseases and took less medication. Regarding the blood marker levels, the largest difference was seen in CRP with lower levels in the panel of genetically susceptible individuals, while the other blood markers did not differ significantly (Table 2).

Regression Results
Table 3 sums up the results for the two panels for all blood markers. The results show clear differences between the two panels, with stronger associations for the panel of genetically susceptibles. Except for sCD40L, associations also point in different directions for both panels.

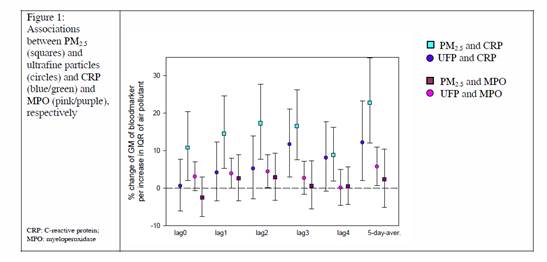
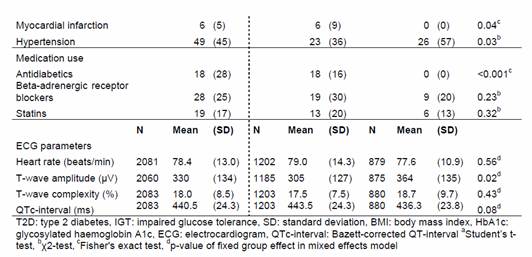
The clearest association was found for CRP and MPO in the panel of genetically susceptible individuals. For CRP, positive associations were seen for almost all lags, except for lag 4, and the five- day-average. The pattern was similar, however not as strong, for MPO (Figure 1).
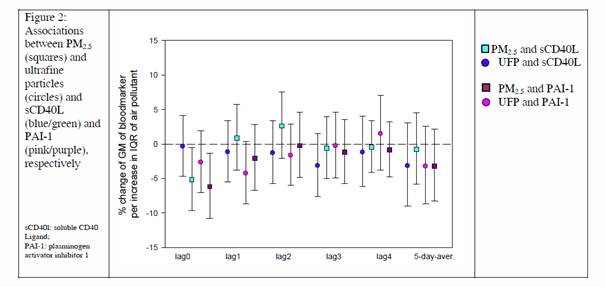
The coagulation markers sCD40L and PAI-1 showed an immediate decrease in association with particles, especially for PM2.5. No association as see for later lags (Figure 2).
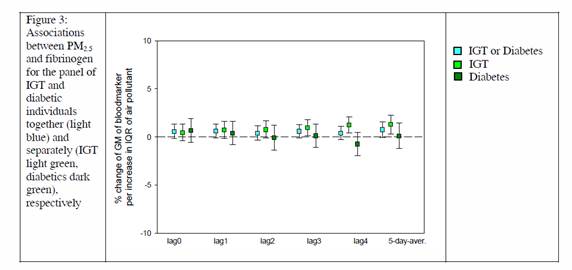
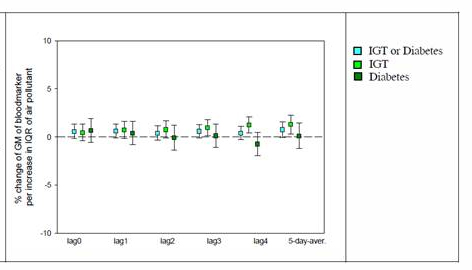
Results for the panel of patients with diabetes or IGT were smaller and mostly non-significant. Separate analyses for the panel with IGT and the panel with diabetic individuals revealed that the associations were mostly driven by the panel with IGT as shown for Fibrinogen in Figure 3.
Associations between air pollution and ECG measure
Effects of personally measured PNC and ambient air pollution on heart rate (HR) and heart rate variability (HRV) parameters in diseased individuals (with T2DM and IGT)
In previous analyses we observed effects of 5-minute averages of personally measured PNC on 5- minute intervals of heart rate (HR) as well as standard deviation of normal-to-normal intervals (SDNN) in 32 participants with T2DM and 32 participants with IGT. In particular, we detected a concurrent -
0.56% (-1.02; -0.09%) decrease in SDNN in association with an increase of 16,000 personal PNC
particles/cm³. Furthermore, an IQR (12.3µg/m³) increase in 1h-averages of ambient PM2.5 led to a -
3.38% decrease in 1h-intervals of SDNN. We conducted several sensitivity analyses in order to test the
robustness of these findings.
Effects of personal PNC on SDNN did not change when excluding participants taking statins or additionally adjusting for ambient 1h-averages of PM2.5. We observed slightly weaker PNC effects when excluding participants with an intake of beta-blockers or visits with cooking. However, PNC effects were stronger in participants who were not exposed to environmental tobacco smoke or when adjusting for personally measured 5min-averages of noise exposure. The sensitivity analyses also showed only slight changes in PM2.5 effects on SDNN (Table 4).
Immediate Ozone Effects on Heart Rate and Repolarization Parameters
We investigated the associations between 1h-averages of ozone and heart rate (HR), Bazett-corrected QT-interval (QTc), T-wave amplitude (Tamp) and T-wave complexity (Tcomp) in 64 individuals with T2D or IGT and in 46 healthy individuals with a potential genetic predisposition. Additive mixed models with random participant effects and a first-order autoregressive covariance structure accounting for autocorrelation between the repeated measurements were applied. Models were adjusted for ambient meteorology and time trends. Penalized splines were used to allow for non-linear confounder adjustment. Data were analyzed with SAS statistical package (version 9.2; SAS Institute Inc., Cary, NC, USA).
Panel description
Table 5 describes the baseline characteristics and the ECG parameters of the participants.
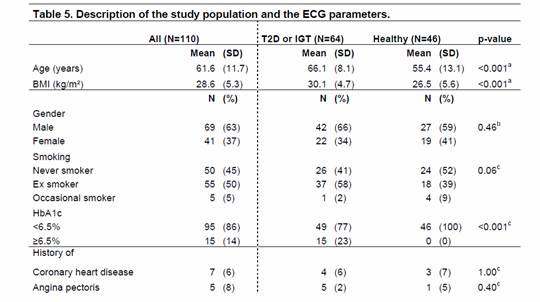
Participants with T2D or IGT were older, more often overweight, less hypertensive, and comprised more individuals with a previous MI in comparison to healthy participants with a potential genetic predisposition. As expected, elevated levels of glycosylated hemoglobin A1c and use of antidiabetic medication was only observed in participants with T2D and IGT. With regard to the ECG parameters, we only detected a significant difference between the two groups for Tamp with higher values in healthy participants. According to the median of participant-specific Spearman correlation coefficients HR showed a moderate correlation with Tcomp and QTc (r=0.6). Tcomp was negatively correlated with Tamp (r=-0.6). All other ECG parameters were uncorrelated (r<|0.5|). For all further statistical analyses Tcomp was log-transformed in order to produce normally distributed residuals.
During the study period the 1h-average concentration of ozone (± standard deviation) was 45.9µg/m³ (±33.3µg/m³). During the whole study period 1h-averages of ozone never exceeded the German information (180µg/m³) and alert threshold (240µg/m³).
Regression Results
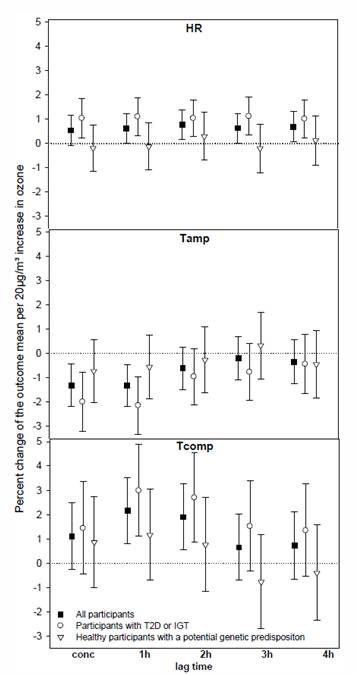
Figure 4 shows the percent changes of the mean ECG parameters per 20 µg/m³ increase in ozone together with 95%-confidence intervals (CI). Elevated ozone levels led to a marginal concurrent 0.54% [95%-CI: -0.07;1.16%] increase in HR and to 1h4h delayed increases about 0.6-0.7% in all participants showing the strongest association with a 2h lag (0.78% [0.18;1.37%]). Ozone effects were more pronounced in individuals with T2D or IGT for all lags showing percent changes in HR about 1%. HR did not change due to ozone exposure in individuals with a potential genetic predisposition. We observed concurrent and 1h lagged T-wave flattening of -1.31% [-2.19;- 0.42%] and -1.32% [-2.19;-0.45%] associated with elevated ozone levels, respectively. This association was predominantly detected in participants with T2D or IGT (concurrent and 1h lagged ozone effects: -1.99% [-3.20;-0.78%] and -2.14% [-3.32;-0.96%]), whereas healthy subjects showed a weaker reduction in Tamp. Furthermore, Tcomp increased in association with elevated ozone levels among all participants by 2.12% [0.81;3.52] and 1.89% [0.55;3.26%] with a lag of 1h and 2h, respectively. Again, only participants with metabolic disorders reacted to ozone exposure. No ozone effects were seen for QTc in either subgroup.
Figure 4. Concurrent and delayed effects of 1h-averages of ozone on 1h-averages of heart rate (HR), T-wave amplitude (Tamp), and T-wave complexity (Tcomp) in all participants, in individuals with type 2 diabetes (T2D) or impaired glucose tolerance (IGT) and in healthy individuals with a potential genetic predisposition.

Progress Summary:
The period covered by the report included:
(1) The completion of all parts of data management.
(2) The performing of statistical analyses with emphasis on effects on ECG and blood parameters.
(3) The preparation of manuscripts with emphasis on effects on ECG and blood parameters. In the following we give an overview over selected descriptive and regression results.
Examinations
275 individuals participated in 1797 visits with a mean of 6.5 visits per person. At each visit (base program) a blood withdrawal was conducted. Air pollution was measured at a central measurement site in Augsburg throughout the complete study period. In addition (add-on program), for a subgroup of 112 participants personal measurements of ultrafine particles using a portable condensation particle counter (CPC) as well as temperature, humidity and noise were conducted in up to four visits. A diary collected data on behavior and exposure to air pollutant such as from cooking or ETS exposure during the period of personal measurements. Furthermore, endothelial function as a key element of coronary vulnerability and cardiac function characterized by electrocardiogram (ECG) measures were assessed in this subset. Table 1 shows different number counts in the base and add-on program.
Table 1. Number counts of selected examination parts
| Conducted | Valid Blood Draws | |||||||
|---|---|---|---|---|---|---|---|---|
| Base program | ||||||||
| Participants | 163 | 163 | ||||||
| Visits | 1064 | 1051 | ||||||
| Add-on program | Valid ECG recordings | Valid EF measurements | Valid BP measurements | Valid CPC measurements | ||||
| for 5 minute analysis | for 1 hour analysis | |||||||
| Participants | 112 | 111 | 110 | 110 | 100 | 102 | 110 | |
| Visits | 733 | 716 | 364 | 363 | 354 | 372 | 340 | |
| In total | ||||||||
| Participants | 275 | 274 | ||||||
| Visits | 1797 | 1767 | ||||||
| ECG, electrocardiogram; EF, endothelial function; BP, blood pressure; CPC, condensation particle counter | ||||||||
Associations between air pollution and blood markers of inflammation and coagulation
As defined in specific aims #1 and #2 we investigated the association between blood markers of inflammation and coagulation in patients with IGT or type 2 diabetes and patients with a genetic susceptibility on the detoxifying pathway. Specifically, we looked at high sensitivity C-reactive protein (CRP), Interleukin 6 (IL-6), soluble CD40Ligand (sCD40L), plasminogen activator inhibitor 1 (PAI-1), fibrinogen, and myeloperoxidase (MPO).
Data on particles with an aerodynamic diameter smaller than 10 or 2.5 µm (PM10 and PM2.5, respectively), and particle number concentration (PNC) were collected at an urban background monitoring site south of the city centre. We calculated individual 24 hour lags from lag 0 up to lag 4 as well as the 5-day average exposure. To estimate the associations between air pollutants and blood markers, additive mixed models with random patient effect were used. A confounder model was built for each blood marker separately, adjusting for long term time trend, meteorology (temperature, relative humidity), and weekday. Penalized splines were used to allow for non-linear confounder adjustment.
The first analyses were conducted taking patients with diabetes and patients with IGT together in one group based on the recommendations by the scientific advisory board. In secondary analyses, we also analyzed the three panels separately.
Panel description
On average, the panel of the genetically susceptible was younger and slimmer compared to the panel of T2DM or IGT. They also reported less accompanying cardiovascular diseases and took less medication. Regarding the blood marker levels, the largest difference was seen in CRP with lower levels in the panel of genetically susceptible individuals, while the other blood markers did not differ significantly (Table 2).
Table 2. Description of the patients included in teh analysis of blood markers
| T2DM or IGT | Gen. Susc. | |||||||
|---|---|---|---|---|---|---|---|---|
| Mean | SD | Mean | SD | |||||
| Age years | 66.4 | 8.5 | 55.4 | 13.1 | ||||
| BMI kg/m2 | 30.5 | 5.4 | 26.5 | 5.6 | ||||
| N | % | N | % | |||||
| Gender | Male | 108 | 58 | 49 | 49 | |||
| Smoking | never smoker | 89 | 11 | 43 | 49 | |||
| ex smoker | 94 | 88 | 39 | 45 | ||||
| occassional smoker | 4 | 2 | 5 | 6 | ||||
| History of | Coronary heart disease | 18 | 10 | 7 | 8 | |||
| Myocardial infarction | 20 | 11 | 3 | 3 | ||||
| Hypertension | 135 | 72 | 34 | 39 | ||||
| Medication use | Anlidiabetics | 50 | 27 | 2 | 2 | |||
| Statins | 54 | 29 | 13 | 15 | ||||
| Antiinflammatory agents | 49 | 26 | 11 | 13 | ||||
| Blood markers | N | Mean | SD | N | Mean | SD | ||
| CRP mg/l | 1196 | 2.5 | 5.6 | 569 | 1.4 | 2.3 | ||
| sCDL40L pg/ml | 1197 | 783 | 508 | 568 | 1001 | 773 | ||
| Fibrinogen g/l | 1196 | 3.7 | 0.7 | 569 | 3.3 | 0.5 | ||
| MPO ng/ml | 1197 | 16.2 | 7.2 | 569 | 14.5 | 12.3 | ||
| PAI-1 ng/ml | 1197 | 4.7 | 3.7 | 569 | 3.6 | 3.1 | ||
Regression Results
Table 3 sums up the results for the two panels for all blood markers. The results show clear differences between the two panels, with stronger associations for the panel of genetically susceptibles. Except for sCD40L, associations also point in different directions for both panels.
Table 3: overview on results of associations between blood markers and air pollutants in the panels.
|
| Genetically susceptible individuals | Patients with IGT or diabetes | ||
| Blood marker | Association | Time scale | Association | Time scale |
| IL-6 | | delayed | | delayed |
| CRP |
| Immediate + delayed | -- | n.a. |
| MPO | | Immediate + delayed | | immediate |
| sCD40L | | immediate | | immediate |
| Fibrinogen | -- | n.a. | | delayed |
| PAI-1 | | immediate | -- | n.a. |
|
|
| |||


The clearest association was found for CRP and MPO in the panel of genetically susceptible individuals. For CRP, positive associations were seen for almost all lags, except for lag 4, and the five- day-average. The pattern was similar, however not as strong, for MPO (Figure 1).
Figure 1. Associations between PM2.5 (squares) and ultrafine particles
(circles) and CRP (blue/green) and MPO (pink/Purple), respectively.
CRP - C-reactive proteins.
MPO - myeloperoxidase
The coagulation markers sCD40L and PAI-1 showed an immediate decrease in association with particles, especially for PM2.5. No association as see for later lags (Figure 2).
Figure 2. Associations between PMN2.5 (squares) and ultrafine particles (circles), and
sCD40L (blue/green) and PAI-1 (pink/purple), respectively.
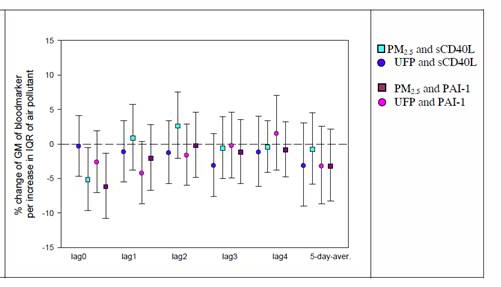
sCD40L - soluble CD-40 Ligand.
PAI-1 - plasmino activator inhibitor 1
Results for the panel of patients with diabetes or IGT were smaller and mostly non-significant. Separate analyses for the panel with IGT and the panel with diabetic individuals revealed that the associations were mostly driven by the panel with IGT as shown for Fibrinogen in Figure 3.
Figure 3. Associations between PM2.5 and fibrinogen for the panel of IGT and
diabetic individuals together (light blue) and separately (IGT light green, diabetics
dark green), respectively
Associations between air pollution and ECG measure
Effects of personally measured PNC and ambient air pollution on heart rate (HR) and heart rate variability (HRV) parameters in diseased individuals (with T2DM and IGT)
In previous analyses we observed effects of 5-minute averages of personally measured PNC on 5- minute intervals of heart rate (HR) as well as standard deviation of normal-to-normal intervals (SDNN) in 32 participants with T2DM and 32 participants with IGT. In particular, we detected a concurrent - 0.56% (-1.02;-0.09%) decrease in SDNN in association with an increase of 16,000 personal PNC particles/cm³. Furthermore, an IQR (12.3µg/m³) increase in 1h-averages of ambient PM2.5 led to a - 3.38% decrease in 1h-intervals of SDNN. We conducted several sensitivity analyses in order to test the robustness of these findings.
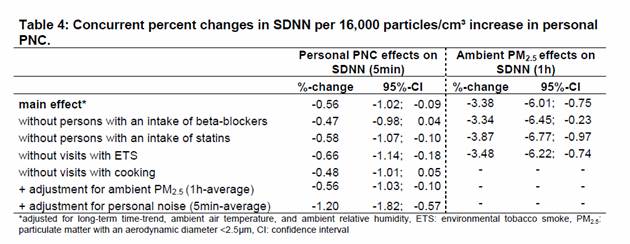
Effects of personal PNC on SDNN did not change when excluding participants taking statins or additionally adjusting for ambient 1h-averages of PM2.5. We observed slightly weaker PNC effects when excluding participants with an intake of beta-blockers or visits with cooking. However, PNC effects were stronger in participants who were not exposed to environmental tobacco smoke or when adjusting for personally measured 5min-averages of noise exposure. The sensitivity analyses also showed only slight changes in PM2.5 effects on SDNN (Table 4).
Table 4: Concurrent percent changes in SDNN per 16,000 particles/cm³ increase in personal PNC.
| Personal PNC effects on SDNN (5min) | Ambient PM2.5 effects on SDNN (1h) | |||||
| %-change | 95%-CI | %-change | 95%-CI | |||
| main effect* | -0.56 | -1.02; | -0.09 | -3.38 | -6.01; | -0.75 |
| without persons with an intake of beta-blockers | -0.47 | -0.98; | 0.04 | -3.34 | -6.45; | -0.23 |
| without persons with an intake of statins | -0.58 | -1.07; | -0.10 | -3.87 | -6.77; | -0.97 |
| without visits with ETS | -0.66 | -1.14; | -0.18 | -3.48 | -6.22; | -0.74 |
| without visits with cooking | -0.48 | -1.01; | 0.05 | - | - | - |
| + adjustment for ambient PM2.5 (1h-average) | -0.56 | -1.03; | -0.10 | - | - | - |
| + adjustment for personal noise (5min-average) | -1.20 | -1.82; | -0.57 | - | - | - |
| *adjusted for long-term time-trend, ambient air temperature, and ambient relative humidity, ETS: environmental tobacco smoke, PM2.5: particulate matter with an aerodynamic diameter <2.5µm, CI: confidence interval | ||||||
Immediate Ozone Effects on Heart Rate and Repolarization Parameters
We investigated the associations between 1h-averages of ozone and heart rate (HR), Bazett-corrected QT-interval (QTc), T-wave amplitude (Tamp) and T-wave complexity (Tcomp) in 64 individuals with T2D or IGT and in 46 healthy individuals with a potential genetic predisposition. Additive mixed models with random participant effects and a first-order autoregressive covariance structure accounting for autocorrelation between the repeated measurements were applied. Models were adjusted for ambient meteorology and time trends. Penalized splines were used to allow for non-linear confounder adjustment. Data were analyzed with SAS statistical package (version 9.2; SAS Institute Inc., Cary, NC, USA).
Panel description
Table 5 describes the baseline characteristics and the ECG parameters of the participants.
Table 5. Description of the study population and the ECG parameters.
| All (N=110) | TD2 or IGT (N=64 | Healthy (N=46) | p-value | |||||||
|---|---|---|---|---|---|---|---|---|---|---|
| Mean | (SD) | Mean | SD | Mean | (SD) | |||||
| AGE (YEARS | 61.6 | (11.7 | 66.1 | (8.1) | 55.4 | (13.1) | <0.001a | |||
| BMI (kg/m3) | 28.6 | (5.3) | 30.1 | (4.7) | 26.5 | (5.6) | <0.001a | |||
| N | (%) | N | (%) | N | (%) | |||||
| Gender | ||||||||||
| Male | 69 | (63) | 42 | (66) | 27 | (59) | 0.46b | |||
| Female | 41 | (37) | 22 | (34) | 19 | (41) | ||||
| Smoking | ||||||||||
| Never Smoker | 50 | (45) | 26 | (41) | 24 | (52) | 0.06c | |||
| Ex Smoker | 55 | (50) | 37 | (58) | 18 | (39) | ||||
| Occasional Smoker | 5 | (5) | 1 | (2) | 4 | (9) | ||||
| HbA1c | ||||||||||
| <6.5% | 95 | (86) | 49 | (77) | 46 | (100) | <0.001c | |||
| ≥6.5% | 15 | (14 | 15 | (23) | 0 | (0) | ||||
| History of | ||||||||||
| Coronary heart disease | 7 | (6) | 4 | (6) | 3 | (7) | 1.00c | |||
| Angina pectoris | 5 | (8) | 5 | (2) | 1 | (5) | 0.40c | |||
| Myocardial infarction | 6 | (5) | 6 | (9) | 0 | (0) | <0.001c | |||
| Hypertension | 49 | (45) | 23 | (36) | 26 | (57) | 0.03b | |||
| Medication use | ||||||||||
| Antibiotics | 18 | (28) | 18 | (16) | 0 | (0) | <0.001c | |||
| Beta-adrenergic receptor blockers | 28 | (25) | 19 | (30) | 9 | (20) | 0.23b | |||
| Statins | 19 | (17) | 13 | (20) | 6 | (13) | 0.32b | |||
| N | Mean | (SD) | N | Mean | (SD) | N | Mean | (SD) | ||
| ECG parameters | ||||||||||
| Heart rate (beats/min) | 2081 | 78.4 | (13.0) | 1202 | 79.0 | (14.3) | 879 | 77.6 | (10.9) | 0.56d |
| T-wave amplitude (µV) | 2060 | 330 | (134) | 1185 | 305 | (127) | 875 | 364 | (135) | 0.02d |
| T-wave complexity (%) | 2083 | 18.0 | (8.5) | 1203 | 14.5 | (7.5) | 880 | 18.7 | (9.7) | 0.43d |
| QTc-interval (ms) | 2083 | 440.5 | (24.3) | 1203 | 443.5 | (24.3) | 880 | 436.3 | (23.8) | 0.08d |
| T2D: type 2 diabetes. IGT: impaired glucose tolerance, SD: standard deviation, BMI: body mass index, HbA1c: Glycosylated haemoglobin A1c, ECG: electrocardiogram, QTc-interval: Basett-corrected QT-interval. aStudents t-test, bx2-test, cFishers's exact test, dp-value of fixed group effect in mixed effects model | ||||||||||
Participants with T2D or IGT were older, more often overweight, less hypertensive, and comprised more individuals with a previous MI in comparison to healthy participants with a potential genetic predisposition. As expected, elevated levels of glycosylated hemoglobin A1c and use of antidiabetic medication was only observed in participants with T2D and IGT. With regard to the ECG parameters, we only detected a significant difference between the two groups for Tamp with higher values in healthy participants. According to the median of participant-specific Spearman correlation coefficients HR showed a moderate correlation with Tcomp and QTc (r=0.6). Tcomp was negatively correlated with Tamp (r=-0.6). All other ECG parameters were uncorrelated (r<|0.5|). For all further statistical analyses Tcomp was log-transformed in order to produce normally distributed residuals.
During the study period the 1h-average concentration of ozone (± standard deviation) was 45.9µg/m³ (±33.3µg/m³). During the whole study period 1h-averages of ozone never exceeded the German information (180µg/m³) and alert threshold (240µg/m³).
Regression Results
Figure 4 shows the percent changes of the mean ECG parameters per 20 µg/m³ increase in ozone together with 95%-confidence intervals (CI). Elevated ozone levels led to a marginal concurrent 0.54% [95%-CI: -0.07;1.16%] increase in HR and to 1h4h delayed increases about 0.6-0.7% in all participants showing the strongest association with a 2h lag (0.78% [0.18;1.37%]). Ozone effects were more pronounced in individuals with T2D or IGT for all lags showing percent changes in HR about 1%. HR did not change due to ozone exposure in individuals with a potential genetic predisposition. We observed concurrent and 1h lagged T-wave flattening of -1.31% [-2.19;- 0.42%] and -1.32% [-2.19;-0.45%] associated with elevated ozone levels, respectively. This association was predominantly detected in participants with T2D or IGT (concurrent and 1h lagged ozone effects: -1.99% [-3.20;-0.78%] and -2.14% [-3.32;-0.96%]), whereas healthy subjects showed a weaker reduction in Tamp. Furthermore, Tcomp increased in association with elevated ozone levels among all participants by 2.12% [0.81;3.52] and 1.89% [0.55;3.26%] with a lag of 1h and 2h, respectively. Again, only participants with metabolic disorders reacted to ozone exposure. No ozone effects were seen for QTc in either subgroup.
Figure 4. Concurrent and delayed effects of 1h-averages of ozone on 1h-averages of heart rate (HR), T-wave amplitude (Tamp), and T-wave complexity (Tcomp) in all participants, in individuals with type 2 diabetes (T2D) or impaired glucose tolerance (IGT) and in healthy individuals with a potential genetic predisposition.
Progress Summary:
The period covered by the report included:
(1) The completion of all parts of data management.
(2) The performing of statistical analyses with emphasis on effects on ECG and blood parameters. (3) The preparation of manuscripts with emphasis on effects on ECG and blood parameters.
In the following we give an overview over selected descriptive and regression results.
Examinations
275 individuals participated in 1797 visits with a mean of 6.5 visits per person. At each visit (base program) a blood withdrawal was conducted. Air pollution was measured at a central measurement site in Augsburg throughout the complete study period. In addition (add-on program), for a subgroup of
112 participants personal measurements of ultrafine particles using a portable condensation particle counter (CPC) as well as temperature, humidity and noise were conducted in up to four visits. A diary collected data on behavior and exposure to air pollutant such as from cooking or ETS exposure during the period of personal measurements. Furthermore, endothelial function as a key element of coronary vulnerability and cardiac function characterized by electrocardiogram (ECG) measures were assessed in this subset. Table 1 shows different number counts in the base and add-on program.
Table 1. Number counts of selected examination parts
| All (N=110) | TD2 or IGT (N=64 | Healthy (N=46) | p-value | |||||||
|---|---|---|---|---|---|---|---|---|---|---|
| Mean | (SD) | Mean | SD | Mean | (SD) | |||||
| AGE (YEARS | 61.6 | (11.7 | 66.1 | (8.1) | 55.4 | (13.1) | <0.001a | |||
| BMI (kg/m3) | 28.6 | (5.3) | 30.1 | (4.7) | 26.5 | (5.6) | <0.001a | |||
| N | (%) | N | (%) | N | (%) | |||||
| Gender | ||||||||||
| Male | 69 | (63) | 42 | (66) | 27 | (59) | 0.46b | |||
| Female | 41 | (37) | 22 | (34) | 19 | (41) | ||||
| Smoking | ||||||||||
| Never Smoker | 50 | (45) | 26 | (41) | 24 | (52) | 0.06c | |||
| Ex Smoker | 55 | (50) | 37 | (58) | 18 | (39) | ||||
| Occasional Smoker | 5 | (5) | 1 | (2) | 4 | (9) | ||||
| HbA1c | ||||||||||
| <6.5% | 95 | (86) | 49 | (77) | 46 | (100) | <0.001c | |||
| ≥6.5% | 15 | (14 | 15 | (23) | 0 | (0) | ||||
| History of | ||||||||||
| Coronary heart disease | 7 | (6) | 4 | (6) | 3 | (7) | 1.00c | |||
| Angina pectoris | 5 | (8) | 5 | (2) | 1 | (5) | 0.40c | |||
| Myocardial infarction | 6 | (5) | 6 | (9) | 0 | (0) | <0.001c | |||
| Hypertension | 49 | (45) | 23 | (36) | 26 | (57) | 0.03b | |||
| Medication use | ||||||||||
| Antibiotics | 18 | (28) | 18 | (16) | 0 | (0) | <0.001c | |||
| Beta-adrenergic receptor blockers | 28 | (25) | 19 | (30) | 9 | (20) | 0.23b | |||
| Statins | 19 | (17) | 13 | (20) | 6 | (13) | 0.32b | |||
| N | Mean | (SD) | N | Mean | (SD) | N | Mean | (SD) | ||
| ECG parameters | ||||||||||
| Heart rate (beats/min) | 2081 | 78.4 | (13.0) | 1202 | 79.0 | (14.3) | 879 | 77.6 | (10.9) | 0.56d |
| T-wave amplitude (µV) | 2060 | 330 | (134) | 1185 | 305 | (127) | 875 | 364 | (135) | 0.02d |
| T-wave complexity (%) | 2083 | 18.0 | (8.5) | 1203 | 14.5 | (7.5) | 880 | 18.7 | (9.7) | 0.43d |
| QTc-interval (ms) | 2083 | 440.5 | (24.3) | 1203 | 443.5 | (24.3) | 880 | 436.3 | (23.8) | 0.08d |
| T2D: type 2 diabetes. IGT: impaired glucose tolerance, SD: standard deviation, BMI: body mass index, HbA1c: Glycosylated haemoglobin A1c, ECG: electrocardiogram, QTc-interval: Basett-corrected QT-interval. aStudents t-test, bx2-test, cFishers's exact test, dp-value of fixed group effect in mixed effects model | ||||||||||
Journal Articles on this Report : 18 Displayed | Download in RIS Format
| Other subproject views: | All 19 publications | 18 publications in selected types | All 18 journal articles |
|---|---|---|---|
| Other center views: | All 191 publications | 157 publications in selected types | All 144 journal articles |
| Type | Citation | ||
|---|---|---|---|
|
|
Breitner S, Stolzel M, Cyrys J, Pitz M, Wolke G, Kreyling W, Kuchenhoff H, Heinrich J, Wichmann H-E, Peters A. Short-term mortality rates during a decade of improved air quality in Erfurt, Germany. Environmental Health Perspectives 2009;117(3):448-454. |
R832415 (2010) R832415 (Final) R832415C002 (2010) R832415C002 (2011) |
|
|
|
Bruske I, Hampel R, Socher MM, Ruckerl R, Schneider A, Heinrich J, Oberdorster G, Wichmann H-E, Peters A. Impact of ambient air pollution on the differential white blood cell count in patients with chronic pulmonary disease. Inhalation Toxicology 2010;22(3):245-252. |
R832415 (2010) R832415 (2011) R832415 (Final) R832415C002 (2010) R832415C002 (2011) R832415C004 (2010) R832415C004 (2011) R827354 (Final) |
Exit |
|
|
Cyrys J, Heinrich J, Peters A, Kreyling WG, Wichmann H-E. Emissionen, immission und messungen feiner und ultrafeiner partikel (Immission, emissions, and measurements of fine and ultrafine particles). Umweltmedizin in Forschung und Praxis 2002;7(2):67-77. |
R832415 (2010) R832415 (Final) R832415C002 (2011) |
Exit |
|
|
Hampel R, Breitner S, Ruckerl R, Frampton MW, Koenig W, Phipps RP, Wichmann HE, Peters A, Schneider A. Air temperature and inflammatory and coagulation responses in men with coronary or pulmonary disease during the winter season. Occupational & Environmental Medicine 2010;67(6):408-416. |
R832415 (2010) R832415 (2011) R832415 (Final) R832415C002 (2011) R832415C003 (2011) |
Exit |
|
|
Hildebrandt K, Ruckerl R, Koenig W, Schneider A, Pitz M, Heinrich J, Marder V, Frampton M, Oberdorster G, Wichmann HE, Peters A. Short-term effects of air pollution: a panel study of blood markers in patients with chronic pulmonary disease. Particle and Fibre Toxicology 2009;6:25. |
R832415 (2009) R832415 (2010) R832415 (2011) R832415 (Final) R832415C002 (2009) R832415C002 (2010) R832415C002 (2011) R832415C003 (2010) R832415C003 (2011) R832415C004 (2010) R832415C004 (2011) |
Exit Exit Exit |
|
|
Kraus U, Breitner S, Schnelle-Kreis J, Cyrys J, Lanki T, Ruckerl R, Schneider A, Bruske I, Gu J, Devlin R, Wichmann H-E, Zimmermann R, Peters A. Particle-associated organic compounds and symptoms in myocardial infarction survivors. Inhalation Toxicology 2011;23(7):431-447. |
R832415 (Final) R832415C002 (2011) |
Exit |
|
|
Ljungman P, Bellander T, Nyberg F, Lampa E, Jacquemin B, Kolz M, Lanki T, Mitropoulos J, Muller M, Picciotto S, Pistelli R, Ruckerl R, Koenig W, Peters A, AIRGENE Study Group. DNA variants, plasma levels and variability of Interleukin-6 in myocardial infarction survivors: results from the AIRGENE study. Thrombosis Research 2009;124(1):57-64. |
R832415 (2010) R832415 (Final) R832415C002 (2010) R832415C002 (2011) |
Exit |
|
|
Peters A, Greven S, Heid IM, Baldari F, Breitner S, Bellander T, Chrysohoou C, Illig T, Jacquemin B, Koenig W, Lanki T, Nyberg F, Pekkanen J, Pistelli R, Ruckerl R, Stefanadis C, Schneider A, Sunyer J, Wichmann HE, AIRGENE Study Group. Fibrinogen genes modify the fibrinogen response to ambient particulate matter. American Journal of Respiratory and Critical Care Medicine 2009;179(6):484-491. |
R832415 (2009) R832415 (2010) R832415 (Final) R832415C002 (2009) R832415C002 (2010) R832415C002 (2011) |
Exit Exit Exit |
|
|
Peters A. Air quality and cardiovascular health:smoke and pollution matter. Circulation 2009;120(11):924-927. |
R832415 (2010) R832415 (Final) R832415C002 (2010) R832415C002 (2011) |
Exit Exit Exit |
|
|
Pitz M, Birmili W, Schmid O, Peters A, Wichmann HE, Cyrys J. Quality control and quality assurance for particle size distribution measurements at an urban monitoring station in Augsburg, Germany. Journal of Environmental Monitoring 2008;10(9):1017-1024. |
R832415 (2007) R832415 (2008) R832415 (2010) R832415 (Final) R832415C002 (2006) R832415C002 (2008) R832415C002 (2010) R832415C002 (2011) |
Exit |
|
|
Ruckerl R, Phipps RP, Schneider A, Frampton M, Cyrys J, Oberdorster G, Wichmann HE, Peters A. Ultrafine particles and platelet activation in patients with coronary heart disease – results from a prospective panel study. Particle and Fibre Toxicology 2007;4:1. |
R832415 (2010) R832415 (2011) R832415 (Final) R832415C002 (2011) R832415C003 (2011) R832415C004 (2011) R827354 (Final) |
Exit Exit Exit |
|
|
Schneider A, Neas L, Herbst MC, Case M, Williams RW, Cascio W, Hinderliter A, Holguin F, Buse JB, Dungan K, Styner M, Peters A, Devlin RB. Endothelial dysfunction: associations with exposure to ambient fine particles in diabetic individuals. Environmental Health Perspectives 2008;116(12):1666-1674. |
R832415 (2008) R832415 (2010) R832415 (Final) R832415C002 (2010) R832415C002 (2011) |
|
|
|
Schneider A, Neas LM, Graff DW, Herbst MC, Cascio WE, Schmitt MT, Buse JB, Peters A, Devlin RB. Association of cardiac and vascular changes with ambient PM2.5 in diabetic individuals. Particle and Fibre Toxicology 2010;7:14. |
R832415 (2010) R832415 (Final) R832415C002 (2010) R832415C002 (2011) |
Exit Exit Exit |
|
|
Schneider A, Hampel R, Ibald-Mulli A, Zareba W, Schmidt G, Schneider R, Ruckerl R, Couderc JP, Mykins B, Oberdorster G, Wolke G, Pitz M, Wichmann H-E, Peters A. Changes in deceleration capacity of heart rate and heart rate variability induced by ambient air pollution in individuals with coronary artery disease. Particle and Fibre Toxicology 2010;7:29 (12 pp.). |
R832415 (2011) R832415 (Final) R832415C002 (2011) R832415C004 (2011) R827354 (Final) |
Exit Exit Exit |
|
|
Schneider A, Alexis NE, Diaz-Sanchez D, Neas LM, Harder S, Herbst MC, Cascio WE, Buse JB, Peters A, Devlin RB. Ambient PM2.5 exposure up-regulates the expression of costimulatory receptors on circulating monocytes in diabetic individuals. Environmental Health Perspectives 2011;119(6):778-783. |
R832415 (Final) R832415C002 (2011) |
|
|
|
Stolzel M, Breitner S, Cyrys J, Pitz M, Wolke G, Kreyling W, Heinrich J, Wichmann H-E, Peters A. Daily mortality and particulate matter in different size classes in Erfurt, Germany. Journal of Exposure Science & Environmental Epidemiology 2007;17(5):458-467. |
R832415 (2010) R832415 (Final) R832415C002 (2011) R827354 (Final) R827354C002 (Final) |
Exit Exit Exit |
|
|
Yue W, Stolzel M, Cyrys J, Pitz M, Heinrich J, Kreyling WG, Wichmann H-E, Peters A, Wang S, Hopke PK. Source apportionment of ambient fine particle size distribution using positive matrix factorization in Erfurt, Germany. Science of the Total Environment 2008;398(1-3):133-144. |
R832415 (2007) R832415 (2008) R832415 (2010) R832415 (2011) R832415 (Final) R832415C001 (2008) R832415C001 (2010) R832415C001 (2011) R832415C002 (2006) R832415C002 (2008) R832415C002 (2010) R832415C002 (2011) R827354 (Final) R834797 (2016) |
Exit Exit Exit |
|
|
Zareba W, Couderc JP, Oberdorster G, Chalupa D, Cox C, Huang L-S, Peters A, Utell MJ, Frampton MW. ECG parameters and exposure to carbon ultrafine particles in young healthy subjects. Inhalation Toxicology 2009;21(3):223-233. |
R832415 (2008) R832415 (2009) R832415 (2010) R832415 (2011) R832415 (Final) R832415C002 (2010) R832415C002 (2011) R832415C003 (2010) R832415C003 (2011) R832415C004 (2009) R832415C004 (2010) R832415C004 (2011) R827354 (Final) |
Exit |
Supplemental Keywords:
Health, RFA, Scientific Discipline, Air, PHYSICAL ASPECTS, Health Risk Assessment, Physical Processes, Risk Assessments, particulate matter, Epidemiology, human exposure, long term exposure, aersol particles, atmospheric particles, ambient particle health effects, exposure, atmospheric aerosol particles, PM, atmospheric particulate matter, acute cardiovascular effects, cardiovascular disease, human health riskProgress and Final Reports:
Original AbstractMain Center Abstract and Reports:
R832415 Rochester PM Center Subprojects under this Center: (EPA does not fund or establish subprojects; EPA awards and manages the overall grant for this center).
R832415C001 Characterization and Source Apportionment
R832415C002 Epidemiological Studies on Extra Pulmonary Effects of Fresh and Aged Urban Aerosols from Different Sources
R832415C003 Human Clinical Studies of Concentrated Ambient Ultrafine and Fine Particles
R832415C004 Animal models: Cardiovascular Disease, CNS Injury and Ultrafine Particle Biokinetics
R832415C005 Ultrafine Particle Cell Interactions In Vitro: Molecular Mechanisms Leading To Altered Gene Expression in Relation to Particle Composition
The perspectives, information and conclusions conveyed in research project abstracts, progress reports, final reports, journal abstracts and journal publications convey the viewpoints of the principal investigator and may not represent the views and policies of ORD and EPA. Conclusions drawn by the principal investigators have not been reviewed by the Agency.