
Grantee Research Project Results
Final Report: Epidemiological Studies on Extra Pulmonary Effects of Fresh and Aged Urban Aerosols from Different Sources
EPA Grant Number: R832415C002Subproject: this is subproject number 002 , established and managed by the Center Director under grant R832415
(EPA does not fund or establish subprojects; EPA awards and manages the overall grant for this center).
Center: Rochester PM Center
Center Director: Oberdörster, Günter
Title: Epidemiological Studies on Extra Pulmonary Effects of Fresh and Aged Urban Aerosols from Different Sources
Investigators: Peters, Annette , Utell, Mark J. , Zareba, Wojciech , Phipps, Richard , Wichmann, Heinz-Erich , Henneberger, Alexandra , Breitner, Susanne , Stoelzel, M , Rückerl, Regina
Institution: GSF-National Research Center for Environment and Health , University of Rochester
EPA Project Officer: Chung, Serena
Project Period: October 1, 2005 through September 30, 2010 (Extended to September 30, 2012)
RFA: Particulate Matter Research Centers (2004) RFA Text | Recipients Lists
Research Category: Human Health , Air
Objective:
The objective of the epidemiological study was to examine the effect of fine and ultrafine particles on systemic responses, endothelial and cardiac function.
- Aim #1: Determine the effect of ambient fine and ultrafine particles on an acute phase reaction in the blood of subjects with type 2 diabetes mellitus (T2D), impaired glucose tolerance (IGT) and potential genetic susceptibility (gen. susc.).
- Aim #2: Determine the effect of ambient fine and ultrafine particles on pro-thrombotic states of the blood in the above subject panels.
- Aim #3: Determine the effect of ambient fine and ultrafine particles on endothelial dysfunction as a key element of coronary vulnerability in a subset of the above subject panels.
- Aim #4: Determine the effect of ultrafine particles on cardiac function as characterized by ECG measures of autonomic function and repolarization in a subset of the above subject panels.
Summary/Accomplishments (Outputs/Outcomes):
Table 1. Number counts of valid examination parts
| Blood withdrawl | ECG recordings | Endothelia I Function | Blood pressure | Person CPC | Personal temperature | Person humidity | Personal noise | |
|---|---|---|---|---|---|---|---|---|
| Participants | 274 | 110 | 100 | 110 | 110 | 112 | 111 | 111 |
| Visits | 1,766 | 364 | 354 | 340 | 337 | 380 | 367 | 343 |
| For abbreviations see Appenix A3. | ||||||||
| TD20 N=83) | IGT (N=104) | Gen. susc. (N=88) | po-va | ||||
|---|---|---|---|---|---|---|---|
| Mean | (SD) | Mean | (SD) | Mean | (SD) | ||
| Age (years) | 67.5 | (7.3) | 65.6 | (9.2) | 55.9 | (12.1) | <.0001b |
| BMI (kg/m2)a | 31.6 | (5.0) | 29.6 | (5.6 | 26.9 | (5.0) | <.0001b |
| N | (%) | N | (%) | N | (% | ||
| Men | 49 | (59.0) | 59 | (56.7) | 49 | (55.7) | 0.90c |
| Smoking | |||||||
| Never Smoker | 32 | (38.6) | 57 | (54.8) | 44 | (50.0) | |
| Ex-Smoker | 48 | (57.8) | 46 | (44.2) | 39 | (44.3) | 0.08d |
| Occassional Smoker | 3. | (3.6) | 1 | (1.0) | 5 | (5.7) | |
| History of | |||||||
| Coronary Heart Disease | 7 | (8.0) | 0.65C | ||||
| Myocardial infarction | 9 | (10.8) | 11 | (10.6) | 3 | (3.4) | 0.042c |
| Hypertension | 68 | (81.9) | 67 | (64.4) | 35 | (39.8) | <.0001c |
| Angina Pectorisa | 6 | (7.3) | 9 | (8.7) | 3 | (3.4) | 0.31d |
| Medication Use | |||||||
| Agents acting on rennin angiotensin-system | 54 | (61.5) | 54 | (39.4) | 21 | (23.9) | <.0001c |
| Antidiabetics | 47 | (56.6) | 3 | (2.9) | 2 | (2.3) | <.0001d |
| Antihypertensives | 66 | (79.5) | 61 | (58.7) | 31 | (35.2) | <.0001c |
| Antiinflammatory agents | 22 | (26.5) | 27 | (26..0) | 12 | (13.6) | 0.06c |
| Beta Blockers | 39 | (47.0) | 30 | (28.9) | 15 | (17.1) | 0.0001c |
| Calcium channel blockers | 14 | (16.9) | 19 | (18.3) | 7 | (8.0) | 0.10c |
| Diuretics | 42 | (50.6) | 35 | (33.7) | 14 | (15.96) | <.0001c |
| Nitrates | 4 | (4.8) | 2 | (1.9) | 0 | (0) | 0.10d |
| Statins | 31 | (35.4) | 23 | (22.1) | 13 | (14.8 | 0.002c |
| No medication use at all | 2 | (2.4) | 7 | (6.7) | 18 | (20.5) | <.0001d |
| Being employed | 14 | (16.9) | 30 | (28.9 | 52 | (59.1) | <.0001c |
| a For one participants the value is missing; p-value for hertogeneity between panels determind by b ANOVA, c Chi-square test, d Fisher's exact test. For appreviations see Appendix A3 | |||||||
Table 3 shows, for each panel separately, a description of the outcome variables which have been used for the different study aims. Mean levels of all blood markers differed significantly between the panels. For the other outcome variables there was only a significant difference between the panels for pulse pressure and the standard deviation of all normal-to-normal intervals (SDNN). A description of ambient and individual air pollutants and meteorological variables measured during the study period is shown in Table 4 and Table 5.
| T2D | IGT | Gen. Susc. | |||||||||
|---|---|---|---|---|---|---|---|---|---|---|---|
| N | Mean | (SD) | N | Mean | (SD) | N | Mean | (SD) | p-valueb | ||
| Blood markers | |||||||||||
| IL-6 (pg/ml) | 522 | 2.1 | (5.5) | 675 | 1.3 | (0.9) | 569 | 1.0 | -1.0 | <0.0001 | |
| CRP (ng/ml) | 522 | 2.9 | (7.4) | 675 | 2.2 | (3.8) | 569 | 1.4 | (2.3) | <0.0001 | |
| MPO (ng/ml) | 522 | 16.2 | (7.8) | 675 | 16.2 | (6.8) | 569 | 14.5 | (12.3) | 0.002 | |
| CD40L (ph/ml) | 522 | 764.4 | (532.4) | 675 | 797.1 | (488) | 569 | 1,000.8 | (773.1) | <0.0001 | |
| Fibrinogen (g/l) | 521 | 3.7 | (0.8) | 675 | 3.7 | (0.6) | 569 | 3.3 | (0.5) | <0.0001 | |
| PAI-1 (ng/ml) | 522 | 4.6 | (3.7) | 675 | 4.7 | (3.7) | 569 | 3.6 | (3.1) | <0.0001 | |
| Blood pressure | |||||||||||
| SBP (mmHg) | 110 | 133.1 | (16.8) | 109 | 134.0 | (19.7) | 152 | 126.6 | (17.9) | 0.12 | |
| DBP (mmHg) | 110 | 79.1 | (8.5) | 109 | 81.0 | (11.9) | 152 | 79.3 | (10.2) | 0.61 | |
| pp (mmHg) | 110 | 54.0 | (13.1) | 109 | 53.0 | (12.6) | 152 | 47.3 | (11.9) | 0.02 | |
| 1h-ECG intervalsa | |||||||||||
| HR (beats/min) | 597 | 77.3 | (14.4) | 606 | 80.8 | (14.1) | 880 | 77.7 | (11) | 0.28 | |
| T-wave amplitude (µv) | 585 | 290.1 | (108.7) | 600 | 319.3 | (141.9) | 875 | 364.0 | (134.5) | Infinate Likelihood | |
| T-wave complexity (%) | 597 | 17.0 | (8.4) | 606 | 17.9 | (6.4) | 880 | 18.7 | (9.7) | 0.51 | |
| QTc (ms) | 597 | 440.0 | (26.1) | 606 | 447.0 | (21.8) | 880 | 436.3 | (23.8) | 0.08 | |
| SDNN (ms) | 597 | 77.5 | (26) | 606 | 76.0 | (28.2) | 879 | 85.0 | (30) | 0.04 | |
| RMSSD (ms) | 597 | 32.6 | (32.2) | 606 | 35.2 | (31.2) | 880 | 27.4 | (16.1) | 0.32 | |
| SDNN (ms) | 597 | 77.5 | (26) | 606 | 76.0 | (28.2) | 879 | 85.0 | (30) | 0.04 | |
| LF (ms) | 595 | 6.3 | (7.1) | 606 | 9.2 | (10.7) | 879 | 12.8 | (12.2) | <0.0001 | |
| HF (ms) | 595 | 4.4 | (9.8) | 606 | 5.1 | (8.3) | 879 | 3.6 | (4.3) | 0.57 | |
| LF/HF Ratio | 595 | 3.0 | (2.4) | 606 | 3.4 | (2.4) | 879 | 4.7 | (3.2) | 0.001 | |
| a Descriptive statistics for five-minute intervals were similar. b P-value of fixed groujp effect in mixed effects model. For abbreviations see Appendix A3 | |||||||||||
| average | N | Mean | SD | Min | 25% | Median | 75% | Max | IQR | |
|---|---|---|---|---|---|---|---|---|---|---|
| PM10 (µg/m3) | 1h 24h | 15,466 645 | 19.3 18.3 | 14.1 12.0 | 0.0 2.0 | 8.4 10.1 | 15.3 15.8 | 24.4 24.0 | 159.8 86.5 | 16.0 14.0 |
| PM2.5 (µg/m3) | 1h 24h | 15,461 644 | 13.7 13.7 | 11.2 10.0 | 0.0 1.6 | 5.8 6.7 | 10.9 11.3 | 18.1 17.8 | 106.5 65.8 | 12.3 11.1 |
| UFP (n/cm3) | 1h 24h | 14,699 611 | 9,516 9,537 | 6,902 4,417 | 937 1,879 | 4,892 6,305 | 7,629 8,890 | 12,049 12,027 | 80,858 26,503 | 7,157 5,722 |
| ACP | 1h 24h | 14,699 611 | 2,060 2,068 | 1,535 1,213 | 88 291 | 1,020 1,179 | 1,657 1,855 | 2,615 2,712 | 17,377 8,120 | 1,595 1,533 |
| BC (µg/m3) | 1h 24h | 13,359 550 | 1.8 1.8 | 1.5 1.1 | 0.3 0.4 | 0.9 1.1 | 1.3 1.5 | 2.1 2.2 | 21.4 7.3 | 1.2 1.2 |
| Ozone (µg/m3) | 1h 24h | 15,429 641 | 45.9 45.9 | 33.3 22.7 | 3.0 3.0 | 15.0 27.2 | 44.0 49.5 | 69.0 62.6 | 158.0 97.6 | 54.0 35.4 |
| Air temperature (oC) | 1h 24h | 15,398 636 | 10.8 10.9 | 7.9 7.3 | -8.4 -5.8 | 4.7 5.0 | 10.8 11.0 | 16.5 17.0 | 33.8 27.0 | 11.8 12.0 |
| Relative Humidity (%( | 1h 24h | 15,398 636 | 76.9 77.0 | 18.3 12.6 | 21.0 32.4 | 63.3 68.1 | 81.3 77.6 | 92.8 86.9 | 100.0 100.0 | 29.5 18.8 |
| Barometric pressure (hPa) | 1h 24h | 15.398 636 | 961.2 961.3 | 7.9 7.6 | 927.8 933.9 | 956.8 957.1 | 961.4 961.3 | 965.9 965.9 | 985.6 983.5 | 9.1 |
| For abbreviations see Appendix A3 | ||||||||||
| average | N | Mean | SD | Min | 25% | Median | 75% | Max | IQR | |
|---|---|---|---|---|---|---|---|---|---|---|
| PNC (n/cm3, individual) | 5min visit | 21,918 337 | 21,347 21,175 | 38,086 18,272 | 524 2,947 | 6,162 11,780 | 10,882 17,145 | 21,702 24,965 | 697,779 248,083 | 15,540 13,186 |
| Air temperature (oC; individual) | 5min visit | 28,402 380 | 21,5 21,5 | 3,9 3,0 | -0,3 12,4 | 19,6 19,7 | 21,9 21,6 | 23,.9 23,6 | 36,2 31,1 | 4,3 3,9 |
| Relative humidity (%,individual | 5min visit | 27,350 367 | 44,8 44,9 | 11,2 9,0 | 10,3 21,6 | 36,7 38,7 | 44,4 44,9 | 51,4 50,9 | 11,0 69,8 | 14,7 12,1 |
| Noise (dB(A), individual) | 5min visit | 25,227 343 | 74,7 74,7 | 82,6 79,5 | 37,0 61,1 | 60,8 68,2 | 66,6 70,0 | 71,5 72,8 | 98,9 91,1 | 71,1 71,0 |
| For abbreviations see Appendix A3 | ||||||||||
| T2D or IGT | Gen Susc | |||
|---|---|---|---|---|
| Blood marker | Association | Time scale | Association | Time scale |
| IL-6 | ↑ | delayed | ↓ | delayed |
| hsCRp | -- | n.a. | ↑ | immediate and delayed |
| MPO | ↓ | immediate | ↑ | Immediate and delayed |
| sCD40L | ↓ | immediate | ↓ | immediate |
| PAI-1 | -- | n.a. | ↓ | immediate |
| Fibrinogen | ↑ | delayed | -- | n.a. |
| ↑ significant positive associations | ↑ mainly non-significant positive associations | |||
| ↓ significat negative associations | ↓ mainly on-significan negative data | |||
| For abbreviations see Appendix A3 | ||||
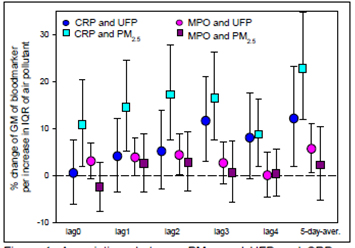
Figure 1 Associations between PM2.5 and UFP and CRP and
MPO, respectively, in gen. susc. persons.
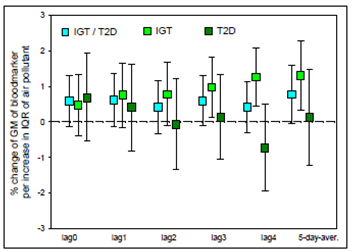
Figure 2. Associations between PM2.5 and fibrinogen in
individuals with IGT and/or T2D.
For abbreviations see Appendix A3
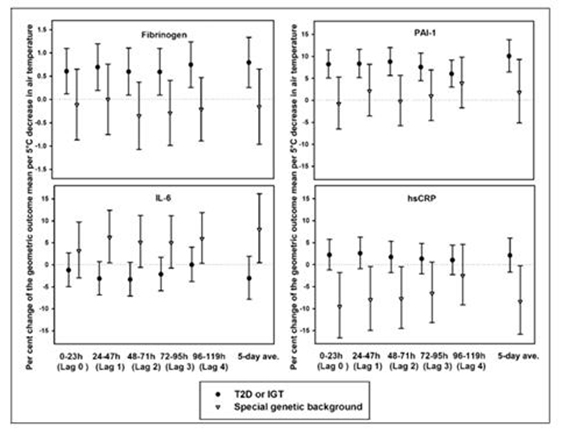
Figure 3. Air temperature effects on blood markers.
For abbreviations see Appendix A3
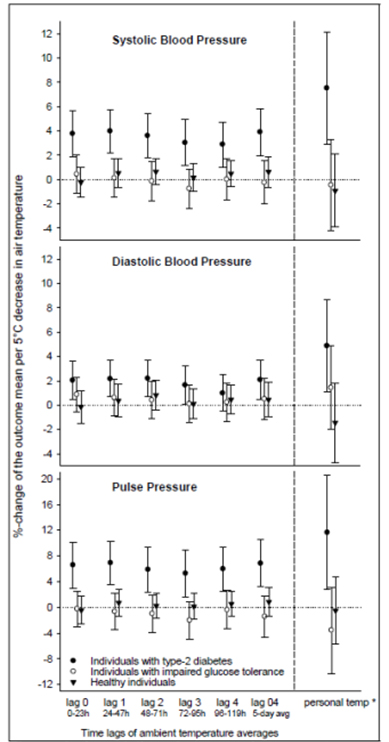
Figure 4. Associations between air temperature and blood pressure
as well as pulse pressure.
For abbreviations see Appendix 3
| %-change | (95%-CI) | |
|---|---|---|
| Main effect* | -0.56 | (-1.02:0.09) |
| without persons with an intake of beta blockers | -0.47 | (-0.98:0.04) |
| without persons with an intake of statins | -0.58 | (-1.07:0.10) |
| without visits with ETS | -0.66 | (-1.14:0.18) |
| without visits with cooking | -0.48 | (-1.03:0.10) |
| + adjustment for ambient PM2.5 (1h-average) | -0.56 | (-1.03:0.10) |
| + adjustment for personal noise (5min-average) | -1.20 | (-1.82:0.57) |
| * adjusted for long-term time-trend, ambient air temperature, and ambient relative humidity. For abbreviations see Appendex A3 | ||
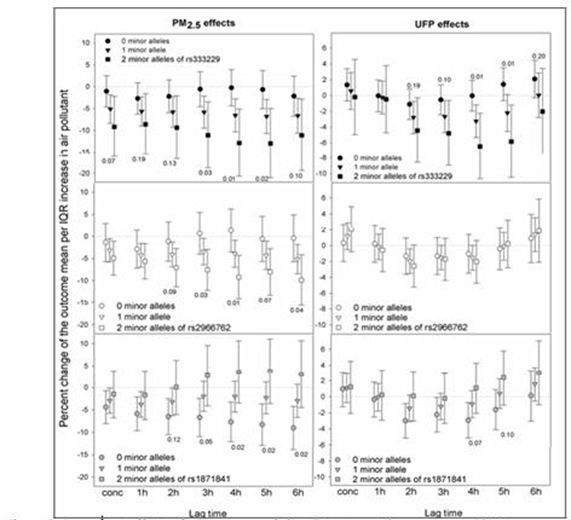
Figure 5. Concurrent effects of 1 h-average of air pollutants on 1 h-averages on SDNN.
For abbreviations see Appendix A3.
Conclusions:
- Our analyses of associations between air pollutants and blood markers confirmed the hypothesis that oxidative stress plays a role in the mechanism linking air pollution and cardiovascular disease.
- Results substantially differed between persons with type 2 diabetes or impaired glucose tolerance and genetically susceptible participants, indicating that there might be different biological mechanisms ongoing.
- Effects were mostly seen for PM2.5 and less for ultrafine particles, and most clearly for inflammatory markers. One can assume that the reason for this is the inflammatory potential of particulate mass, which possibly derives from secondary organic aerosols.
- We observed differing temperature effects on blood markers in persons with metabolic disorder and genetically susceptible individuals which again probably indicates different underlying biological mechanisms with regard to systematic responses.
- We observed associations between decreases in air temperature and increases in blood pressure as well as in pulse pressure mainly in persons with type 2 diabetes, possibly due to vascular abnormalities like endothelial dysfunction which are very common in these individuals.
- Our study showed changes in ECG measures associated with personally measured particle number concentration and centrally monitored air pollutants suggesting that both freshly emitted traffic particles as well as aged aerosol in urban areas are associated with changes in cardiac rhythm.
- Our results suggested that certain polymorphisms in persons with type 2 diabetes or impaired glucose tolerance make them potentially more susceptible to air pollutants with regard to changes in heart rate variability.
- Individual day-time noise exposure was associated with immediate changes in heart rate variability. Thereby, noise at lower levels led to a parasympathetic withdrawal while changes in high noise levels were rather associated with a sympathetic activation in terms of a "fight-or-flight" response.
| Level | Content/Procedure |
|---|---|
| Level 2: Raw | Import of data into SAL; Labels and formats were assigned. Observatins without values were marked as "non applicable" or "missing" |
| Level 2: Checked | Data were checked for plausibility (including the comparison of double entered paper/pencil data) and corrected if necessary |
| Level 3: New variables & exclusions | Preparing dataset by including new variables relevant for analyses and excluding observations inelibile for analyses |
| Level 4: Final datasets | Preparing final dtasets composed of level 3 datasets |
| Mean | SD | Min | 25% | Median | 76% | Max | IQR | ||
|---|---|---|---|---|---|---|---|---|---|
| HR (beats/min) | 89.9 | 16.5 | 58.1 | 77.1 | 86.9 | 102.0 | 139.3 | 24.6 | |
| SDNN (ms) | 46.4 | 20.3 | 7.6 | 32.1 | 42.2 | 56.6 | 138.9 | 24.5 | |
| RMSSD (ms) | 18.4 | 8.7 | 4.2 | 12.1 | 16.6 | 235 | 47.2 | 11.4 | |
| HF (ms3) | 77.9 | 72.0 | 1.6 | 27.4 | 56.2 | 104.0 | 422.3 | 76.6 | |
| HF (nu) | 14.0 | 8. | 1.9 | 8.8 | 12.3 | 16.8 | 68.1 | 8.0 | |
| LF (ms3) | 495.5 | 549.9 | 7.3 | 153.2 | 284.3 | 565.2 | 2962.6 | 412.0 | |
| LF (nu) | 74.3 | 15.1 | 7.8 | 67.2 | 79.4 | 85.2 | 94.7 | 17.9 | |
| PM2.5 (µg/m3) | 13.2 | 36.8 | 0.7 | 2.0 | 5.0 | 8.3 | 387.1 | 5.4 | |
| in traffica | 4.7 | 3.3 | 0.8 | 2.5 | 3.4 | 6.2 | 14.6 | 3.7 | |
| not in trafficv | 14.9 | 40.0 | 0.7 | 3.0 | 5.4 | 9.3 | 387.1 | 6.2 | |
| CO (ppm) | 0.7 | 0.8 | 0.0 | 0.3 | 0.5 | 0.8 | 9.5 | 0.5 | |
| in traffica | 1.0 | 0.8 | 0.0 | 0.5 | 0.8 | 1.3 | 3.9 | 0.8 | |
| not in trafficb | 0.6 | 0.7 | 0.0 | 0.3 | 0.5 | 0.7 | 9.5 | 0.4 | |
| PNC (c/cm3) | 19,304 | 32,561 | 9,945 | 4,205 | 6,624 | 13,787 | 147,386 | 9,582 | |
| in traffica | 7,450 | 5,263 | 9,945 | 3,693 | 5,720 | 10,844 | 2,6971 | 7,151 | |
| not in trafficb | 21,674 | 35,222 | 1,449 | 4,284 | 7,007 | 15,316 | 14,7386 | 11,0.2 | |
| a 75 5-min intervals, b 395 5mn-intervals For abbreviations see Appendix A3 | |||||||||
References:
Journal Articles:
No journal articles submitted with this report: View all 19 publications for this subprojectSupplemental Keywords:
Health, RFA, Scientific Discipline, Air, PHYSICAL ASPECTS, Health Risk Assessment, Physical Processes, Risk Assessments, particulate matter, Epidemiology, human exposure, long term exposure, aersol particles, atmospheric particles, exposure, PM, ambient particle health effects, atmospheric aerosol particles, atmospheric particulate matter, cardiovascular disease, human health risk, acute cardiovascular effectsProgress and Final Reports:
Original AbstractMain Center Abstract and Reports:
R832415 Rochester PM Center Subprojects under this Center: (EPA does not fund or establish subprojects; EPA awards and manages the overall grant for this center).
R832415C001 Characterization and Source Apportionment
R832415C002 Epidemiological Studies on Extra Pulmonary Effects of Fresh and Aged Urban Aerosols from Different Sources
R832415C003 Human Clinical Studies of Concentrated Ambient Ultrafine and Fine Particles
R832415C004 Animal models: Cardiovascular Disease, CNS Injury and Ultrafine Particle Biokinetics
R832415C005 Ultrafine Particle Cell Interactions In Vitro: Molecular Mechanisms Leading To Altered Gene Expression in Relation to Particle Composition
The perspectives, information and conclusions conveyed in research project abstracts, progress reports, final reports, journal abstracts and journal publications convey the viewpoints of the principal investigator and may not represent the views and policies of ORD and EPA. Conclusions drawn by the principal investigators have not been reviewed by the Agency.