
Grantee Research Project Results
Final Report: Enhanced Air Pollution Epidemiology using a Source-Oriented Chemical Transport Model
EPA Grant Number: R833864Title: Enhanced Air Pollution Epidemiology using a Source-Oriented Chemical Transport Model
Investigators: Kleeman, Michael J. , Ostro, Bart , Kaufman, Joel D. , Sampson, Paul , Chen, Shuhua , Ying, Qi , Reynolds, Peggy
Institution: University of California - Davis , University of Washington , Texas A & M University , Northern California Cancer Center
EPA Project Officer: Chung, Serena
Project Period: December 1, 2008 through November 30, 2012 (Extended to June 30, 2014)
Project Amount: $900,000
RFA: Innovative Approaches to Particulate Matter Health, Composition, and Source Questions (2007) RFA Text | Recipients Lists
Research Category: Particulate Matter , Air
Objective:
National Ambient Air Quality Standards (NAAQS) for PM2.5 have improved public health with economic benefits that more than cover the costs of the control programs themselves. Nevertheless, the competitive global market requires even greater efficiency in the future. Identification of especially toxic size fractions, sources, or chemical species within PM2.5 would enable the design of effective emissions control programs with reduced cost. Innovative methods are needed to pre-screen potentially toxic components of PM2.5 so that only the most promising candidates can be targeted for measurements. The latest generation of Chemical Transport Models (CTMs) can satisfy this requirement by supplying greatly improved estimates for particle concentrations, composition, and source contributions for epidemiological studies at a fraction of the cost required for measurements.
Summary/Accomplishments (Outputs/Outcomes):
Existing air quality models such as CMAQ and the UCD/CIT model were refined to provide source apportionment results in multiple size fractions for primary and secondary PM components. New models were developed to perform simultaneous source apportionment for ~1,000 sources of primary PM. Seven years (2000-06) of air quality simulations were performed for the eastern United States and California with 4 km spatial resolution and daily time resolution. Model performance was compared to all available measurements to identify the PM size fractions, chemical components, and sources that were suitable for inclusion in epidemiological studies.
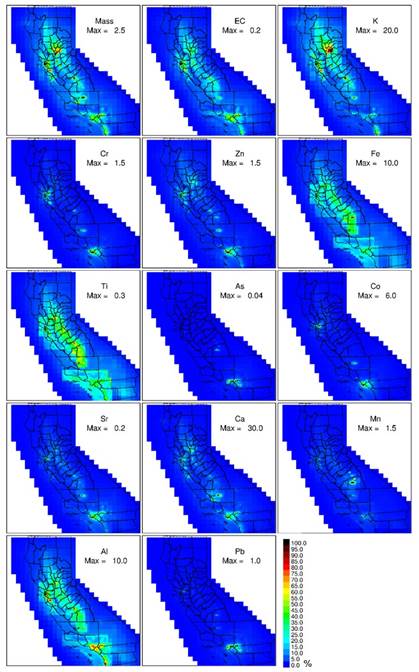
Model Results: Model calculations for PM2.5 in the eastern United States generally met accepted performance criteria but were judged to be not sufficiently accurate for incorporation into epidemiological studies with the cohort of over 6,000 people from the Multi-Ethnic Study of Atherosclerosis and Air Pollution (MESA). The epidemiological analysis was therefore prioritized to focus on California where the air pollution calculations were more reliable and where model results were available for novel features such as PM0.1 sources and components. A comprehensive comparison between monthly average model results and available measurements in California yielded Pearson correlation coefficients (R) ≥ 0.8 at ≥ 5 sites (out of a total of 8) for elemental carbon (EC) and nine trace elements: potassium, chromium, zinc, iron, titanium, arsenic, calcium, manganese, and strontium in the PM2.5 size fraction (Table 1). Longer averaging time increased the overall R for PM2.5 EC from 0.89 (1 day) to 0.94 (1 month), and increased the number of species with strong correlations at individual sites. Predicted PM0.1 mass and PM0.1 EC exhibited excellent agreement with measurements (R = 0.92 and 0.94, respectively). A total of 151 PM2.5 sources and 71 PM0.1 sources contained PM elements that were predicted at concentrations in general agreement with measured values at nearby monitoring sites.
| Species | Sacramento | SanJose1 | SanJose2 | Fresno | Bakersfield | Los Angeles | Riverside | ElCajon |
|---|---|---|---|---|---|---|---|---|
| EC | 0.11 | 0.01 | 0.01 | 0.07 | 0.02 | 0.00 | 0.13 | 0.04 |
| K | 0.07 | -0.09 | -0.07 | 0.06 | -0.10 | -0.02 | 0.02 | -0.16 |
| CR | -0.05 | 0.12 | 0.06 | 0.19 | 0.03 | 0.12 | 0.20 | 0.02 |
| ZN | 0.25 | 0.05 | 0.09 | -0.08 | -0.04 | -0.02 | -0.15 | 0.08 |
| FE | 0.73 | 0.21 | 0.36 | 0.67 | 0.25 | 0.22 | 0.33 | 0.18 |
| TI | 0.43 | 0.05 | 0.19 | 0.39 | 0.10 | 0.11 | 0.17 | 0.09 |
| AS | -0.13 | -0.06 | -0.02 | -0.32 | -0.65 | 0.02 | 0.01 | 0.07 |
| CO | 0.04 | -0.02 | 0.02 | -0.65 | 0.06 | 0.51 | 0.48 | -0.91 |
| SR | 0.11 | -0.06 | -0.02 | 0.05 | -0.10 | -0.28 | -0.12 | -0.08 |
| CA | 0.42 | -0.08 | 0.09 | 0.36 | 0.06 | -0.08 | -0.09 | 0.04 |
| MN | 0.60 | 0.17 | 0.45 | 0.63 | 0.38 | 0.16 | 0.25 | 0.11 |
| AL | 0.91 | 0.72 | 0.74 | 0.95 | 0.51 | 0.77 | 0.44 | 0.45 |
| SI | 0.86 | 0.30 | 0.60 | 0.80 | 0.42 | 0.32 | 0.18 | 0.29 |
| CU | -0.33 | -0.10 | -0.21 | -0.63 | -0.63 | -0.08 | 0.01 | -0.43 |
| NI | -0.18 | -0.72 | -0.28 | -0.02 | 0.24 | 0.07 | 0.13 | -0.49 |
| PB | -0.34 | -0.24 | -0.09 | -0.62 | -0.66 | 0.03 | 0.06 | -0.11 |
| V | -0.45 | -0.61 | -0.82 | 0.02 | -0.20 | -0.30 | -0.09 | -0.44 |
| MO | -0.60 | -1.19 | -1.14 | -0.70 | -0.76 | -0.69 | -0.08 | -1.60 |
| RB | -0.32 | -0.76 | -0.59 | -0.29 | -0.50 | -0.26 | -0.07 | -0.70 |
| BA | -1.09 | -1.03 | -0.38 | -0.73 | -1.26 | -0.57 | -0.94 | -0.98 |
| CD | -1.67 | -0.76 | -0.96 | -1.76 | -1.25 | -0.79 | -0.62 | -1.37 |
| MG | -1.23 | -1.32 | -1.28 | -1.31 | -1.56 | -1.28 | -1.55 | -1.43 |
| NA | -1.59 | -1.86 | -1.73 | -1.40 | -1.40 | -1.57 | -1.51 | -1.78 |
| R | ||||||||
| 0.8!1 Very Strong | 0.06 ~ 0.08 Strong | 0.3~0.6 Weak | R≤0 no correlation |

Associations were also found between IHD and several ultrafine components including EC, Cu, metals and mobile sources. The results suggest that the model successfully provided estimates of long-term exposure to fine and ultrafine species and sources at a 4km spatial resolution, and helped identify their relative toxicity. Several of the PM species generated greater risk estimates than that of PM mass itself.
Pollutant HR Low CI Upper CI p-value
# Besides Cu, Fe, and Mn; S1-S8 indicate sources of primary particles
Conclusions:
Exposure estimates to PM2.5 developed directly from regional chemical transport models yield health effects estimates that are consistent with previous epidemiological studies that were based on PM2.5 measurements at central site monitors. The chemical resolution and source apportionment capabilities of the regional chemical transport models allow for the identification of different size fractions, chemical species, and source contributions. A preliminary analysis of results in California identifies statistically significant associations between ischemic heart disease (IHD) mortality and PM2.5 mass, elemental carbon (EC), copper (Cu), and secondary organics and the sources gas- and diesel-fueled vehicles, meat cooking and high sulfur fuel combustion. Associations between IHD were also observed for several ultrafine components including EC, Cu, metals and mobile sources.
Further work should be performed to verify the ability of chemical transport models to provide realistic exposure assessments for fine and ultrafine particles. These models should then be further utilized to identify specific components and/or sources of PM2.5 and PM0.1 that are highly associated with adverse health effects.
Journal Articles on this Report : 16 Displayed | Download in RIS Format
| Other project views: | All 27 publications | 17 publications in selected types | All 17 journal articles |
|---|
| Type | Citation | ||
|---|---|---|---|
|
|
Adar SD, Klein R, Klein BE, Szpiro AA, Cotch MF, Wong TY, O'Neill MS, Shrager S, Barr RG, Siscovick DS, Daviglus ML, Sampson PD, Kaufman JD. Air pollution and the microvasculature: a cross-sectional assessment of in vivo retinal images in the population-based Multi-Ethnic Study of Atherosclerosis (MESA). PLoS Medicine 2010;7(11):e1000372 (11 pp.). |
R833864 (2011) R833864 (2012) R833864 (Final) R831697 (2010) R831697 (2011) R831697 (2012) R831697 (2013) R831697 (Final) |
Exit Exit |
|
|
Adar SD, Sheppard L, Vedal S, Polak JF, Sampson PD, Diez Roux AV, Budoff M, Jacobs Jr. DR, Barr RG, Watson K, Kaufman JD. Fine particulate air pollution and the progression of carotid intima-medial thickness: a prospective cohort study from the Multi-Ethnic Study of Atherosclerosis and air pollution. PLoS Medicine 2013;10(4):e1001430 (9 pp.). |
R833864 (2012) R833864 (2013) R833864 (Final) R831697 (2013) R831697 (Final) |
Exit Exit |
|
|
Hu JL, Zhang H, Chen S, Ying Q, Wiedinmyer C, Vandenberghe F, Kleeman MJ. Identifying PM2.5 and PM0.1 sources for epidemiological studies in California. Environmental Science & Technology 2014;48(9):4980-4990. |
R833864 (2011) R833864 (Final) |
Exit Exit Exit |
|
|
Hu J, Zhang H, Chen S-H, Wiedinmyer C, Vandenberghe F, Ying Q, Kleeman MJ. Predicting primary PM2.5 and PM0.1 trace composition for epidemiological studies in California. Environmental Science & Technology 2014;48(9):4971-4979. |
R833864 (2011) R833864 (2012) R833864 (2013) R833864 (Final) |
Exit Exit Exit |
|
|
Hu J, Jathar S, Zhang H, Ying Q, Chen S-H, Cappa CD, Kleeman MJ. Long-term particulate matter modeling for health effect studies in California – Part 2: Concentrations and sources of ultrafine organic aerosols. Atmospheric Chemistry and Physics 2017;17(8):5379-5391. |
R833864 (Final) |
Exit Exit |
|
|
Hu J, Ostro B, Zhang H, Ying Q, Kleeman MJ. Using chemical transport model predictions to improve exposure assessment of PM2.5 constituents. Environmental Science & Technology Letters 2019;6:456–61. |
R833864 (Final) |
Exit Exit |
|
|
Sampson PD, Szpiro AA, Sheppard L, Lindstrom J, Kaufman JD. Pragmatic estimation of a spatio-temporal air quality model with irregular monitoring data. Atmospheric Environment 2011;45(36):6593-6606. |
R833864 (2011) R833864 (2012) R833864 (2013) R833864 (Final) R831697 (2011) R831697 (2012) R831697 (2013) R831697 (Final) |
Exit Exit Exit |
|
|
Sampson PD, Richards M, Szpiro AA, Bergen S, Sheppard L, Larson TV, Kaufman JD. A regionalized national universal kriging model using Partial Least Squares regression for estimating annual PM2.5 concentrations in epidemiology. Atmospheric Environment 2013;75:383-392. |
R833864 (2012) R833864 (2013) R833864 (Final) R831697 (2013) R831697 (Final) R834796 (2013) R834796 (2014) R834796 (2015) |
Exit Exit Exit |
|
|
Szpiro AA, Sampson PD, Sheppard L, Lumley T, Adar SD, Kaufman JD. Predicting intra-urban variation in air pollution concentrations with complex spatio-temporal dependencies. Environmetrics 2010;21(6):606-631. |
R833864 (2011) R833864 (2012) R833864 (2013) R833864 (Final) R831697 (2010) R831697 (2011) R831697 (2012) R831697 (2013) R831697 (Final) |
Exit Exit |
|
|
Vaishnav P, Horner N, Azevedo IL. Was it worthwhile? Where have the benefits of rooftop solar photovoltaic generation exceeded the cost? Environmental Research Letters 2017;12(9):094015 (14 pp.). |
R833864 (Final) R835873 (2017) R835873 (2018) R835873 (Final) |
Exit Exit Exit |
|
|
Wang M, Sampson PD, Hu J, Kleeman M, Keller JP, Olives C, Szpiro AA, Vedal S, Kaufman JD. Combining land-use regression and chemical transport modeling in a spatiotemporal geostatistical model for ozone and PM2.5. Environmental Science & Technology 2016;50(10):5111-5118. |
R833864 (Final) R831697 (Final) R833741 (Final) R834796 (2016) R834796 (Final) |
Exit Exit Exit |
|
|
Zhang H, Ying Q. Source apportionment of airborne particulate matter in Southeast Texas using a source-oriented 3D air quality model. Atmospheric Environment 2010;44(29):3547-3557. |
R833864 (2009) R833864 (2010) R833864 (2011) R833864 (2012) R833864 (2013) R833864 (Final) |
Exit Exit Exit |
|
|
Zhang H, Li J, Ying Q, Yu JZ, Wu D, Chen Y, He K, Jiang J. Source apportionment of PM2.5 nitrate and sulfate in China using a source-oriented chemical transport model. Atmospheric Environment 2012;62:228-242. |
R833864 (2011) R833864 (2012) R833864 (2013) R833864 (Final) R833865 (Final) |
Exit Exit Exit |
|
|
Zhang H, Hu J, Kleeman M, Ying Q. Source apportionment of sulfate and nitrate particulate matter in the Eastern United States and effectiveness of emission control programs. Science of the Total Environment 2014;490:171-181. |
R833864 (Final) |
Exit Exit Exit |
|
|
Zhang H, Chen G, Hu J, Chen S-H, Wiedinmyer C, Kleeman M, Ying Q. Evaluation of a seven-year air quality simulation using the Weather Research and Forecasting (WRF)/Community Multiscale Air Quality (CMAQ) models in the eastern United States. Science of the Total Environment 2014;473-474:275-285. |
R833864 (2013) R833864 (Final) R833865 (Final) |
Exit Exit Exit |
|
|
Hu J, Zhang H, Ying Q, Chen S-H, Vandenberghe F, Kleeman MJ. Long-term particulate matter modeling for health effects studies in California-Part 1: model performance on temporal and spatial variations. Atmospheric Chemistry and Physics 2015;15(6):3445-3461. |
R833864 (2013) R833864 (Final) |
Exit Exit Exit |
Supplemental Keywords:
Chemical transport model, air pollution epidemiology, ultrafine particlesRelevant Websites:
Professor Michael Kleeman Exit
Progress and Final Reports:
Original AbstractThe perspectives, information and conclusions conveyed in research project abstracts, progress reports, final reports, journal abstracts and journal publications convey the viewpoints of the principal investigator and may not represent the views and policies of ORD and EPA. Conclusions drawn by the principal investigators have not been reviewed by the Agency.