U.S. flag

An official website of the United States government

Here’s how you know

Dot gov

Official websites use .gov
A .gov website belongs to an official government organization in the United States.

HTTPS

Secure .gov websites use HTTPS
A lock (LockA locked padlock) or https:// means you have safely connected to the .gov website. Share sensitive information only on official, secure websites.

  • Environmental Topics
  • Laws & Regulations
  • Report a Violation
  • About EPA
Contact Us

Grantee Research Project Results

2009 Progress Report: Nonlinear and Threshold Responses to Environmental Stressors in Land-river Networks at Regional to Continental Scales

EPA Grant Number: R833261
Title: Nonlinear and Threshold Responses to Environmental Stressors in Land-river Networks at Regional to Continental Scales
Investigators: Melillo, Jerry , Peterson, Bruce J. , Vörösmarty, Charles J. , Felzer, Benjamin S. , Kicklighter, David Wesley , McClelland, James , Wollheim, Wil
Institution: Marine Biological Laboratory , University of New Hampshire , City University of New York , Lehigh University
Current Institution: Marine Biological Laboratory , University of New Hampshire
EPA Project Officer: Packard, Benjamin H
Project Period: September 1, 2007 through August 31, 2010 (Extended to August 31, 2011)
Project Period Covered by this Report: November 1, 2008 through October 31,2009
Project Amount: $899,191
RFA: Nonlinear Responses to Global Change in Linked Aquatic and Terrestrial Ecosystems and Effects of Multiple Factors on Terrestrial Ecosystems: A Joint Research Solicitation- EPA, DOE (2005) RFA Text |  Recipients Lists
Research Category: Aquatic Ecosystems , Climate Change

Objective:

Our objective in this research is to explore the relationships among environmental stresses, the nonlinear and threshold behaviors they cause within freshwater ecosystems of large drainage basins, and the ecosystem services provided by the streams and rivers of the basins.  To do this we are refining our process-based aquatic model, the Aquatic Ecosystem Model (AEM) and testing its ability to simulate documented nonlinear and threshold responses to environmental stresses at a variety of spatial scales, from the river reach to the entire river network within a drainage basin.  We are also coupling the AEM with our improved terrestrial biogeochemistry model, the Terrestrial Ecosystem Model (TEM), thereby creating a new version of our Drainage Basin Model, which we will use for regional analyses of nonlinear and threshold behaviors in freshwater systems at large scales.  A cartoon conceptualization of these couplings appears in Figure 1.
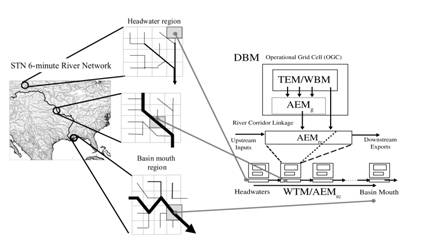
Figure 1.  Conceptualization of the Drainage Basin Model.  Nonpoint loading of solutes and particulates to river and stream ecosystems will first be predicted by TEM.  The AEM will then use these simulated nonpoint loadings along with estimates of point sources as inputs into both local (within grid) and ultimately macro-scale (between grid) river networks.  AEMg will simulate biological processing of organic matter and nutrients in low order streams within a grid cell computing the net export of constituents to higher order macro-level streams.  AEMrc will then simulate additional biological processing of organic matter and nutrients in major river corridors to estimate the export of materials on their movement downstream to the river mouth.  Water will be moved between stream reaches with the Water Transport Model (WTM).  Potential 8 km networks are shown.  The heavy black line on the map represents the Missouri and lower Mississippi Rivers. 

Progress Summary:
The coupling of the component models is being done in a modeling framework, FrAMES, specifically designed by us for land-water interaction studies.
 
II.  Overview:  We continue to make progress in refining both the AEM and the TEM and incorporating these models into FrAMES.  We have also made major progress in adapting a number of data sets on dynamic input fields needed for our integrated modeling effort.  In 2009, our research produced 4 publications, 2 manuscripts in preparation and two presentations at the national meetings.
III.  AEM Progress:  Our goal in this part of the research is to develop a version of AEM that will allow us to explore nonlinear responses to various climate and terrestrial drivers.  We are developing AEM to have a moderate level of complexity so that it is compatible with the Terrestrial Ecosystem Model (TEM), and will facilitate our exploration of coupled dynamics of terrestrial and aquatic ecosystems.  We have been adding additional functionality to AEM to adequately represent key aquatic ecosystem drivers (temperature, light).  Examples include quantification of water temperature and light energy inputs through the water column, both of which are influenced by aquatic processes and conditions as water is routed through the river network.  The hydrology module, which predicts runoff, discharge, and channel hydraulics, has already been developed in FrAMES, and provides the hydrologic conditions necessary to model ecosystem processes in both the terrestrial and aquatic environments.  The terrestrial inputs of energy (carbon transfer from land to water, i.e. allochthonous inputs) and nutrients (nitrogen and phosphorus) are being driven by TEM, which has recently been integrated into FrAMES, but not yet fully coupled with AEM. 
 
III.1.  AEM Current Capacity.  The current version of AEM takes advantage of hydrologic functionality provided by the WBMplus (our enhanced water balance model) to route material through continental river systems.  Besides representing the natural runoff generation processes, WBM/WTMplus incorporates water withdrawals (from surface diversions and groundwater) plus reservoir operation modules to treat direct human impacts on streamflow (Fekete, et al., 2009; Wisser, et al., 2008; Wisser, et al., 2009a; Wisser, et al., 2009b).  These models predict spatially distributed discharge, a key driver of aquatic processes.  Other key drivers of aquatic processes include light and water temperature.  We have developed submodels that predict these drivers, as described in our previous annual report.  FrAMES now has the capacity to route water temperature, nitrogen and carbon.  While temperature routing is embedded entirely within the hydrology model (i.e. it uses the same drivers that are used by the hydrology modules), routing of carbon and nitrogen requires estimates of spatially distributed loading from land, either using predictions from terrestrial ecosystem models, or specified as input fields from other sources.  The input fields are provided by existing data sets (Green, et al., 2004), or by ongoing work on this project (e.g. linkage to the TEM model; development of point source time series estimate).
 
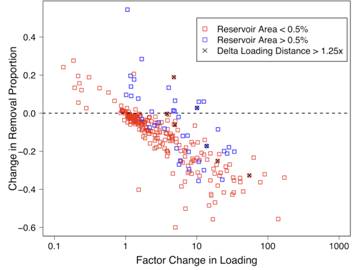
III.2  AEM Denitrification/Respiration Component.  Transformations of carbon and nitrogen currently emphasize dissimilatory processes (i.e., removal from the system through respiration of carbon or denitrification of nitrate).  For nitrogen we use simple removal parameters that are based on empirical studies (Mulholland, et al., 2008).  These removal parameters are a function of concentration and water temperature (Wollheim, et al., 2008a; Wollheim, et al., 2008b).  The empirical studies indicate that denitrification is a non-linear function of concentration (Mulholland, et al., 2008).  We have explored the impact that this non-linearity has had on the flux of dissolved inorganic nitrogren (DIN) to the coastal zone between preindustrial and contemporary periods (Wollheim, et al., in preparation, Figure 2).  The non-linearity leads to a weakened capacity of entire river systems to control nutrient exports.  On average, each order of magnitude increase in loading to a watershed results in a 24% decline in the proportion of aquatic loading that is removed.  However, the construction of reservoirs can offset some, though not all of this decline.  Our analysis indicates that efficiency loss contributes 25% of the increase in nutrient exports to the coastal zone in the contemporary era due to anthropogenic activities.  That is, the non-linearity in denitrification rates results in a positive feedback in DIN export, so that exports to the coastal zone increase by a greater factor than do inputs to the river system.  We are currently in the process of developing a similar submodel to route dissolved organic carbon.
  
Figure 2.  Difference in basin scale removal proportions between preindustrial and contemporary periods in the 400 largest global watersheds.
 
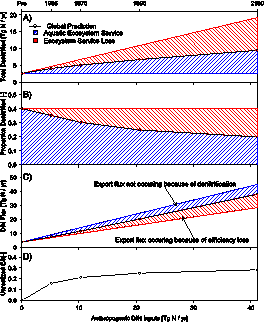
Nitrate removal from fresh water ecosystems through denitrification can be thought of as an ecosystem service.  Figure 3 shows various aspects of the relationship between anthropogenic DIN inputs and indexes of the denitrification service.
 

WollheimFig2.eps


Figure 3.  Relationships between anthropogenic DIN inputs to fresh water ecosystems and various indexes of denitrification considered as an ecosystem service considered at the global scale: anthropogenic DIN inputs (Tg N/yr) vs – A) total denitrified N (Tg N/yr), B) proportion denitrified, C) DIN flux to the coastal zone (Tg N/yr), D) unrealized ecosystem service.
 
IV.  TEM CURRENT CAPACITY:  We continue to develop a new version of the model (TEM-Hydro, Felzer, et al. 2009) to enable us to explore more thoroughly the linkages between the water, carbon, and nitrogen cycles.  To capture the role of stomatal conductance in transpiration (Shuttleworth and Wallace, 1985), CO2 (Ball, et al., 1987) and ozone uptake (Felzer, et al., 2007), we now explicitly model specific components of vegetation, rather than a single aggregated pool for all vegetation carbon.  We have thus developed a multiple pool model for vegetation carbon and nitrogen, consisting of leaves, active and inactive stem tissues (e.g., sapwood and heartwood), fine roots, and a labile pool for storage.  In addition, we have developed algorithms to describe the transfer of carbon and nitrogen to river networks due to leaching of nitrate (DIN), dissolved organic nitrogen (DON) and dissolved organic carbon (DOC) from terrestrial ecosystems (McGuire, et al., 2010; Tian, et al., 2010).
To date, we have validated TEM-Hydro for eastern deciduous forest ecosystems and done a set of climate simulations to explore the relative effects of future changes in atmospheric CO2 concentration, climate and nitrogen availability on evapotranspiration and runoff from forested drainages (Felzer, et al., 2009).  With respect to the validation, TEM-Hydro captures the estimated mean annual evapotranspiration in forested eastern U.S. basins as well as the observed seasonality and interannual variations of river discharge.  We also examined plant physiological responses to changes in climate, CO2, troposheric O3 exposure and nitrogen limitations and the consequences for the hydrological cycle in twelve watersheds in the eastern U.S, using four different GCM/IPCC emissions-scenario projections of future climate.  We found that while the direction of future runoff changes is largely dependent upon predicted precipitation changes, runoff is always larger when nitrogen-limitation and ozone damage are considered.  We are now conducting a similar analysis for the western U.S.
V.  DATA SET DEVELOPMENT:  A key element of our project is to carry out our analyses at high spatial and temporal resolutions. This requires assembling a series of new data representing river networks, land cover characteristics, soil properties, climate forcings, contaminant sources, and so on.
V.1.  River Network and Corresponding Elevation.  High resolution representation of the river systems play central role in our research. Originally, our intention was to use a 6 minute network derived from HYDRO1k (Verdin, et al., 1999; Gesch, et al., 1999) modified with network regridding algorithm by Fekete, et al., (2001) and applying same manual editing that we applied to our previous 30 minute resolution network (Vörösmarty, et al., 2000).  HYDRO1k turned out to have too many significant errors and as a consequence the resulting 6-minute network needed too much manual editing.  Recently, the World Wildlife Fund started to develop a new high resolution gridded network derived from the Shuttle Radar Terrain Mapping mission elevation data combined with a variety of additional data sources representing linear features like river courses or lake and continent shore lines.  The resulting ~500 m (15 arc second on longitude × latitude) gridded network (HydroSHEDS) (Lehner, et al., 2008, 2006) is probably the best representation of the river systems globally (with the exception of higher latitudes that SRTM elevation did not cover).  The ~500 m resolution is actually too high for carrying out flow routing over large watersheds so we applied the same regridding algorithm from Fekete et al., (2001) to aggregate HydroSHEDS to coarser resolutions (3 and 6 arc minutes).  We choose 3 and 6 minutes because these resolutions yield exact numbers (0.05 and 0.1 degree respectively) in decimal degrees.  We merged HydroSHEDS with our existing 6 minute network to expand its coverage beyond the SRTM domain.
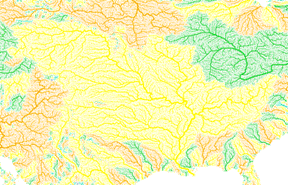
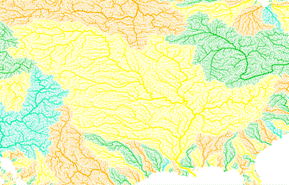
Furthermore, we applied network defragmentation routine, which eliminates sporadic basin fragments (as a result of DEM errors) by identifying endorheic basins and searching for potential pour points on their watershed boundaries within a given elevation threshold (Figure 4).  The algorithm reroutes the gridcells between the pour point and the endrorheic basin's outlet to connect the basins to the adjacent basin with lower basin outlet.  The elevation data guiding the defragmentation was derived from the GLOBE[1] 1 km (30 arc second) data set from NOAA (which has full global coverage) that was aggregated to 6 minute resolution and corrected against our 6 minute network that was derived from HYDRO1k, but the editing was never completed.  The DEM correction utilized the gridded river network and lowered the elevation (cutting valleys) along all potential river courses from headwater to river mouth, when the elevation was inconsistent with the river network.  The resulting network has full coverage for North America and combines HydroSHEDS with HYDRO1k network.  Complementing elevation data applying the same correction to aggregated GLOBE 6-minute data using the combined HydroSHEDS/HYDRO1k network was also generated.
 
Figure 4: 6 minute networks derived from HydroSHEDS, before (on the left) and after (on the right) eliminating sporadic basin fragments.
 
V.2.  Land Cover and Soil Characteristics.  We adapted data for decadal global cropland extents from 1700 through 1992 were from Ramankutty and Foley (1999).  The 1992 base year data was derived from remotely sensed land cover classification data and cropland inventory data to build a global inventory of permanent cropland area at a 5min spatial resolution. Historic croplands were constructed based on a simple land cover change model in conjunction with an extensive historical inventory of national and sub-national cropland data.  Base year data for 1992 and historical cropland data at decadal temporal resolution for years 1700 – 1990 was provided by Ramankutty, et al. [1999].
In addition, we adapted data for percent sand, percent silt, percent clay and available water capacity of soils that was developed from the ISRIC-WISE[2] derived soil properties on a 5 by 5 arc-minutes global grid, version 1.1. Soil variables from the ISRIC-WISE v1.1 database were weighted according to the proportion of soil types within each soil depth class for each mapped DSMW spatial soil unit (SUID).  Weighted soil variables for soil depths of 0-20 cm, 20-40 cm, 40-60 cm, 60-80 cm and 80-100 cm were then linked to the 5min global grid by SUID designation. 
V.3.  Climate Forcings.  We assembled climate forcing data from various sources (NCEP reanalysis (Kalnay, et al., 1996, Kistler, et al., 2001), CRU gridded meteorological station data (New, et al. 2000), GPCC[3] monitoring and full precipitation products, GPCP 1DD and GPCP (Huffman, et al., 1997), CMORPH (Joyce, et al., 2004).  These data sets come in different temporal resolutions ranging from quarter degree to 2.5 degree, which are rather coarse for our analysis.  Downscaling is carried out on the fly (during model runs) as part of the data preprocessing step in our modeling framework.  Currently, we use a simple distance weighted interpolation, but we are about to implement a DEM-aided interpolation in our framework that will use high resolution topography guiding the downscaling.
 
These data sets also have varying temporal resolutions ranging from 3 hourly to monthly.  While the monthly data are often better quality (e.g., the GPCC “full” product providing gauge based gridded precipitation estimates from 1901-2007), but our model simulations need daily input.  We use the daily partitioning from monthly totals derived from less reliable data (e.g., CMORPH or NCEP reanalysis) against the higher quality monthly products as a mean of daily disaggregation.
The various data span different time frames.  While some “historical” products go back in time to 1948 (NCEP) and 1901 (CRU and GPCC full product) they stop in near present (2001 or 2006).  The overlapping period of these “historical” climate data and the modern satellite era products (coming up into the present) provide the mean to relate the past model simulation to near real-time simulations.
 
V.4.  EPA's Clean Watershed Needs Survey (CWNS). The carbon, nitrogen and phosphorus cycles in watersheds are significantly affected by wastewater transportation, treatment and release. Wastewater discharges together with the fertilizer runoff are primary sources of nutrient pollution of water bodies. Globally, almost 20% of total nitrogen load into streams comes from fertilizer runoff and wastewater point sources (Green, et al., 2004). In watersheds with a large number of point sources such as Mississippi River Basin, the point sources contribute a large amount to the total nutrient input (Wollheim, et al., 2008).
 
EPA’s Clean Watershed Needs Survey (CWNS) provides geographic, demographic, hydrologic, biochemical and financial data about points sources which are present or projected to meet the Clean Watershed Act water quality requirements from 1972.  These point sources include publicly owned wastewater treatment and collection facilities, storm water and combined sewer overflows control facilities, non-point source pollution projects, decentralized wastewater management, and estuary management projects. These data, although available for different lengths of time by category, cover the period between 1973 and 2004.  The data older than 1984 are coded by a different method than the more recent records and a user’s dictionary is necessary to decode and obtain all information needed for the analysis.  We have made a major effort to organize these data for our use.
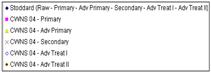
Concentration data for six wastewater parameters in influent and effluent are of interest to us: biological oxygen demand (BOD), dissolved oxygen (DO), suspended solids (SS), total nitrogen (TN), ammonia (NH3-N) and total phosphorus (TP).  The number of concentration records varies from 73% of measurements for SS to 0.3% for TN.  Therefore, the concentrations were statistically analyzed to obtain mean values for each parameter and each treatment level (Figure 5).  Comparison of these estimated concentrations with published data (Stoddard, et al., 2002) confirms the reliability of our results despite the fact that some datasets were statistically very small and highly skewed.


 Figure 5. Mean values for each water quality parameter and each treatment level for point source inputs across the U.S.
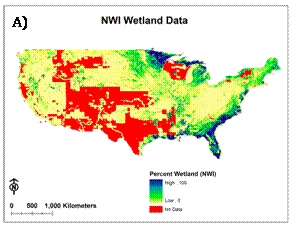
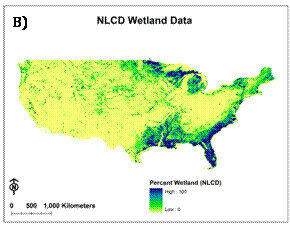
 V.5. Wetland Data Sets  Wetlands can greatly influence both nitrogen and carbon loading to aquatic systems.  We therefore developed a wetland data set for the US that is applicable to continental scale modeling.  We aggregated existing high-resolution data sets to the 6 minute (~8 x 8 km) resolution.  We obtained the entire National Wetlands Inventory digital archive from Tom Dahl at the United States Fish and Wildlife Service.  This is a very high resolution (1:24000) digital data set that covers 58% of the conterminous U.S. and 25% of Alaska.  We also extracted the wetland data in the National Land Cover Data (NLCD) set, which is at 30m resolution.  Each of these data sets was aggregated to courser products that can interface with our gridded models.  We are aggregating the data to 6 minute resolution, to provide a wetland layer of percent of grid cell as wetlands.  The resulting maps for each of the data sets are shown in Figure 6.  The relative accuracy of the two data sets is currently being determined. 


Figure 6. Wetland distribution from a) the National Wetland Inventory, and b) the National Land Cover Data set.
 

[1]    http://www.ngdc.noaa.gov/mgg/topo/globe.html
[2]    http://www.isric.org
[3]    http://gpcc.dwd.de

References:

Fekete, B. M., C. J. Vörösmarty and R. B. Lammers: Scaling gridded river networks for macro-scale hydrology: Development and analysis and control of error, Water Resources Research, 37(7), 1955-1968, 2001.
 
Fekete, B. M., D. Wisser, C. Kroeze, E. Mayorga, A. F. Bouwman, and W. M. Wollheim (2009), Scenario drivers (1970-2050): Climate and hydrolalterations, Global Biogeochemical Cycles, In Review.
Gesch, D. L., K. L. Verdin and S. K. Greenlee: New land surface digital elevation model covers the Earth, AGU EOS Transactions, 80(6), 69-70, 1999.
 
Green, P. A., C. J. Vörösmarty, M. Meybeck, J. N. Galloway, B. J. Peterson and E. W. Boyer: Pre-industrial and contemporary fluxes of nitrogen through rivers: A global assessment based on typology, Biogeochemistry, 68, 71-105, 2004.
 
Huffman, G. J., R. F. Adler, P. A. Arkin, A. Chang, R. Ferraro, A. Gruber, J. Janowiak, A. McNab, B. Rudolf and U. Schneider: The Global Precipitation Climatology Project (GPCP) Combined Precipitation Dataset, Bulletin of American Meteorologycal Society, 78(1), 5-20, 1997.
 
Joyce, R. J., J. E. Janiwiak, P. A. Arkin and P. Xie: CMORPH: A method that produces global precipitation estimates from passive microwave and infrared data at high spatial and temporal resolution, J. Hydromet, 5, 487-503, 2004.
 
Kalnay, E., M. Kanamitsu, R. Kistler, W. Collins, D. Deaven, L. Gandin, M. Iredell, S. Saha, G.and Woolen White, Y. Zhu, M. Chelliah, W. Ebisuzaki, W. Higgis, J. Janowiak, K. C. Mo, C. Ropelewski, J. Wang, A. Leetmaa, R. Reynolds, R. Jenne and D. Joseph: The NCEP/NCAR 40-year reanalysis project, Bulletin of the American Meteorological Society, 77(3), 437-472, 1996.
 
Kistler, R., E. Kalnay, W. Collins, S. Saha, G. White, J. Woolen, M. Chelliah, W. Ebisuzaki, M. Kanamitsu, V. Kousky, H. van den Dool, R. Jenne and M. Fiorino: The NCEP/NCAR 50-year reanalysis: Monthly means CD-ROM and Documentation, Bull. Amer. Meteorol. Soc., 82, 247-267, 2001.
 
Lehner, B., K. Verdin and A. Jarvis: Hydrological data and maps based on Shuttle elevation derivatives at multiple scales (HydroSHEDS), World Wildlife Fund, US, 2006.
 
Lehner, B., K. Verdin and A. Jarvis: New global hydrography derived from spaceborne elevation data, AGU EOS Transactions, 89(10), 93-94, 2008.
 
Mulholland, P. J., and e. al. (2008), Stream denitrification across biomes and its response to anthropogenic nitrate loading, Nature, 452, 202-206.
 
New, M., M. Hume and P. Jones: Representing Twentieth Century Space-time Climate Variability: II. Development of 1901-1996 monthly grids of terrestrial surface, Journal of Climatology, 13, 2217-2238, 2000.
 
Ramankutty, N. and J. A. Foley: Estimating historical changes in global land cover: croplands from 1700 to 1992, Global Biochemical Cycles, 13(4), 997-1027, 1999.
 
Verdin, K. L. and J. P. Verdin: A Topological System for Delineation and Codification of the Earth's River Basins, Journal of Hydrology, in press, 1999.
 
Vörösmarty, C. J., B. M. Fekete, M. Meybeck and R. B. Lammers: Global System of Rivers: Its role in organizing continental land mass and defining land-to-ocean linkages, Global Biochemical Cycles, 14(2), 599-621, 2000.
 
Wisser, D., S. Frolking, E. M. Douglas, B. Fekete, C. J. Vorosmarty, and A. H. Schumann (2008), Global irrigation water demand: Variability and uncertainties arising from agricultural and climate data sets, Geophysical Research Letters , 35, L24408, doi:24410.21029/22008GL035296.
 
Wisser, D., B. M. Fekete, C. J. Vorosmarty, and A. H. Schumann (2009a), Reconstructing 20th century global hydrography: a contribution to the Global Terrestrial Network- Hydrology (GTN-H), Hydrology and Earth System Sciences Discussions, 6, 2679-2732.
 
Wisser, D., S. Frolking, E. M. Douglas, B. Fekete, A. H. Schumann, and C. J. Vorosmarty (2009b), Blue and green water: The significance of local water resources captured in small reservoirs for crop production, Journal of Hydrology, Submitted.
 
Wollheim, W. M., B. J. Peterson, C. J. Vorosmarty, C. Hopkinson, and S. A. Thomas (2008a), Dynamics of N removal over annual time scales in a suburban river network., Journal of Geophysical Research - Biogeosciences, G03038, doi:10.1029/2007JG000660.
 
Wollheim, W. M., C. J. Vorosmarty, A. F. Bouwman, P. A. Green, J. Harrison, E. Linder, B. J. Peterson, S. Seitzinger, and J. P. M. Syvitski (2008b), Global N removal by freshwater aquatic systems: a spatially distributed, within-basin approach., Global Biogeochemical Cycles, 22, GB2026, doi:2010.1029/2007GB002963.
 
Wollheim, W. M., B. J. Peterson, and C. J. Vorosmarty (In Preparation), Decline in Ecosystem Service Efficiency Magnifies Global Flux of Anthropogenic Nitrogen to Coastal Zones, Nature.


Journal Articles on this Report : 4 Displayed | Download in RIS Format

Publications Views
Other project views: All 28 publications 13 publications in selected types All 13 journal articles
Publications
Type Citation Project Document Sources
Journal Article Alexander RB, Bohlke JK, Boyer EW, David MB, Harvey JW, Mulholland PJ, Seitzinger SP, Tobias CR, Tonitto C, Wollheim WM. Dynamic modeling of nitrogen losses in river networks unravels the coupled effects of hydrological and biogeochemical processes. Biogeochemistry 2009;93(1-2):91-116. R833261 (2008)
R833261 (2009)
R833261 (2010)
R833261 (Final)
R834187 (2010)
R834187 (2011)
R834187 (2012)
R834187 (2013)
R834187 (Final)
  • Full-text: Springer-Full Text HTML
    Exit
  • Abstract: Springer-Abstract
    Exit
  • Other: Springer-Full Text PDF
    Exit
  • Journal Article Felzer BS, Cronin TW, Melillo JM, Kicklighter DW, Schlosser CA. Importance of carbon-nitrogen interactions and ozone on ecosystem hydrology during the 21st century. Journal of Geophysical Research-Biogeosciences 2009;114(G1):G01020 (10 pp.). R833261 (2008)
    R833261 (2009)
    R833261 (2010)
    R833261 (Final)
  • Full-text: Wiley-Full-text PDF
    Exit
  • Abstract: Wiley-Abstract & Full-text HTML
    Exit
  • Journal Article Green MB, Wollheim WM, Basu NB, Gettel G, Rao PS, Morse N, Stewart R. Effective denitrification scales predictably with water residence time across diverse systems. Nature Precedings 2009;3520.1. R833261 (2009)
    R833261 (2010)
    R833261 (Final)
    R834187 (2010)
    R834187 (2011)
    R834187 (2012)
    R834187 (2013)
    R834187 (Final)
  • Full-text: Nature Precedings-Full Text HTML
    Exit
  • Abstract: Nature Precedings-Abstract
    Exit
  • Other: Research Gate-Abstract & Full Text PDF
    Exit
  • Journal Article Harrison JA, Maranger RJ, Alexander RB, Giblin AE, Jacinthe P-A, Mayorga E, Seitzinger SP, Sobota DJ, Wollheim WM. The regional and global significance of nitrogen removal in lakes and reservoirs. Biogeochemistry 2009;93(1-2):143-157. R833261 (2008)
    R833261 (2009)
    R833261 (2010)
    R833261 (Final)
    R834187 (2010)
    R834187 (2011)
    R834187 (2012)
    R834187 (2013)
    R834187 (Final)
  • Abstract: Springer-Abstract
    Exit
  • Other: USGS-Abstract
  • Progress and Final Reports:

    Original Abstract
  • 2008 Progress Report
  • 2010 Progress Report
  • Final Report
  • Top of Page

    The perspectives, information and conclusions conveyed in research project abstracts, progress reports, final reports, journal abstracts and journal publications convey the viewpoints of the principal investigator and may not represent the views and policies of ORD and EPA. Conclusions drawn by the principal investigators have not been reviewed by the Agency.

    Project Research Results

    • Final Report
    • 2010 Progress Report
    • 2008 Progress Report
    • Original Abstract
    28 publications for this project
    13 journal articles for this project

    Site Navigation

    • Grantee Research Project Results Home
    • Grantee Research Project Results Basic Search
    • Grantee Research Project Results Advanced Search
    • Grantee Research Project Results Fielded Search
    • Publication search
    • EPA Regional Search

    Related Information

    • Search Help
    • About our data collection
    • Research Grants
    • P3: Student Design Competition
    • Research Fellowships
    • Small Business Innovation Research (SBIR)
    Contact Us to ask a question, provide feedback, or report a problem.
    Last updated April 28, 2023
    United States Environmental Protection Agency

    Discover.

    • Accessibility
    • Budget & Performance
    • Contracting
    • EPA www Web Snapshot
    • Grants
    • No FEAR Act Data
    • Plain Writing
    • Privacy
    • Privacy and Security Notice

    Connect.

    • Data.gov
    • Inspector General
    • Jobs
    • Newsroom
    • Open Government
    • Regulations.gov
    • Subscribe
    • USA.gov
    • White House

    Ask.

    • Contact EPA
    • EPA Disclaimers
    • Hotlines
    • FOIA Requests
    • Frequent Questions

    Follow.