U.S. flag

An official website of the United States government

Here’s how you know

Dot gov

Official websites use .gov
A .gov website belongs to an official government organization in the United States.

HTTPS

Secure .gov websites use HTTPS
A lock (LockA locked padlock) or https:// means you have safely connected to the .gov website. Share sensitive information only on official, secure websites.

  • Environmental Topics
  • Laws & Regulations
  • Report a Violation
  • About EPA
Contact Us

Grantee Research Project Results

2010 Progress Report: Bioavailability of Metallic Nanoparticles and Heavy Metals in Landfills

EPA Grant Number: R833893
Title: Bioavailability of Metallic Nanoparticles and Heavy Metals in Landfills
Investigators: Hu, Zhiqiang , Wall, Judy D. , Elias, Dwayne A.
Institution: University of Missouri - Columbia
EPA Project Officer: Aja, Hayley
Project Period: April 1, 2009 through March 31, 2012
Project Period Covered by this Report: April 1, 2010 through March 31,2011
Project Amount: $399,262
RFA: Exploratory Research: Nanotechnology Research Grants Investigating Fate, Transport, Transformation, and Exposure of Engineered Nanomaterials: A Joint Research Solicitation - EPA, NSF, & DOE (2007) RFA Text |  Recipients Lists
Research Category: Nanotechnology , Safer Chemicals

Objective:

The objectives of this research are to determine bioavailability of nanoparticles and heavy metal species in bioreactor landfills as compared to traditional municipal solid waste landfills; and to elucidate the mechanisms governing bioavailability as well as the mode of antimicrobial action by nanoparticles. In order to accomplish these objectives, three hypotheses will be tested: 1) nanoparticles that can leach into the water from landfill runoff are bioavailable; 2) nanoparticles enhance heavy metal bioavailability and leachate toxicity; and 3) the bioavailability of nanoparticles and heavy metals is higher in bioreactor landfills than in traditional landfills.

Progress Summary:

In this report, we summarize the efforts and results achieved in the following three areas: 1) lab-scale landfill reactor operation and performance; 2) Fate of silver nanoparticles in the landfill bioreactor; and 3) determination of the changes of microbial community structure and species abundance in lab-scale landfill bioreactors.
 
1. Lab-scale landfill reactor operation and performance. Fresh municipal solid waste (MSW) was obtained from the Columbia Sanitary Landfill in Columbia, MO. The solid waste samples were separated into different types of materials and shredded into 2-5 cm pieces, then well mixed before they were transferred to 9-L glass bottles. The composition of the solid was as follows in wet weight percent: metal 0.9%, paper 14.1%, brick 17.7%, wood and shredding 4.8%, soil 36.7%, organic (mainly food debris) 15.6%, and plastic bags 10.2%. A total of 6 bench-scale landfill bioreactors of equal volume were originally set up for duplicate testing (Figure 1). Each glass bottle had a diameter of 20 cm and a height of 30 cm. In each bioreactor, a 20-mm thick layer of gravel (average gravel particle size = 10 mm) was placed at the bottom to simulate the leachate collection layer and avoid clogging problems in leachate pipes. Then 2.925 kg (air-dried weight) of well-mixed MSW was loaded onto the gravel layer and manually compacted. To expedite biodegradation, 1000 ml portion of anaerobic sludge with a dry solids content of around 7% was taken from the Columbia Wastewater Treatment Plant in Columbia, MO, and added to each bioreactor for microbial seeding. The silver concentration of this sludge was measured at around 0.23 mg/L, so the final silver concentration contributed from the sludge would be 0.078 mg silver/ kg solids. A total of 387 mL liquid (deionized water or nanosilver suspension) was added gradually and evenly on top of solids over a 5-min period to reach the solids of all bioreactors was maintained at the same level, which was measured to be about 40% gravimetrically (oven-dried solid samples at 105oC for 24 hours). A 20 mm-thick gravel layer was finally placed on top of solids. The bioreactors were sealed and placed in a constant temperature room at 37 oC. Leachates collected from a sealed 1 L Erlenmeyer flask were recirculated once (lasting for a total of 35 minutes) everyday using a peristaltic pump at a target leachate recirculation ratio of 5 waste volume.
 
Figure 1
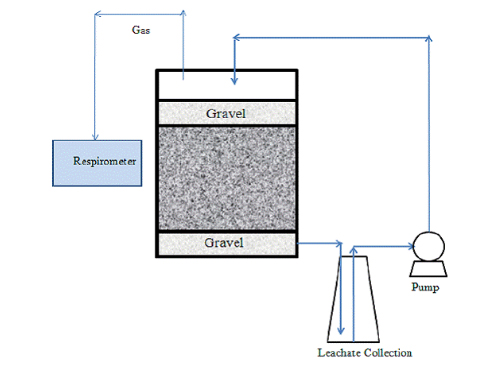
Figure 1. A schematic of lab-scale landfill reactor with leachate recirculation
 
The cumulative gas volume from each bioreactor was recorded once every ten minutes by the AER-200 Respirometer (CHALLENGE Technology, AK) during the period of study. Detailed contents of hydrogen, carbon dioxide and methane in the biogas were analyzed later by gas chromatography (GC, Shimadzu 2014) with ShinCarbon ST 80/100 Column (Restek, US) as separation column and helium gas as carrier gas. An aliquot (20 ml) of the leachates was taken from each bioreactor biweekly for chemical analysis. DI water (20 mL) was then added back to the leachates so that the chemical concentrations in leachate could be comparable without the change of total liquid volume.
 
Major findings: From day 22 to day 42, the average gas production rates of the control bioreactor and the bioreactor treated with AgNPs at 1 mg/kg solids were 1262 and 1260 ml/day, respectively. In contrast, the average gas production rate was only 348 ml/day (lower by a factor of 3-4) in the bioreactor treated with AgNPs at 10 mg/kg. From day 43 onwards, there was no substantial increase of accumulative gas volume in this bioreactor. For comparison, three more phases (Phases II to IV) were identified in the control bioreactors and that treated with 1 mg AgNPs/kg during the solids stabilization process (Figure 2). Phase II lasted about a month (from day 43 to day 70), during which a much slow increase of biogas production was observed (Figure 1). In the next phase (Phase III from day 71 to day 130), the gas production rates of the control bioreactor and the one treated with AgNPs at 1 mg/kg increased rapidly to 1253 ml/day and 1100 ml/day respectively. After about 130 days of waste degradation, biogas production in all bioreactors was almost negligible. At the end of this study (day 260), the total cumulated gas volumes for the control, 1 mg AgNPs/kg and the 10 mg AgNPs/kg group, were about 88,564 ml, 80,655 ml and 17,047 ml, respectively. Therefore, the gas production rate and cumulative gas volume were significantly inhibited in the bioreactors after the treatment with 10 mg AgNPs/kg solids.
 
The major components of biogas in landfill are CO2, CH4, and a small amount of H2 and N2 (Pohland, 1985). In all bioreactors during Phase I (before day 42), carbon dioxide was determined to be the dominant gas component (close to 100%). In the phase II and III, the methane concentration in the control and the bioreactor treated with AgNPs at 1 mg Ag/kg solids were almost the same, which were in the range of 40-50%. In the last phase (Phase IV, after day 130), there was negligible biogas production in both the control and the treatment with AgNPs at 1 mg/kg solids and only carbon dioxide was detected in the gas samples, indicating the completion of methanogenesis. For comparison, mainly CO2 was detected in the first three stages in the bioreactor treated with AgNPs at 10 mg/kg solids. Coupled with the cumulative gas production profiles (Figure 2), the results indicated that methanogenesis was strongly inhibited in the bioreactor treated with AgNPs at 10 mg/kg.
 
Figure 2
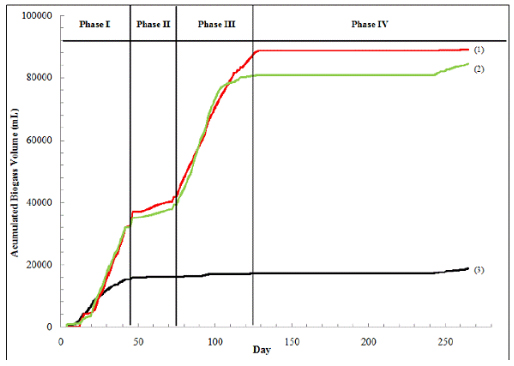
Figure 2. Cumulative biogas volume over time during the solids stabilization process in 9-L
bench-scale landfill bioreactors. Lines 1, 2, 3 represent cumulative gas volume in bioreactors
treated with no AgNPs (control), 1 mg AgNPs/kg, and 10mg AgNPs/kg respectively. Phase I, 
Transition and Acid Formation: Phase II, Hydrogentrophic Methane Fermentation: Phse III,
Acetoclastic Methane Fermantation: Phase IV, Final Maturation. 
 
2) Fate of silver nanoparticles in the landfill bioreactor
As shown in Figure 3, the total silver concentration in the leachate sample was 14.8 mg/L right after the nanosilver dose at the level of 10 mg AgNPs/kg. Based on mass balance calculation, about 20-30% of total silver was in the leachate at the beginning. The total silver in the leachate generally decreased to below 2 mg/L after 112 days. The total silver concentrations in leachates from the groups of control and 1 mg AgNPs/kg were both maintained at about 1.5 mg/L throughout the study indicating solid wastes including digested sludge contain silver in the amount much higher than 1 mg Ag/kg added to the bioreactor. From day 140 to the end of our experiments, the total silver concentrations in leachates from the treatments of control, 1 mg AgNPs/kg and 10 mg AgNPs/kg were 0.70 ± 0.05 mg/L, 0.65 ± 0.03 mg/L and 1.46 ± 0.25 mg/L respectively. The results indicate that silver may be precipitated or absorbed onto solids.
 
Figure 3
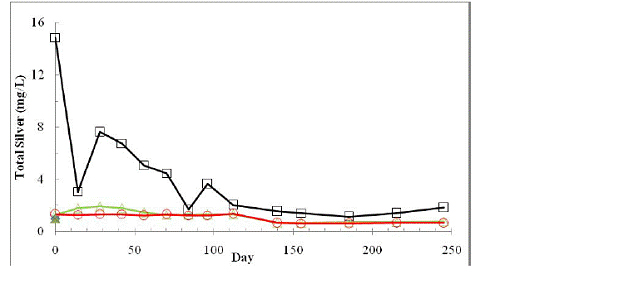
Figure 3.  The change of the  total silver concentrations in leachates of landfill bioreactors
treated with 0 AgNPs (control)(O), 1 mg AgNPs/kg (∆), and 10mg AgNPs/kg (□).
 
3) Changes of methanogenic microbial community structure and abundance
DNA extraction and real-time qPCR were conducted at predetermined times. Total genomic DNA was extracted from 1.5 ml of leachates from each bioreactor. The qPCR internal standards were prepared from the 16S rRNA gene clones of known methanogenic species. For instance, to quantify the populations of Methanosaeta and Methanosarcina, a 25-μL PCR contained 0.75 μL (each) of the corresponding forward primer and reverse primers (stock concentration of 20 μM), 12.5 μL of SYBR Green PCR master Mix (Applied Biosystems, CA), 6 μL of PCR water, and 5 μL sample DNA. The qPCR reactions were performed starting at 50°C for 2 min, followed by an initial denaturation at 95°C for 10 min, and then 40 cycles of 95°C for 30 s, 60°C for 30 s, and 72°C for 45s. The dissociation step at 95°C for 15 s and 60°C for 1 min was added at the end to check the specificity of the PCR results.
 
Corresponding to the cumulative gas production profiles, the methanogenic population (Figure 4) and structure of methanogens (Figure 5) also changed during the solids stabilization process. At the beginning of landfill operations, acetoclastic methanogens (Methanosaeta and Methanosarcina) were dominant (80%) in all bioreactors. This ratio represented the methanogenic population in the seed anaerobic sludge from the wastewater treatment plant (data not shown). Just after 14 days of operations, the hydrogenotrophic methanogens (Methanobacteriales and Methanomicrobiales) took the advantage over the acetoclastic methanogens in the control and the 1 mg AgNPs/kg groups, where the fraction of Methanobacteriales was higher than 90%. In contrast, in the bioreactor treated with AgNPs at 10 mg/kg solids, the acetoclastic methanogens Methanosaeta still represented more than 40% of total methanogens, perhaps suffering the lower growth rate of hydrogenotrophic methanogens.
 
In Phase II and Phase III, hydrogenotrophic methanogens represented 80% to 96% of total methanogens in the bioreactor treated with 10 mg AgNPs/kg. Slowly growing acetoclastic methanogens such as Methanosaeta began to increase. The percent of Methanosaeta population reached the highest on day 100, 130, and 200 for the groups of control, 1 mg AgNPs/kg, and 10 mg AgNPs/kg, respectively (Figure 5). In phase IV (after day 130), as the acetate was almost exhausted in the groups of control and 1 mg AgNPs/kg treatment, the fraction of acetoclastic methanogens decreased.
 
Figure 4
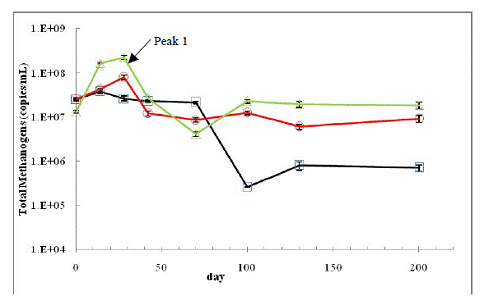
Figure 4.  The change of the total methanogenic gene copies in the lechates of 
bioreactors treated with 0 AgNPs (control), (Ο), 1mg AgNPs/kg (Δ), and 10 mg AgNPs/kg (□).
Erorr bars represent one standard deviation of triplicate samples. 
 
Figure 5
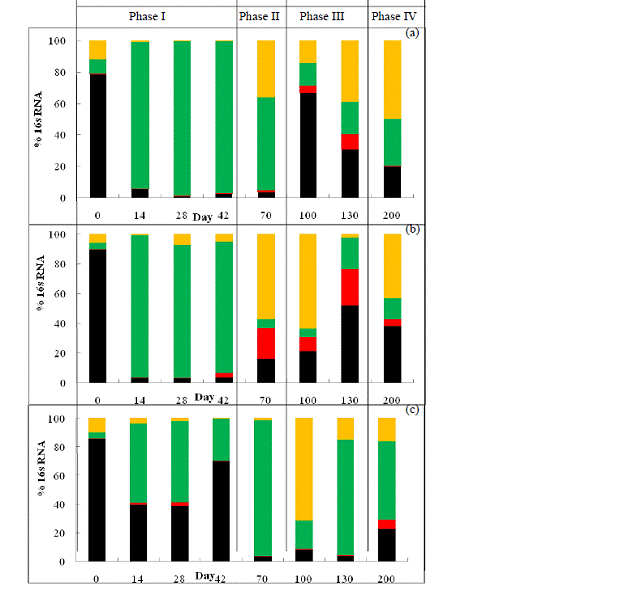
Figure 5. The changes of methanogenic composition (in relative 16s rRNA
gene copies) in landfill bioreactors treated with zero AgNPs (a), 1mg AgNPs/kg
(b), and 10 mg AgNPs/kg (c). Acetoclastic methanogens: Black, Methanosaeta;,
Red, Methanosarcina; Hydrogenotrophic methanogens: Green, Methanobacteriales; 
Yellow, Methanomicrobiales.

Future Activities:

New batch experiments are run at mesophilic temperature conditions to evaluate the fate and toxicity of nanosilver in landfill systems and compare the difference of anaerobic digestion in landfills between the groups treated with nanosilver and its counterpart bulk silver.


Journal Articles on this Report : 1 Displayed | Download in RIS Format

Publications Views
Other project views: All 4 publications 4 publications in selected types All 4 journal articles
Publications
Type Citation Project Document Sources
Journal Article Yang Y, Chen Q, Wall JD, Hu ZQ. Potential nanosilver impact on anaerobic digestion at moderate silver concentrations. Water Research 2012;46(4):1176-1184. R833893 (2010)
R833893 (Final)
  • Abstract from PubMed
  • Full-text: ScienceDirect-Full Text HTML
    Exit
  • Other: ScienceDirect-PDF
    Exit
  • Supplemental Keywords:

    bioavailability, cellular, heavy metals, analytical, absorption, adsorption, bioaccumulation, gene expression, growth, mechanisms, metabolism, toxins, nanotechnology, microbiology, biotechnology

    Progress and Final Reports:

    Original Abstract
  • 2009 Progress Report
  • Final Report
  • Top of Page

    The perspectives, information and conclusions conveyed in research project abstracts, progress reports, final reports, journal abstracts and journal publications convey the viewpoints of the principal investigator and may not represent the views and policies of ORD and EPA. Conclusions drawn by the principal investigators have not been reviewed by the Agency.

    Project Research Results

    • Final Report
    • 2009 Progress Report
    • Original Abstract
    4 publications for this project
    4 journal articles for this project

    Site Navigation

    • Grantee Research Project Results Home
    • Grantee Research Project Results Basic Search
    • Grantee Research Project Results Advanced Search
    • Grantee Research Project Results Fielded Search
    • Publication search
    • EPA Regional Search

    Related Information

    • Search Help
    • About our data collection
    • Research Grants
    • P3: Student Design Competition
    • Research Fellowships
    • Small Business Innovation Research (SBIR)
    Contact Us to ask a question, provide feedback, or report a problem.
    Last updated April 28, 2023
    United States Environmental Protection Agency

    Discover.

    • Accessibility
    • Budget & Performance
    • Contracting
    • EPA www Web Snapshot
    • Grants
    • No FEAR Act Data
    • Plain Writing
    • Privacy
    • Privacy and Security Notice

    Connect.

    • Data.gov
    • Inspector General
    • Jobs
    • Newsroom
    • Open Government
    • Regulations.gov
    • Subscribe
    • USA.gov
    • White House

    Ask.

    • Contact EPA
    • EPA Disclaimers
    • Hotlines
    • FOIA Requests
    • Frequent Questions

    Follow.