
Grantee Research Project Results
Final Report: Statistical Models for Estimating the Health Impact of Air Quality Regulations
EPA Grant Number: R833622Title: Statistical Models for Estimating the Health Impact of Air Quality Regulations
Investigators: Dominici, Francesca , Samet, Jonathan M. , White, Ronald H.
Institution: Harvard University
EPA Project Officer: Hahn, Intaek
Project Period: July 1, 2007 through September 30, 2010 (Extended to September 30, 2011)
Project Amount: $500,000
RFA: Development of Environmental Health Outcome Indicators (2006) RFA Text | Recipients Lists
Research Category: Air Quality and Air Toxics
Objective:
In this proposal, we will develop statistical models for estimating consequences of regulation for environmental health outcome indicators, such as the number of premature deaths or morbidity events prevented by regulation. The specific aims of this proposal are to:
A.1: Assess the chronology of the implementation of the NAAQS for PM10 and the corresponding attainment and non-attainment status for all of the U.S. counties for the period 1987-2006.
A.2: Develop exposure indicators: estimates of the association between regulation and longer term trends in PM. Specifically, we propose to develop Bayesian hierarchical models for time series data that use all of the available air pollution data to:
- A.2.1: estimate longer term national, regional and county-specific trends in PM10 for the period 1987-2006, and in fine and coarse PM for the period 1999-2006.
- A.2.2: estimate the association between county-specific trends in PM10 and nonattainment status accounting for changes in population demographics, industrial activities, and energy demand.
A.3: Develop outcome indicators: estimates of the associations between longer term exposure to PM and human health on a national scale. More specifically, we plan to develop methods for estimating:
- A.3.1: cross-sectional associations between longer term exposure to PM on mortality and morbidity accounting for individual-level risk factors and area-level confounders.
- A.3.2: month-to-month variations in mortality rates and average PM concentrations over the previous year. These methods will provide evidence as to whether counties having steeper decline in PM levels relative to the PM national trend will also have steeper declines in mortality rates relative to the mortality national trend.
A.4: Develop environmental health outcome indicators: estimates of the number of adverse health events prevented by regulation. Specifically, we plan to develop a Bayesian statistical approach for integrating Aims 1-3. We will estimate the percentage decrease in adverse health events prevented by regulation and quantify its uncertainty. We plan to monitor this environmental health outcome indicator over time on a national scale.
Summary/Accomplishments (Outputs/Outcomes):
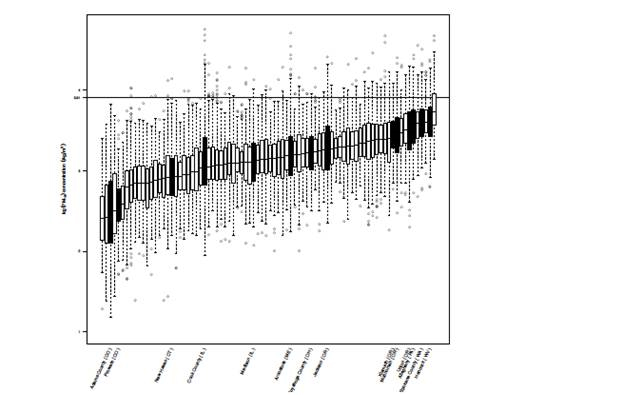
Figure 3. Boxplots of country-specific log monthly PM1.0 concentrations for countries in group
A initially in attainment with the NAAQQS (white) or unclassifiable (grey) and Ä (black).
Gropu A includes countries that in 1991 were designated as an attainment (N=6) or
unclassified (N=62) with respect to the 1987 NAAQS and that maintained their status
through 2006. Group A includes countries that in 1991 were designated as nonattainment
with respect to the 1987 NAAQS (N=14) and that were redisgnated as in attainment prior
to 2007. The horizontal lines corresponds to the logarithm of the PM1.0 National Air
Quality Standards for 1097. Countries are ranked from the smallest to the largest
median of PM1.0 values across the time period.
1. Illustration of ß1, ß2 and Potential Confounders
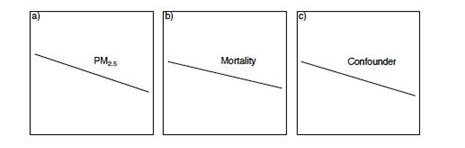
Figure 1. Illustration of ß2 and potential cofounders. Solid lines denote
national average of time. ß2 measures the associatin between the PM2.5
national trend (a) and the national trend in mortality rates (b). The estimations
of ß2 can be biased by a variable that varies slowly over time nationally as
PM2.5 and mortality (c), suchn as e.g. smoking prevalence.
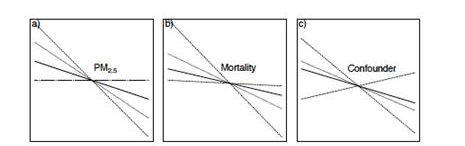
Figure 2. Illustration of ß2 and potential confounders. Solid lines denote
national averager values over time, dotted and dashed lines depict
location-specific values for threee example locations over time. ß1 meausres
whether mortality rates decline faster (slower) than the national average (b)
in locations where PM2.5 also declines faster (slower) than the national
average (a). Confounders are variables that change locally in a similar fashion
as both mortality and PM2.5 (c).
| Region | Monitoring stations | Months with avaiable PM2.5 data | Average PM2.5 level (µg/m3] | Medicare enrollees | Deaths |
|---|---|---|---|---|---|
| West | 96 | 597070 | 8.911.515.1 | 616413,28937,556 | 109930287270 |
| Center | 200 | 577070 | 9.510.612.0 | 743214,74629,073 | 81918083474 |
| East | 518 | 687070 | 12.613.915.1 | 702314,20727,688 | 140625395451 |
| U.S. | 814 | 627070 | 10.813.014.7 | 695714,50229,058 | 122025395120 |
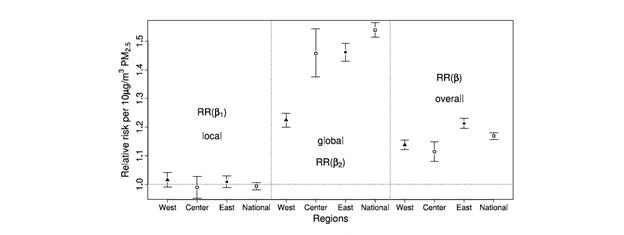
Figure 4. Estimated relative risk of dying in a given month per 10 µg/m3 increase in average
PM2.5 concentrations during the previous year. Relative risk (RR) estimates based on the local
corfficient ß1, the global coefficient ß2, and the overall coefficient ß are shown wiht 95% confidence
intervals.
| Source | Data | Spacial resolution | Year(s) |
|---|---|---|---|
| EPA | Preregulation PM10 †, ‡, | Monitor | 1987-1989, 199-2001 |
| preregulation O3 †, ‡ | |||
| postregulation PM10. | |||
| postregulation O3 | |||
| US Federal Register | PM10 attainment status | Country | 1991 |
| Center for Medicare | All-cause mortality, age †, ‡, | Individual beneficiary | 2001 |
| and Medicaid Services | sex †, ‡,, race/ethnicity ‡ | ||
| Centers for Disease | Smoking rate †, ‡, | Country | 2000 |
| Control and Prevention | |||
| Behavioral Risk | |||
| Factor Surveillance | |||
| System | |||
| Census | Population †, ‡,, %curban †, ‡,, | Country | 2000 |
| 5-year migration †, ‡, | |||
| median income †, ‡, %high | |||
| School grad †, ‡, | |||
| %female†, ‡, race/ethnicity† | |||
| † denotes variables inclouded as covariates int he model for air pollution ‡ denotes variables included as covariants in the model for mortality | |||
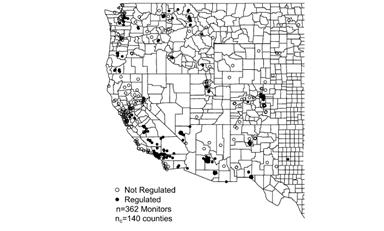
Figure 1. Map of the monitor locations for PM10 adn O3
used to estimate the causal effects of the CAAA
- In Rava et al. 2010, we found statistically significant evidence of variability across counties in trends of PM10 concentrations. We also found strong evidence that counties transitioning from nonattainment to attainment status during the period 1987-2007 experienced a sharper decline in PM10 when compared to counties that were always in attainment.
- In Greven et al. 2012, we developed new statistical methods to estimate the long-term effects of PM on mortality. We applied our methods to the Medicare Cohort Air Pollution Study (MCAPS), which includes individual-level information on time of death and age on a population of 18.2 million for the period 2000-2006. We found that associations between local trends in air pollution and local trends in life expectancy were not significant. Results based on the global coefficient (that is the association between national trend in PM and national trend in LE) indicate that a 10 mg/m3 reduction in the yearly national average of PM2.5 is associated with a significant increase in life expectancy of more than three years.
- In Zigler et al. 2012, we developed innovative methods for causal inference to estimate the causal effects of the 1991 nonattainment designations on pollution and health. Here, we focus on 3-year average ambient concentration of PM10 and O3 during the period 1999–2001 and on all-cause mortality in 2001 among Medicare beneficiaries living in the vicinity of an air pollution monitor. The resulting data set consists of ambient pollution measurements at 362 pollution monitor locations (of which 200 lie in regulated counties), county-level characteristics on 140 counties, and basic characteristics and mortality information for 6,926,338 Medicare beneficiaries. We found that the 1991 nonattainment designations for PM10 did causally reduce Medicare mortality in 2001, and that there are important causal pathways through which this effect occurred without affecting average ambient concentrations of PM10 or O3 during 1999–2001. More specifically, we found that the estimated overall average causal effect of the regulation program on mortality was 1.76 fewer deaths per 1,000 Medicare beneficiaries after adjusting for the aforementioned covariates with a Poisson regression mode.
Conclusions:
Assessing the public health consequences of air quality interventions is of paramount importance. In this grant, we have developed new methods and conducted large epidemiological studies to estimate the public health benefits of air pollution regulatory actions. We estimated the effects of the regulatory actions on ambient air pollution levels (Rava et al. 2010), on health (Greven et al. 2011), and the effect of the regulatory action on health that is associated and dissociated with the effects of regulatory actions on air pollution (Zigler et al. 2012). Overall, the levels of air pollution are continuing to decline and this is mostly due to air pollution control polices. However, even at the smaller levels, ambient pollution continues to adversely affect public health.
Journal Articles on this Report : 21 Displayed | Download in RIS Format
| Other project views: | All 23 publications | 23 publications in selected types | All 23 journal articles |
|---|
| Type | Citation | ||
|---|---|---|---|
|
|
Barr CD, Dominici F. Cap and trade legislation for greenhouse gas emissions: public health benefits from air pollution mitigation. JAMA-Journal of the American Medical Association 2010;303(1):69-70. |
R833622 (Final) R832417 (Final) R832417C001 (Final) |
Exit |
|
|
Barr CD, Diez DM, Wang Y, Dominici F, Samet JM. Comprehensive smoking bans and acute myocardial infarction among Medicare enrollees in 387 US counties:1999–2008. American Journal of Epidemiology 2012;176(7):642-648. |
R833622 (Final) R832417 (Final) R834798 (2013) R834798 (2014) R834798 (Final) R834894 (2012) R834894 (2013) |
Exit Exit Exit |
|
|
Bell ML, Ebisu K, Peng RD, Walker J, Samet JM, Zeger SL, Dominici F. Seasonal and regional short-term effects of fine particles on hospital admissions in 202 US counties, 1999-2005. American Journal of Epidemiology 2008;168(11):1301-1310. |
R833622 (Final) R832417 (2008) R832417 (Final) R832417C001 (2009) R832417C001 (Final) |
Exit Exit |
|
|
Bobb JF, Dominici F, Peng RD. A Bayesian model averaging approach for estimating the relative risk of mortality associated with heat waves in 105 U.S. cities. Biometrics 2011;67(4):1605-1616. |
R833622 (Final) R832416 (Final) R832417 (Final) |
Exit |
|
|
Chang HH, Peng RD, Dominici F. Estimating the acute health effects of coarse particulate matter accounting for exposure measurement error. Biostatistics 2011;12(4):637-652. |
R833622 (Final) R832416 (Final) R832417 (Final) R832417C001 (Final) |
Exit Exit Exit |
|
|
Greven S, Dominici F, Zeger S. An approach to the estimation of chronic air pollution effects using spatio-temporal information. Journal of the American Statistical Association 2011;106(494):396-406. |
R833622 (2009) R833622 (Final) R832416 (Final) R832417 (Final) R834798 (2013) R834798 (2014) R834798 (Final) R834894 (2012) R834894 (2013) |
Exit Exit |
|
|
Janes H, Dominici F, Zeger S. Partitioning evidence of association between air pollution and mortality. Epidemiology 2007;18(4):427-428. |
R833622 (2008) R833622 (2009) R833622 (Final) R832417 (2008) R832417 (Final) R832417C001 (2008) R832417C001 (2009) R832417C001 (Final) |
Exit Exit Exit |
|
|
Janes H, Dominici F, Zeger SL. Trends in air pollution and mortality: an approach to the assessment of unmeasured confounding. Epidemiology 2007;18(4):416-423. |
R833622 (Final) R830548 (Final) R832417 (Final) R832417C001 (2006) R832417C001 (2007) R832417C001 (2008) R832417C001 (2009) R832417C001 (Final) |
Exit Exit Exit |
|
|
Janes H, Dominici F, Zeger S. On quantifying the magnitude of confounding. Biostatistics 2010;11(3):572-582. |
R833622 (Final) R832417 (Final) R832417C001 (Final) |
Exit Exit Exit |
|
|
Peng RD, Chang HH, Bell ML, McDermott A, Zeger SL, Samet JM, Dominici F. Coarse particulate matter air pollution and hospital admissions for cardiovascular and respiratory diseases among Medicare patients. JAMA-Journal of the American Medical Association 2008;299(18):2172-2179. |
R833622 (2008) R833622 (2009) R833622 (Final) R832417 (2008) R832417 (Final) R832417C001 (2008) R832417C001 (2009) R832417C001 (Final) |
Exit Exit Exit |
|
|
Peng RD, Dominici F, Welty LJ. A Bayesian hierarchical distributed lag model for estimating the time course of risk of hospitalization associated with particulate matter air pollution. Journal of the Royal Statistical Society Series C--Applied Statistics 2009;58(1):3-24. |
R833622 (Final) R832417 (2008) R832417 (Final) R832417C001 (2009) R832417C001 (Final) |
Exit Exit |
|
|
Peng RD, Bell ML, Geyh AS, McDermott A, Zeger SL, Samet JM, Dominici F. Emergency admissions for cardiovascular and respiratory diseases and the chemical composition of fine particle air pollution. Environmental Health Perspectives 2009;117(6):957-963. |
R833622 (Final) R832417 (Final) R832417C001 (2009) R832417C001 (Final) R833863 (2009) R833863 (Final) |
|
|
|
Peng RD, Bobb JF, Tebaldi C, McDaniel L, Bell ML, Dominici F. Toward a quantitative estimate of future heat wave mortality under global climate change. Environmental Health Perspectives 2011;119(5):701-706. |
R833622 (Final) R832417 (Final) |
|
|
|
Rava M, White RH, Dominici F. Does attainment status for the PM10 National Air Ambient Quality Standard change the trend in ambient levels of particulate matter? Air Quality, Atmosphere & Health 2011;4(2):133-143. |
R833622 (2009) R833622 (Final) R832417 (Final) R832417C001 (Final) |
Exit Exit |
|
|
Venturini S, Dominici F, Parmigiani G. Generalized quantile treatment effect: a flexible Bayesian approach using quantile ratio smoothing. Bayesian Analysis 2015;10(3):523-552. |
R833622 (Final) |
Exit Exit Exit |
|
|
Wang C, Parmigiani G, Dominici F. Bayesian effect estimation accounting for adjustment uncertainty. Biometrics 2012;68(3):661-671. |
R833622 (Final) R832416 (Final) R832417 (Final) R834798 (2012) R834798 (2013) R834798 (2014) R834798 (Final) R834798C005 (2012) R834798C005 (2013) R834798C005 (Final) R834894 (2012) R834894 (2013) |
Exit Exit Exit |
|
|
Welty LJ, Peng RD, Zeger SL, Dominici F. Bayesian distributed lag models: estimating effects of particulate matter air pollution on daily mortality. Biometrics 2009;65(1):282-291. |
R833622 (Final) R832417 (2008) R832417 (Final) R832417C001 (2009) R832417C001 (Final) |
Exit Exit |
|
|
Zeger SL, Dominici F, McDermott A, Samet JM. Mortality in the Medicare population and chronic exposure to fine particulate air pollution in urban centers (2000–2005). Environmental Health Perspectives 2008;116(12):1614-1619. |
R833622 (2008) R833622 (2009) R833622 (Final) R832417 (2008) R832417 (2009) R832417 (Final) R832417C001 (2009) R832417C001 (Final) |
|
|
|
Zhou Y, Dominici F, Louis TA. A smoothing approach for masking spatial data. Annals of Applied Statistics 2010;4(3):1451-1475. |
R833622 (Final) R830548 (Final) |
Exit Exit Exit |
|
|
Zigler CM, Dominici F, Wang Y. Estimating causal effects of air quality regulations using principal stratification for spatially correlated multivariate intermediate outcomes. Biostatistics 2012;13(2):289-302. |
R833622 (Final) R832417 (Final) R834798 (2012) R834798 (2013) R834798 (2014) R834798C005 (2012) R834798C005 (2013) R834894 (2012) R834894 (2013) |
Exit Exit Exit |
|
|
Zigler CM, Belin TR. A Bayesian approach to improved estimation of causal effect predictiveness for a principal surrogate endpoint. Biometrics 2012;68(3):922-932. |
R833622 (Final) |
Exit |
Supplemental Keywords:
Air pollution interventions, confounding, mortality, Medicare;Progress and Final Reports:
Original AbstractThe perspectives, information and conclusions conveyed in research project abstracts, progress reports, final reports, journal abstracts and journal publications convey the viewpoints of the principal investigator and may not represent the views and policies of ORD and EPA. Conclusions drawn by the principal investigators have not been reviewed by the Agency.