U.S. flag

An official website of the United States government

Here’s how you know

Dot gov

Official websites use .gov
A .gov website belongs to an official government organization in the United States.

HTTPS

Secure .gov websites use HTTPS
A lock (LockA locked padlock) or https:// means you have safely connected to the .gov website. Share sensitive information only on official, secure websites.

  • Environmental Topics
  • Laws & Regulations
  • Report a Violation
  • About EPA
Contact Us

Grantee Research Project Results

Final Report: Project 4 -- Transport and Fate Particles

EPA Grant Number: R832414C004
Subproject: this is subproject number 004 , established and managed by the Center Director under grant R832414
(EPA does not fund or establish subprojects; EPA awards and manages the overall grant for this center).

Center: UC Davis Center for Children's Environmental Health and Disease Prevention
Center Director: Van de Water, Judith
Title: Project 4 -- Transport and Fate Particles
Investigators: Wilson, Dennis , Louie, Angelique
Institution: University of California - Davis
EPA Project Officer: Chung, Serena
Project Period: October 1, 2005 through September 30, 2010 (Extended to September 30, 2011)
RFA: Particulate Matter Research Centers (2004) RFA Text |  Recipients Lists
Research Category: Human Health , Air

Objective:

Specific Aim 1: Characterize time course and distribution of circulating particulates in vivo.
 
Specific Aim 2: To compare the anatomic site of particulate accumulation in tissues with organ distribution as determined by microimaging techniques.
 
Specific aim 3: To evaluate potential mechanisms of PM transport across epithelial and endothelial barriers.

Summary/Accomplishments (Outputs/Outcomes):

The first year we developed methods to determine the fate of deposited model ultrafine particles in the rodent model. To summarize, polystyrene nanoparticles were modified to carry radioactive tracers and these were introduced to rats by insufflation. Two types of radiotracers were used: In-111 for biodistribution studies using gamma counting of harvested organs, and Cu-64 for Positron Emission Tomography (PET) imaging of the model ultrafine particles. Overall trends indicated that there is elevated accumulation of particles in the heart in the first 4 hours after exposure and that this elevation disappears by 24 hours. Larger particles (one micron) had less movement out of the lung than smaller particles (78nm).
 
We overcame a number of technical challenges to perform this work. One of the first challenges was coupling radioactive labels to the particles. We originally proposed to couple derivatized chelators to the particles through amine functional groups at the surface of the particles and then insert the radioactive cations. This uses standard conjugation chemistry that we have used extensively in other systems. However, nanoparticles proved to be recalcitrant to coupling by this method and the degree of labeling was low (~6%). We explored a number of synthetic protocols and finally have been able to increase the degree of labeling to 45% using the scheme below. It was unclear why the nanoparticles were so resistant to labeling by the original method.
 
Molecules
 
The second technical challenge was training personnel to perform the insufflation technique on rats. The insufflation technique uses a microsprayer device that delivers a fine mist solution to the lungs of the animals when performed properly. Consistently delivering material to the lung required many hours of training. Training was initially performed using fluorescent material and whole animal optical imaging to prevent risk of exposure to radioactivity while personnel were learning to perform the insufflation. Figure 1 shows and example of deposition to the lungs (right) and esophagus (left) dissected from a rat. While more consistent lung deposition was achieved over time, we were still unable to reliably avoid deposition to the esophagus. The studies shown below all use the insufflation method and therefore, the results are a bit confounded by variable, small amounts of esophageal deposition.
 
Figure 1. Insufflation with fluorescent dye.
Figure 1
 
With Cu-64 PET imaging (Figure 2) it was quite facile to distinguish esophageal deposition (below left), which appears as a three-dimensional tube, from trachael deposition (below right), which clearly shows deposition to both lobes of the lungs.
 
Figure 2. Insufflation technique with PET. Esophageal deposition (right) tracheal
(left).
Figure 2
 
Over time, esophageal deposition moved to the stomach and intestines as expected (Figure 3, 2 hr timepoint, below left), and tracheal deposition showed liver and kidney accumulation over time (4hr timepoints below right) with some movement through the GI tract, presumably from materials that was initially deposited in the esophagus or that had been swept out of lungs and trachea and swallowed through normal clearance mechanisms.
 
Figure 3. PET images 2 hours post administration.
Figure 3
 
These animals were also imaged by Computed Tomography for anatomical reference as shown in the sample below (coronal section, overlay PET (red)/CT (gray) showing lung deposition at time 0).
 
Figure 4. CT and PET Co-registered Image of Initial Tracheal Deposition of particles.
Figure 4
 
We continued to explore the utility of a mouse model using catheter deposition techniques such as instillation, we have found these to consistently deliver desired volumes to precise locations. In addition the smaller size of the mice it makes it more feasible to increase the number of animals imaged per study.
 
Using instillation as our new delivery method, we used PET to determine the deposition and translocation of 78nm 64Cu-labeled amine terminated polystyrene beads in the rat model. Figure 5 shows mucociliary clearance from the lungs into the GI tract in the rat over a 24 hour time period. Figure 6 shows a different translocation pattern of free copper in the rat over 24 hours verifying that the translocation and clearance shown in Figure 5 is from intact beads and not free copper. Figure 7 shows translocation of beads at 0 and 24 hours when beads are administered intraveneously. This was used to compare to Figure 5, which showed primarily mucociliary clearance to the GI after instillation. Intraveneous administration shows primarily liver and spleen uptake. Gamma counting was utilized ex vivo for bio-distribution verification after PET imaging. Further verification of label stability was determined in Figure 8 with beads incubated in both saline at pH 2 and plasma. These solutions were used to test stability in the stomach and blood, respectively. Over the 48 hour time period the labeled beads remain relatively stable, indicating that the signal shown in Figure 5 is mainly from intact beads and not free dissociating copper.
 
Figure 5. 64Cu-labeled amine terminated polystyrene bead translocation in the rat over a 24 hour time period. Beads are shown in lungs and GI tract.
Figure 5
 
Figure 6. Free copper translocation in the rat over a 24 hour time period. Free copper is shown in lungs, kidneys, liver and GI tract.
Figure 6
 
Figure 7. Intravenous administration of beads into the mouse model for comparison to lung bio-distribution. Liver and spleen uptake is shown.
Figure 7
 
Figure 7. Label stability over 48 hours in saline at pH 2 and plasma.
Figure 7
 
We also looked at differences in deposition using PET. Figure 9 shows deposition of polystyrene beads into the lungs vs. stomach. Dynamic imaging, a post image processing technique that can visualize particle movement, has also been implemented to follow translocation of beads over time. Figure 10 shows a still image of particles in the trachea and lungs in 2a and in lungs in 2b. These images were taken over the first hour upon instillation.
 
Figure 9. Verification of deposition of polystyrene beads in the mouse model with lung deposition on the left and stomach deposition on the right.
Figure 9
 
Figure 10. Dynamic imaging of beads in the rat model with the instillation during the scan. Panel a shows a still of movement in the trachea and lungs and Panel b shows lung region only. L = lungs, T = trachea.
Figure 10
 
Compromised Cardiovascular Animals: Do animals with pre-existing CV disease accumulate nanoparticles at lesions?
The bio-distribution and accumulation of particulates in compromised animals was also evaluated with an atherosclerosis injury model (ApoE) mouse. The instillation material was 78nm 64Cu-polystyrene and 35nm fluorescently labeled dextran coated iron oxide particles. Overall, PET imaging of the mouse demonstrated deposition of polystyrene particles into the lung and confocal imaging demonstrated transportation of dextran coated iron oxide particles to other organs. Fluorescence was seen in the descending thoracic aorta (Figure 11, left) and injured right carotid artery (Figure 11, right).
 
Figure 11. Fluorescence microscopy of aorta and carotid artery after imaging.
Figure 11
 
We also looked at accumulation in an injury model of atherosclerosis; the injury in this model was in the femoral artery. Uptake was shown both at the injury site and control site after 24 hours (yellow arrows). This injury model shown in Figure 12 was a clamp/10% FeCl3 injury to the right femoral artery (n=1).
 
Figure 12. PET/MRI of iron oxide (CLIO-cross linked iron oxide) uptake in an injury mouse at 24 hours. Yellow arrows show accumulation in both the injured and uninjured artery.
Figure 12
 
The injury model was repeated and the uptake was not observed. The apoE model was also used for injury and uptake was not visualized in plaques/vessels. This model is challenging because the plaque locations are near the lungs.
Signal from the lungs from the instillation particles can drown out plaque accumulation. Overall, we were not able to successfully observe repeated accumulation for these studies. Model development is ongoing work in our lab.
 
We also used PET to determine the deposition and translocation of 78nm 64Cu- labeled amine terminated polystyrene nanoparticles in both normal and asthmatic mice. Figure 13 shows the bio-distribution of particles in a normal mouse over 48 hours. Mucociliary clearance shows particles leaving the trachea and lungs and clearing primarily through the GI tract. This is supported by Figure 14, which shows quantitative measurements of particles in each organ using region of interest (ROI) analysis.
 
Figure 13. Bio-distribution of polystyrene nanoparticles over 48 hours using PET (n=4).
Figure 13
 
Figure 14. ROI analysis of bio-distribution over 48 hours in the normal mouse.
 
Figure 15
 
Figure 15. shows the bio-distribution of nanoparticles over 48 hours in an asthmatic mouse. These animals were available through Dr. Nick Kenyon at UC Davis.
 
Figure 15. Bio-distribution of nanoparticles over 48 hours in the asthmatic mouse
(n=7).
Figure 15
 
The bio-distribution differs from normal mice; uptake in the bladder and liver at 24 and 48 hour time points is shown; this was different than what was observed for the normal mouse model. We also tested the sensitivity of PET with a limit of detection experiment for the 64Cu labeled polystyrene nanoparticles; the results of this are shown in Figure 16.
 
Figure 16. Limit of detection for 64-Cu labeled polystyrene for the Focus 120 PET instrument. (R2=0.974)
Figure 16
 
For this experiment the limit of detection was 1.55E+10nps/mL for the given degree of radiolabeling (4.3E-18Ci/np) This value corresponds to ~0.01% of instilled dose (instilled dose = 1.24E+14nps/mL).
 
In the last year we focused on determining the effects of a co-mixture containing labeled (64Cu) polystyrene particles and PM2.5 (provided by Kent Pinkerton) on lung retention and transport in a normal mouse model. Ambient particles have been shown to cause a physiological response in the lung (increased inflammation, permeability, oxidative stress). We hypothesized that delivering ambient particles could induce these changes in the lung and we could observe differences in transport/retention with our current radiolabeled model of PM (polystyrene). We have focused on two PM2.5 concentrations: 50μg, and 500μg doses. The region of interest analysis of the PET images of the 50μg co- mixture dose is shown below in Figure 17.
 
Figure 17. Biodistribution of 50μg co-mixture dose over 48 hours in the normal mouse. Lung retention at 48 hours was 82.8%DD +/- 10 and significant (p<0.05) changes in secondary organ accumulation were shown in the bladder, liver and spleen (*). DD = deposited dose. For the 500μg dose similar retention and secondary organ accumulation was observed (Figure 18).
Figure 17
 
Figure 18. Biodistribution of 500μg dose over 48 hours. Lung retention at 48 hours was 79.7%DD +/- 12 and significant changes (p<0.05) were observed in the bladder, liver and spleen (*).
Figure 18
 
Comparing the lung retention with only labeled particles and both co-mixture doses we observed a decreasing trend over the 48 hour study period (Figure 19).
 
Figure 19. Lung retention over 48 hours for PS only and co-mixture doses (50μg and 500μg).
Figure 19
 
In addition to changes in secondary organ accumulation, we also observed potential lymphatic signal for both co-mixture doses (Figure 20).
 
Figure 20. Potential lymphatic signal after co-mixture delivery. Sites of accumulation are located near the mesenteric and inguinal lymph nodes.
Figure 20
 
To verify that the PM2.5 used for these studies is inducing the expected inflammation reported in the literature we looked at histological sections of the lungs for neutrophil content. (Work done by Laurel Plummer-Kent Pinkerton Lab) A dose-response relationship was observed for neutrophil and cellular influx in the lungs for animals exposed to the co-mixture dose; no inflammation was observed for controls.
 
Mechanisms of Endothelial and Epithelial transport using synthetic fluorescent and electron dense ultrafine particles.
 
The mechanism(s) of UFP translocation across cellular barriers remains unclear. We hypothesized that ultra fine particles can be internalized and transported across endothelial cell membranes using a caveolar transport mechanism. We examined particle- plasma membrane interactions in endothelial cell culture. To obtain consistent material sizes, we evaluated methods of resuspending laboratory generated iron oxide particles. Iron Oxide particles were generated in flame exhaust and particle size measured by SMPS. UFPs were deposited on filters and then resuspended in cell culture media. Particles were sonicated in suspension by either water bath or probe and measured by DLS before being used in treatments. Dynamic light scattering studies determined that water bath sonication did not adequately recapitulate the original size distribution while probe sonication recreated the synthesized particle distribution that averaged 0.1 mm. Human aortic endothelial cells (HAECs) were exposed to iron oxide particles (10 µg/ml solution) for 10, 30, 60 min and 4 hr. Fe2O3 treated HAECs were fixed in 2.5% gluteraldehyde and 2% paraformaldehyde and secondarily fixed in reduced osmium before being embedded for transition electron microscopy (Figure 1). At 30 min, iron oxide aggregates interacted with plasma membrane structures and were visible within vesicles close to caveolae. By 4 hr the electron dense particles were visible as aggregates in membrane bound vesicles stratified throughout the cells and on the basilar side of the endothelial cells. Intercellular junctions remained intact and paracellular transport was not evident.
 
Figure 1: Transmission electron microscopy of iron oxide particles in endothelial cells at 0.5 or 4 h post treatment. Note extrusion of PM to basal surface by 4 hours (arrowhead)
Figure 1
 
To confirm the caveolar transport process, we treated similar cultures with FITC conjugated silica particles. HAECs were exposed to manufactured silica particles labeled with FITC (10 µg/ml) for 30 min and 4 h. Fluorescence immunostaining with was used for caveolin-1 colocalization by confocal microscopy. Treaed cell culture monolayers were stained with Caveolin-1 mouse monoclonal (R&D) and localized with anti-mouse Alexa Fluor 555 (Molecular Probes). Caveolin-1 was predominantly centralized at 30 min with FITC-labeled silica particles isolated to the outer plasma membrane with little co-localization. At 4 hours Caveolin-1 was widely disseminated through the cell and there was a strong co-localization between caveolin-1 and the FITC-labeled particles visible in the cells. Our results suggest that ultra fine particles can be internalized and transported across endothelial cell membranes, potentially using a caveolar transport mechanism similar to other macromolecules and drugs.
 
Figure 2: Confocal Z series images of FITC labeled particles (green) and caveolin-1 (red) at 30 min and 4 hours after exposure. Caveolin label is general central on the cell surface and PM limited to the apical portion of the cell at 30 min. By 4 hour, bright spots were yellow at multiple levels demonstrating both co-localization and aggregation of caveolin rich vesicles at all levels of cell cytoplasm.
Figure 2
 
Particle Transport in Cultured Airway Epithelium
Our findings demonstrating transcellular transport in endothelial cells led us to ask
whether similar routes of transport occur in cultured human airway epithelial cells. We found, in contrast to studies with endothelium, airway epithelium did not allow transport during a 4 hour incubation period (Figure 3A) compared with extensive transport in endothelium (Figure 3B) and furthermore, limited internalization of iron oxide particles occurred despite similar association with cell surfaces (Figure 3C).
 
Figure 3: Localization of iron oxide particles after 4 hours of incubation with either cultured human airway epithelium (A + C) or aortic endothelium (B). Initial concentration was 10 ug.ml of 30 nm Iron Oxide PM.
 
Figure 3
 
Real time evaluation of transendothelial transport We synthesized Alexafluor 680 conjugated silica particles for use in real time transport studies using deconvolution microscopy. In addition, we successfully cloned and transfected a GFP caveolin construct that will allow us to co-localize red Alexa 680 labeled PM with green labeled caveoli. Figure 1A illustrates that transfection with GFP alone results in a diffuse cellular stain and that addition of silica does not co-localize with GFP. Using GFP caveolin transfected human aortic endothelial cells, we showed GFP caveolin associated with a typical arrangement of centrally located surface oriented aggregates of caveolar like structures Figure 4A. We confirmed co-localization of 30 nm silica particles in caveolar associated vesicles after 30 min. incubation. Furthermore, we demonstrated rearrangement of caveolar structures from aggregates over the center of the cell to dispersed and larger caveolin associated structures after silica treatment (Figure 4B).
 
To take advantage of transfected cells we performed time course imaging of live cells treated with silica particles using spinning disc confocal microscopy (Figure 5). This technique was more challenging as it required transport of live cultures to a distant imaging facility. Particularly challenging was reaggregation of dispersed particles in preparations made before transport.
 
Figure 4A: Deconvolution microscopic images of HAEC transfected with GFP protein only. A) untreated cells B) cells treated with 10 ug/ml 30 nm Alexafluor 680 conjugated silica particles.
Figure 4A
 
Figure 4B: Deconvolution microscopic images of HAEC transfected with GFP-caveolin. A) Untreated cells show localization at the cell surface over the center of the cell (similar to findings with caveolin immunostaining –data not shown) B) Cells treated with 30 nm Alexafluor 680 conjugated silica particles have yellow fluorescence indicative of co- localization and dispersion of caveolar structures to the periphery of the cell.
Figure 4B
 
Figure 5: Spinning disc confocal microscopic images of live HAEC transfected with GFP-caveolin. GFP-Caveolin transfected cells were treated with 10 ug/ml 30nm Alexafluor 680 conjugated silica particles and individual cells photographed at indicated times to observe internalization and transport.
Figure 5
 
The endothelial response to nanoparticulate silica exposure is dependent on particle size Our preliminary work evaluating mechanisms of trans-endothelial transport of synthetic ultrafine particles demonstrated that PM in the nanoparticle range (20-50 nM) is transported across endothelial cell barriers relatively quickly through veiscuol-caveolar transport while larger particles (500 nM) are not. We have expanded these studies to evaluate the effect of size on cellular function using theoretically inert laboratory generated monosized silica. We evaluated effects on barrier function by electrical conductance measurements (ECIS system Applied Biophysics). Results of these studies, described below, suggested that 20 nM silica particles were toxic in cultured endothelium. This suggests that internalization of PM is important in generating toxicity. We further investigated the mechanism of nanofine silica toxicity by comparing intracellular ROS generation and assays for apoptosis. Effects of nanoparticulate silica on endothelial barrier permeability While our first experiments with collected ambient particulates showed little effect on endothelial barrier function, the nanoparticulate silica used as a control surprisingly had marked effects on barrier integrity. We performed additional barrier function assays using Electric Cell-substrate Impedance Sensing (ECIS, Applied Biophysics). We evaluated functional consequences of 20nm and 500nm silica suspended in complete medium on confluent monolayers of Human Pulmonary Microvascular Endothelial cells (HPMVEC) in ECIS chamber plates. The ECIS apparatus measured monolayer resistance (tests the integrity of intracellular junctions) and monolayer impedance (tests the integrity of connections between the basal side of the cell and the growth substrate). As shown in Figure 6, an image generated by the ECIS proprietary software, the ability of the monolayer to maintain resistance was abrogated by the application of 20nm silica at 50 µg/ml within 12 hours of treatment application (p < 0.05). The figure also shows that 20nm silica at 10mg/ml had an effect on monolayer resistance but it was not as profound as the 50 µg/ml treatment, though it differs significantly from control by 40 hours post treatment (p=0.012). Figure 7 shows the mean for each treatment when the experiment was repeated three times. There was no difference from control with the 500nm particles at either treatment dose.
 
Figure 6:
Figure 6
 
The monolayer impedance showed much the same trends. As shown in figure 8, the 20nm silica treatment at 50μg/ml showed the same precipitous decrease in monolayer impedance by 12 hours post-treatment (p<0.05) and the 10mg/ml treatment was significantly different from control at 40 hours post treatment. Figure 9 shows the mean data from three separate experiments. There was no difference from control after treatment with the 500nm silica particles at either dose.
 
Figure 8:
Figure 8
Figure 9:
Figure 9
 
Overall, the ECIS experiments show that there is a significant difference in the endothelial response to silica treatment that is based on particle size and that both the intracellular junctions and cell-substrate junctions are affected.
 
Reactive Oxygen Species Generation
The finding that internalization of supposedly inert silicate nanoparticles resulted in
endothelial cell toxicity led us to examine mechanisms behind this. We hypothesized that internalization was associated with generation of ROS. Human Pulmonary Artery Endothelial Cells (HPAEC) exposed to 20nm and 500nm silica show an increase in ROS generation as measured with 5-(and-6)-carboxy-2',7'-dichlorofluorescein dictate (carboxy-DCFDA) dye (Molecular Probes) which passively diffuses into cells and is then cleaved by esterases active in the production of ROS. Figure 10 shows the number of pixels positive for intracellular ROS generation 3 and 24 hours after silica treatment 0.25mM PMA was used as a positive control. 20nm silica at 50mg/ml showed a significant difference from PMA control at 3 hours (p=0.004) and 24 hours (p=0.023). At 24 hours, there was significant difference between 20nm silica 10mg/ml dose and the PMA control (p=0.0056). By 24 hours, there is very little ROS detection in the 20nm 50mg/ml treatment. We attribute the decreased ROS at 24 hours to overall cytotoxicity and cellular loss. At 24 hours, the 500nm silica at both 10mg/ml and 50mg/ml doses are not different from the PMA control, showing that ROS is generated after 500nm silica exposure, but more slowly than with 20nm silica.
 
Figure 10:
Figure 10
 
Cell Death Mechanisms resulting from nanoparticulate silica
We evaluated nuclear cytology to determine the nature and extent of cell death resulting from silicate exposure using the fluorescent nuclear dye DAPI. Confluent monolayers of HMVECs were treated with 20 or 500 nM silica and evaluated by fluorescent microscopy with objective evaluation by image analysis using ImageJ software evaluation of digital images. We found nuclei of treated cells varied in size with 3 distinct groups: normal/large (nuclei with a pixel count of at least 2000 pixels), small/contracted (pixel count less than 2000 pixels), and fragmented. Since these findings suggested induction of cellular apoptosis, 0.1ng/ml TNFa was used as a positive control. Figure 11 shows that the total density of nuclei present on each coverslip is consistent between treatments, though there are fewer nuclei present 4 hours after treatment. Figure 12 shows that greater than 60% of the nuclei in the 20nm treatment groups were greater than 2000 pixels. Figure 12 also shows that there were fewer nuclei greater than 200 pixels in the 500nm treatment groups. Figure 13 shows that there are far more contracted nuclei (less than 2000 pixels) present after treatment with the 500nm particles, which is very similar to the positive control. There are also fewer contracted nuclei in the 20nm treatment groups. Figure 14 shows that the number of fragmented nuclei across the treatment groups is consistent, except for a small increase in the 500nm 50mg/ml treatment groups, but treatment groups had fewer fragmented nuclei than the positive control. Overall, 20nm particles seem to have little effect on the nuclear morphology, while 500nm particles cause a contraction to occur making the nuclei appear pyknotic. These results suggested differing mechanisms of cytotoxicity for 20 vs 500 nM silica.
 
Figure 11:
Figure 11
Figure 12:
Figure 12
Figure 13:
Figure 13
Figure 14:
Figure 14
Caspase-3/Annexin V Assay
The presence of contracted nuclei in silica treated cells suggested apoptosis as a possible mechanism of cell death. We evaluated activation of caspase-3 and membrane transposition of Annexin V as markers of apoptosis. HMVEC were grown to confluence on 12mm diameter coverslips coated with fibronectin then treated with 20nm or 500nm silica particles at either 10mg/ml or 50mg/ml dose. The cells were fixed after 1 hour or 24 hours of treatment and then assayed for Caspase 3 nuclear translocation and Annexin V activity of phosphotidyl serine flipping in the phospholipid bilayer. After 1 hour, there was no Caspase 3 or Annexin V activity detected. 1mg/ml tunicamycin was used as a positive control. After 24 hours of treatment, there is no detectable Caspase 3 in the nuclei of any treatment group, though it does appear that there is some Annexin V activity in both the 20nm and 500nm 50mg/ml silica treatments. Since there is no Caspase 3 activation, it is likely that the cells treated with both sizes of silica are undergoing ROS-driven oncosis rather than directed apoptosis.


Journal Articles on this Report : 2 Displayed | Download in RIS Format

Publications Views
Other subproject views: All 3 publications 2 publications in selected types All 2 journal articles
Other center views: All 128 publications 71 publications in selected types All 64 journal articles
Publications
Type Citation Sub Project Document Sources
Journal Article 
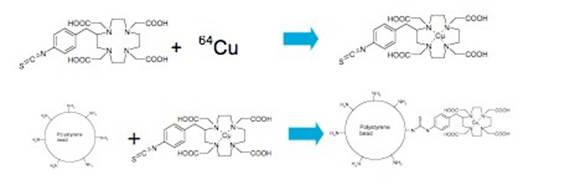
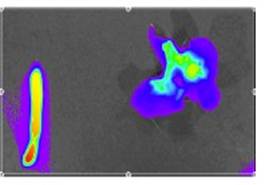
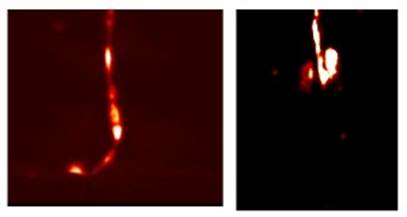
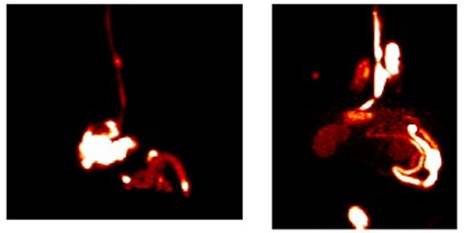
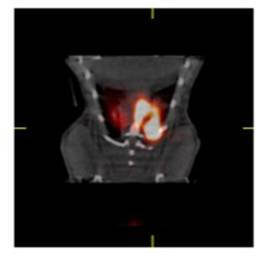
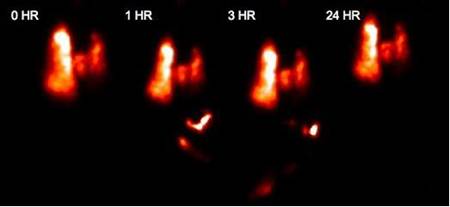
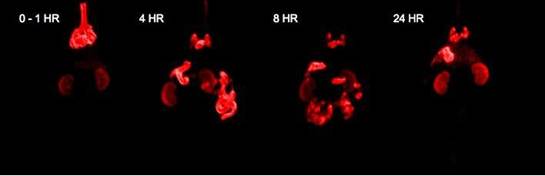
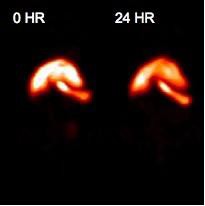
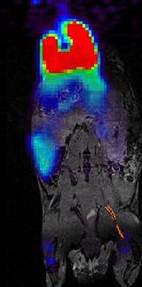
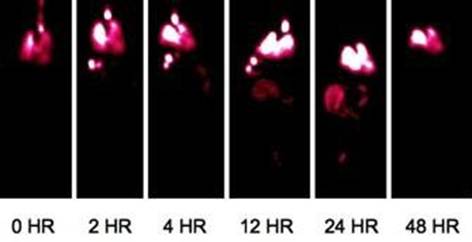
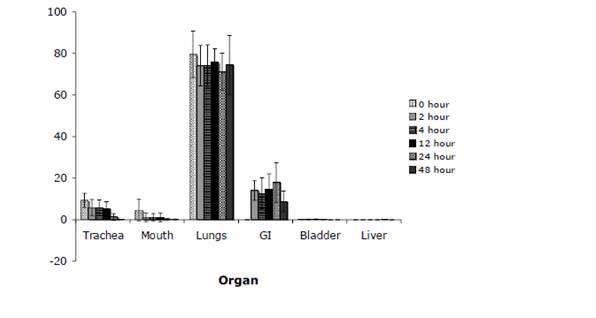
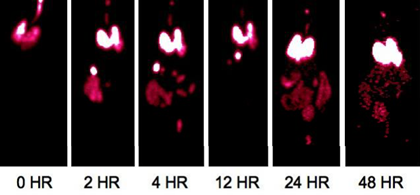
Enright HA, Bratt JM, Bluhm AP, Kenyon NJ, Louie AY. Tracking retention and transport of ultrafine polystyrene in an asthmatic mouse model using positron emission tomography. Experimental Lung Research 2013;39(7):304-313. R832414 (Final)
R832414C004 (Final)
  • Abstract from PubMed
  • Abstract: Taylor & Francis-Abstract
    Exit
  • Journal Article Palko HA, Fung JY, Louie AY. Positron emission tomography:a novel technique for investigating the biodistribution and transport of nanoparticles. Inhalation Toxicology 2010;22(8):657-688. R832414 (Final)
    R832414C004 (Final)
  • Abstract from PubMed
  • Abstract: Taylor & Francis-Abstract
    Exit
  • Supplemental Keywords:

    RFA, Health, Air, particulate matter, Risk Assessments, toxicology, long term exposure, lung disease, epidemiological studies, PM

    Progress and Final Reports:

    Original Abstract
  • 2006 Progress Report
  • 2007 Progress Report
  • 2008 Progress Report
  • 2009 Progress Report
  • 2010 Progress Report

  • Main Center Abstract and Reports:

    R832414    UC Davis Center for Children's Environmental Health and Disease Prevention

    Subprojects under this Center: (EPA does not fund or establish subprojects; EPA awards and manages the overall grant for this center).
    R832414C001 Project 1 -- Pulmonary Metabolic Response
    R832414C002 Endothelial Cell Responses to PM—In Vitro and In Vivo
    R832414C003 Project 3 -- Inhalation Exposure Assessment of San Joaquin Valley Aerosol
    R832414C004 Project 4 -- Transport and Fate Particles
    R832414C005 Project 5 -- Architecture Development and Particle Deposition

    Top of Page

    The perspectives, information and conclusions conveyed in research project abstracts, progress reports, final reports, journal abstracts and journal publications convey the viewpoints of the principal investigator and may not represent the views and policies of ORD and EPA. Conclusions drawn by the principal investigators have not been reviewed by the Agency.

    Project Research Results

    • 2010 Progress Report
    • 2009 Progress Report
    • 2008 Progress Report
    • 2007 Progress Report
    • 2006 Progress Report
    • Original Abstract
    3 publications for this subproject
    2 journal articles for this subproject
    Main Center: R832414
    128 publications for this center
    64 journal articles for this center

    Site Navigation

    • Grantee Research Project Results Home
    • Grantee Research Project Results Basic Search
    • Grantee Research Project Results Advanced Search
    • Grantee Research Project Results Fielded Search
    • Publication search
    • EPA Regional Search

    Related Information

    • Search Help
    • About our data collection
    • Research Grants
    • P3: Student Design Competition
    • Research Fellowships
    • Small Business Innovation Research (SBIR)
    Contact Us to ask a question, provide feedback, or report a problem.
    Last updated April 28, 2023
    United States Environmental Protection Agency

    Discover.

    • Accessibility
    • Budget & Performance
    • Contracting
    • EPA www Web Snapshot
    • Grants
    • No FEAR Act Data
    • Plain Writing
    • Privacy
    • Privacy and Security Notice

    Connect.

    • Data.gov
    • Inspector General
    • Jobs
    • Newsroom
    • Open Government
    • Regulations.gov
    • Subscribe
    • USA.gov
    • White House

    Ask.

    • Contact EPA
    • EPA Disclaimers
    • Hotlines
    • FOIA Requests
    • Frequent Questions

    Follow.