
Grantee Research Project Results
Final Report: SEARCH: Solutions to Energy, AiR, Climate, and Health
EPA Grant Number: R835871Center: Solutions for Energy, AiR, Climate and Health Center (SEARCH)
Center Director: Bell, Michelle L.
Title: SEARCH: Solutions to Energy, AiR, Climate, and Health
Investigators: Bell, Michelle L. , Hobbs, Benjamin F. , Peng, Roger D. , Esty, Daniel C.
Institution: Yale University , Northeastern University , Stanford University , University of Chicago , University of Michigan , North Carolina State University , The Johns Hopkins University , Centers for Disease Control and Prevention , Pacific Northwest National Laboratory
EPA Project Officer: Callan, Richard
Project Period: October 1, 2015 through September 30, 2020 (Extended to September 30, 2022)
Project Amount: $9,999,990
RFA: Air, Climate And Energy (ACE) Centers: Science Supporting Solutions (2014) RFA Text | Recipients Lists
Research Category: Particulate Matter , Air Quality and Air Toxics , Airborne Particulate Matter Health Effects , Air , Climate Change
Objective:
The SEARCH Center investigated emerging energy transitions, air pollution, and health in the United States through state-of-the-science modeling and measurements. We examined how factors affecting emissions, air pollution, and health affect regional and local differences in air pollution and health today and under climate change. Our findings are beneficial to communities and decision-makers at the local to national level and can thereby help improve health and society.
The main objectives of the SEARCH Center are to investigate energy-related transitions underway across the U.S. by combining state-of-the-science modeling of energy systems, air quality, climate, and health. SEARCH aims to characterize factors contributing to emissions, air quality and health associated with key energy-related transitions in order to understand how these factors affect regional and local differences in air pollution and public health effects today and under a changing climate. In addition, we researched key modifiable factors (e.g., transportation, land-use, power generation) and how those factors and their air pollution impacts are likely to change over time.
Project 1 estimates how energy transitions in the U.S. affect emissions of air pollutants, including how modifiable factors influence regional emissions. This Project uses detailed modeling of energy and emissions, including key feedbacks within the energy system and development of novel downscaling tools. Life Cycle Assessment is used to estimate a broader set of emissions, such as those from manufacture of energy technologies. Project 2 assesses ambient levels and personal exposures of air pollution corresponding to energy transitions taking place in a case study city, by developing and deploying novel high-resolution monitors and considering modifiable factors, such as commuting patterns. Project 3 uses state-of-the-science online coupled air quality modeling to estimate how energy transitions in Project 1 affect ambient concentrations. It also develops improved modeling tools to reduce uncertainty and better characterize temporal and spatial variation of pollutants and identify modifiable factors contributing to regional differences in pollution. Project 4 estimates the health consequences of energy transitions and incorporates key uncertainties and epidemiological analysis of under-studied modifiable factors (e.g., urbanicity, land-use). Climate change modeling (Project 3) is used to estimate how the results of all the Projects are affected by potential climate change. In addition, Project 4 estimates the human health impact of emissions from the energy scenarios and how different populations are affected by temperature and air pollution. The discussions below highlight a portion of the SEARCH Center activities; please see our publication list for further details on our many research efforts. Below we present a subset of our work.
Project 1: Modeling Emissions from Energy Transitions
Project 1’s researchers at JHU and Yale collaborated with the SEARCH Center Policy and Decision-Making Unit and state air regulatory agencies to develop a suite of energy transition scenarios representing many drivers and shifts in the energy sector that could impact regional emissions and air quality. These transitions were then modeled by Yale team members for the entire U.S. using the National Energy Modeling System (NEMS), which represents energy supply and demand at a multistate regional scale. NEMS emissions and fuel use results were then downscaled for input into air quality simulation models, run by SEARCH Project 3 researchers at Northeastern University. Project 1 and 2 researchers at Yale also collaborated to explore potential indoor-outdoor air quality and associated health impacts associated with an energy transition scenario involving aggressive weatherization of residential buildings. Finally, emissions estimates for indirect energy use determined through lifecycle cost assessment (LCA) for the NEMS scenarios were developed by Project 1 team members at Northeastern University. Methods and results are extensively documented in peer-reviewed publications.
Project 2: High-Resolution Ambient Air Monitoring Networks and Personal Monitors
The objectives from the proposal are as follows, with only minor modifications to Objective 3 to accomplish the goals in light of restrictions related to the COVID-19 pandemic:
Objective 1: Develop novel online multipollutant monitors to simultaneously measure air pollutants and GHGs (i.e., CO, CO2, CH4, PM2.5, NO2, O3, SO2, oxidative potential, VOCs).
Objective 2: Developing a network of sites for stationary monitors during field deployment and protocols for the personal sampling.
Objective 3: Measure temporally resolved in-home exposures with detailed time-activity information using novel portable multipollutant monitors. This data will be compared with outdoor monitor data and network-based (Objective 2) estimates of exposure.
Project 3: Improving Projections of the Spatial and Temporal Changes of Multi-Pollutants to Enhance Assessment of Public Health in a Changing World.
The main goal of Project 3 is to produce a comprehensive suite of results under various energy transition scenarios for the development of robust integrated control strategies to improve air quality and public health considering the impacts of modifiable factors. It involves collaboration among NEU, Pacific Northwest National Laboratory (PNNL), and University of Chicago (UC). Specific objectives for each institution are:
- Develop new methods to generate high resolution snapshots of NO2 and PM2.5 using WRF-Chem output, MAIAC aerosol optical depth, high resolution land-use type, and re-analysis meteorology for health assessment studies
- Develop and apply methods to analyze extreme events such as heat waves for evaluating model ability to capture extreme events important for air quality
- Understand the impacts of wildfires on air quality by analyzing global simulations in order to improve the representation of wildfire emissions for air quality simulations
- Improve characterization of the temporal and spatial variations of multipollutants through model improvement, bias correction, and use of satellite data retrievals
- Apply the improved models under current emissions and energy transition scenarios to simulate changes in air pollutants and health impacts for past and future periods
- Compare health impacts estimated based on chemical transport models (CTM vs. reduced complexity models (RCM) approaches through cross-center collaboration
Project 4: Human Health Impacts of Energy Transitions: Today and Under a Changing World
Decision-makers who protect health from air pollution are faced with complex systems involving multiple emission sources, variation in health response by population and region, and temporal changes such as climate change and economic development. The overall goal of Project 4 is to provide scientific evidence to aid sound policy by investigating: 1) factors that could influence air pollution-health associations, including modifiable factors and factors that could account for regional variability in observed associations (e.g., urbanicity, land-use), for PM2.5 and ozone on risk of cardiovascular and respiratory hospital admissions, including understudied rural populations; 2) health impacts from energy transitions using the most up-to-date scientific information on the multipollutant mixture, regional variation, and sensitive subpopulations; and 3) how climate change could affect health impacts of energy transitions and the co-benefits/costs of air quality policies by calculating their climate change impact.
FSU1 - Facility Support Unit 1: Environmental Data Science Facility Support Unit.
The Environmental Science Data Support Unit, formally called the Quantitative Methods Facility Support Unit, for the SEARCH Center provides centralized statistical and data analytic services to all projects in the Center. The Core is housed at the Johns Hopkins Bloomberg School of Public Health. The Unit brings extensive expertise in the analysis of environmental health and spatial-temporal data and its investigators have long-standing collaborations with their members of the research team. The objectives of the Unit are to: (1) provide statistical analysis support for all four proposed Center projects, including design consultation, analytical work, and manuscript preparation; (2) conduct statistical methodology research for application in all Center projects when existing approaches are insufficient to address the scientific questions of interest; and (3) coordinate efforts across projects to ensure that all
FSU2 - Facility Support Unit 2: Policy and Decision-Making Facility Support Unit
Summary/Accomplishments (Outputs/Outcomes):
Project 1: Modeling Emissions from Energy Transitions
The first step in Project 1 was to develop a suite of energy transition scenarios representing many drivers and shifts in the energy sector that could impact regional emissions and air quality. The goal of the energy transition scenario development is to provide guidance on the most effective modifiable factors for protecting regional environmental, health, and societal well-being. With extensive feedback from the air quality managers, we developed the following five energy transitions:
- Low natural gas prices in the long term
- High electric vehicle penetration
- Innovations in building energy efficiency
- High penetration of distributed generation and demand response/energy storage
- Modernized/Electrify ports and marine shipping
Throughout the duration of the Center we ensured quality assurance by continually touching base with the air quality managers to get their perspectives on our findings and input into anything we might have missed. This work thus demonstrated the effectiveness of stakeholder-driven research in the energy and air quality modeling arena.
2.2.2 Modeling Transition Scenarios in NEMS
To examine the scenarios, we made use of a version of the US Energy Information Agency’s National Energy Modeling System (NEMS). The Yale team modified certain aspects to correct certain identified modeling and data handling issues, creating the Yale-NEMS model. The model runs in annual time steps out to 2050. At its core, it is a general equilibrium model with all major sectors of the economy that relate to energy use included. It also includes all major regulations and policies that are currently on the books (no regulations or policies are projected if they are not already on the books).
A major advantage of NEMS is its comprehensiveness and the amount of development effort that has gone into the model. The parameters that go into the model were sourced by teams at EIA and its contractors that consist of experts on the energy systems that have access to a phenomenal amount of data and information. The model also has many regions, which allows for more disaggregated analyses. A major downside of using NEMS, however, is the challenge of getting it running, which can be expected to take 6 months or more. Another weakness is that the full model takes nearly a day to run on a standard workstation, precluding Monte Carlo uncertainty analyses; running individual modules (e.g., the electricity markets module) can be done quickly.
This part of the project led to several substantial accomplishments. First and foremost, we developed all five of the scenarios and presented the results to numerous stakeholders, including state air quality managers and different offices at EPA. The results were also presented in several impactful academic outputs. As an example of the results, the distributed resources scenario analytically and empirically characterizes a novel crowding out effect related to an energy policy that aims to reduce negative externalities from greenhouse gas emissions by greatly expanding adoption of rooftop solar. We first developed a stylized model of centralized generation that factors in the amount of electricity provided by rooftop solar, and then used Yale-NEMS to simulate the effects of an aggressive policy push that mandates the adoption of rooftop solar on 40% of all residential and commercial buildings by 2050. The results indicate that although this policy causes carbon dioxide emissions from electric power generation to drop by 21% in 2050, the drop in emissions is limited by an effect of rooftop solar partially crowding out centralized solar by lowering market prices for electricity during peak hours. However, cheap energy storage can substantially reduce, although not eliminate, the crowding out effect.
2.2.3 Downscaling NEMS Scenarios in Space and Time
The output data from NEMS are used for downscaling, which is the processing of large-scale, large time step aggregated NEMS outputs in order to create emissions data at suitable time and space scales needed for subsequent emissions processing, air quality simulations, and ultimately health impact analyses, The downscaling work by the JHU Project 2 team used standard and non-standard results from the Yale-NEMS model produced by Yale colleagues in order to generate and then pass downscaled information (emission change factors relative to a NEI) to the team in Project 3 who then created and analyzed gridded SMOKE emissions. For energy production and use data that were already available by NEMS region by default, we used the standard NEMS output files. For data not reported in the regional level but instead at the national level, the Yale team first modified the model code to extract all relevant raw data from NEMS runs in the form of text files and then processed and transformed them to the same regional format as the standard NEMS outputs for use in the downscaling procedures.
The JHU team has investigated and developed two downscaling methods for disaggregating NEMS model results and linking to national emission inventory (NEI) and air quality model CMAQ and WRF-Chem. The basic “grow in place” (GIP) was implemented to downscale all NEMS sectors, including the residential/commercial sector, electricity generation unit sector, industrial sector, oil & natural gas production sector, transportation sector, and marine shipping. For one crucial sector—the electric power generation sector—a “site and grow” (SAG) spatial downscaling and weather information-based temporal downscaling model (TDM) were designed for electricity power sector as an improvement to GIP method Only the GIP results were provided to the Northeastern University team for use in SMOKE and air quality models; meanwhile, the GIP and SAG/TDM electric generating unit (EGU) results were compared to assess the general impact of the alternative downscaling approaches, as described later in this section.
To summarize, we have accomplished a computer software (in the R/Python programming languages) that can efficiently process NEMS results to produce downscaled emission change factors (ECFs) using the GIP method, allowing the Project 3 team at Northeastern University to apply those factors to a NEI in the SMOKE model to generate different future emission scenarios. The downscaling has successfully projected five of the energy transitions scenarios described in Section 2.2.1 (the base case, abundant natural gas, PV penetration, high building energy efficiency, and port scenario), and it is ready to process any more energy scenarios in a designed format from Yale-NEMS. We also finished a test case in the SRVC (North Carolina-South Carolina-Virginia) region for SAG-TDM downscaling framework. An important finding is that the choice of downscaling method significantly impacts emissions distribution in space and time. Selected details about the two downscaling methods and their results follows below.
An innovative procedure for downscaling transportation emissions that bypassed use of a computationally intensive (i.e., effectively infeasible) procedure in the emissions processing step in order to apply growth rates to cell-specific mobile source emissions. The procedure was developed because our initial plan for modeling NEMS-driven mobile source emissions in SMOKE encountered a serious problem: the inability of the sub-model within SMOKE (MOVESMRG) to process mobile source emission change factors in a feasible amount of time for large domain, extended duration simulations.
We developed and implemented an innovative technique (“site-and-grow”) for spatial downscaling of new EGU point sources that includes a GIS screening step and generation placement based on capacity expansion modeling. The configuration of new sources reflects transmission, water, and land availability, as well as shifting patterns of fuel costs and demand, reflecting the possibility that future combustion-based generating sources would likely be sited in different locations than existing facilities. We also considered within-region transmission constraints, site availability and suitability, and the distribution of electricity demand, interactions with existing generators, and quality of renewable resources. This involved introducing new constraints to make renewable production consistent with sub-regional renewable energy capacity factors, thereby giving more realistic representation of downscaled sub-regional system operations and ultimately power sector emissions, reflecting sub-regional differences in meteorological conditions and renewable resource quality. Our results indicated that “site-and-grow” results in systematically different emissions patterns over space than GIP, depending on which of the NEMS scenarios are considered.
The final effort in the downscaling task addresses EGU emissions temporal downscaling. We have created a load and renewable profile processing model (based on multivariate linear regression) to account for variations of meteorological conditions such as temperature, wind speed and solar radiation. The simulated hourly profiles were tested and used by the second temporal downscaling step – an electricity dispatch model (formulated as a linear program optimization) – to generate weather-responsive hourly operations over the year for each type of generation technologies in each sub-region. We simulated hourly emission profiles of fossil fuel plants while accounting for system operation under high penetration of renewables (for some sub-regions) and temperature sensitive load demand in response to variations of meteorological conditions. We anticipate that the correlations of demand, renewable output, the resulting emissions and meteorological influences on air quality are likely to result in different air quality distributions (and, potentially, health effects) than if those correlations are ignored. For instance, we anticipate that higher EGU emission rates will occur under precisely those conditions most favorable to formation of ozone or entrapment of pollutants by temperature inversions. These potential correlations are not considered by the grow-in-place method or SMOKE default temporal profiles.
A comparison of our weather-responsive temporal downscaling method (TDM) with the SMOKE downscaled temporal emission profile for the 2050 “reference” (“no Clean Power Plan”) scenario in the SRVC region is shown below.
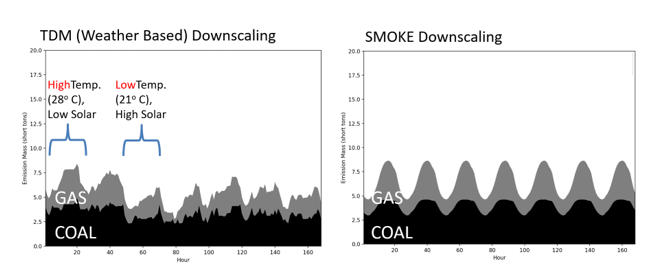
Figure 2.1 Hourly NOx emissions by technology in summer (two weeks) in SRVC region: (left) temporal downscaling based on weather-responsive emissions generation, (right) SMOKE uniform emissions profiles.
In the left-hand (TDM) plot, it is clear that fossil fuel power plants operates in response to weather variations. The first two days have relative higher temperatures and lower solar radiation which implies higher electricity demand and lower solar generation. Thus higher NOx emissions from fossil fuel plants occur than on the third day, when temperatures go down and solar radiation increases. In contrast, the SMOKE profiles on the right are based on historical fossil fuel plants operation patterns, and only present emission patterns with identical diurnal cycles. Therefore, the TDM-generated hourly time series could more accurately reflect optimal power system operation in response to meteorological conditions.
2.2.4 Life-Cycle Analysis (LCA)
The accomplishments of the SEARCH LCA team include the following:
- Successfully integration of material flows into the Yale-NEMS model (both extraction inputs and manufacturing outputs), allowing for analysis of the physical requirements of energy transitions or, more generally, the dematerialization of the U.S. economy.
- Using the material flow NEMS coupling, contributed to a national analysis of generation and reuse potential of 100 million tons of industrial byproduct materials.
- Successfully integrated emissions of hazardous air pollutants to NEMS, covering all of the air toxics, greatly expanding the ability of NEMS to project emissions. Based on this modeling framework, it is possible to project US health damages from air toxics emissions, calibrated to results from the latest National Air Toxics Assessment (NATA). Results for formaldehyde were cross-checked in collaboration with a related study from Australia to evaluate sectoral contributions and relative patterns of health damages (see next figure).
- Completed an inter-model comparison of characterization factors (fate+transport+damage) for hazardous air pollutants used in the global consensus USEtox life cycle impact assessment method adopted by USEPA, in comparison to those derived from the National Air Toxics Assessment.
- Built on USEtox-NATA inter-model comparison to examine the multi-media fate modelling of air toxics. This analysis found that for a significant sub-set of air toxics, the largest risk pathway is not through air, emphasizing the importance of using a multi-media perspective.
- Completed an environmental justice (EJ) study of community-level exposures to air toxics in Massachusetts based on raw NATA results, compared to those communities officially labelled as EJ by the state. The analysis found a statistical difference in concentrations between EJ and non-EJ communities for most air toxics. For the majority, concentrations are higher for EJ communities, but for a small subset, the converse is true.
- Building on SEARCH tools developed within the project, undertook in-depth analysis of resource use, emissions, and health care damages associated with the health care sector. This work has led to collaborations with the Lancet Countdown on health and climate change and input to several working groups of the National Academy of Medicine’s Decarbonization Action Collaborative.
-
Methodologically, the LCA portion of the SEARCH project led to new model integrations and mappings that can enable future research within the integrated assessment community. Full mappings between NEMS-COMTRADE, NEMS-USEEIO, and USEtox-NATA have been peer-reviewed and published online in full. Access to the mappings (in csv) and model code (in python) are available for free and do not require any commercial software to run.
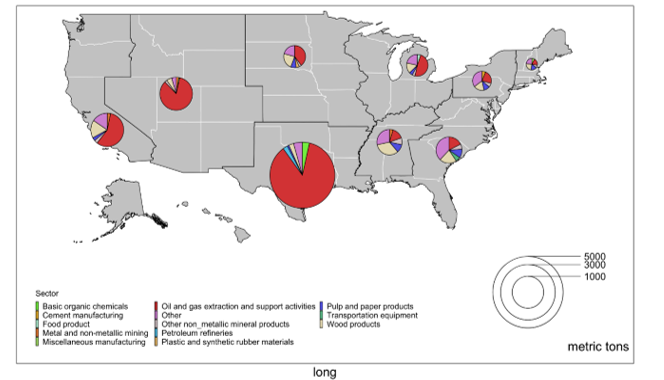
Figure 2.2 Projected industrial sector contributions to formaldehyde emissions in the Annual Energy Outlook Reference case without Clean Power Plan scenario for 2050.
Project 2: High-Resolution Ambient Air Monitoring Networks and Personal Monitors
Project 2 includes data collection and analysis using the multipollutant monitors across the SEARCH ambient network and for the in-home studies, analysis and preparation/submission of manuscripts furthering calibration strategies using in-field and lab data, analysis and interpretation of data, and manuscript preparation. The first stationary monitor was deployed in October 2018 and currently we have 43 monitors deployed. We also participated in the inter-SEARCH and CACES-SEARCH collaborative projects, both of which have been yielding manuscripts with continued analysis of data, including from a month-long field and lab campaign in Pittsburgh and Baltimore (Year 4). We also collected data from in-home exposures for the modified Objective 3.
The activities on Objective 1 have specifically included:
In addition to the activities associated with the multipollutant monitor-related manuscripts discussed further below and summarized in the publications list, we also expanded the capabilities of an interactive data quality control software that enables us to view the low-cost sensor data, compare with nearby regulatory data and mark any periods where sensors are malfunctioning. This software was written in the Matlab programming language, but the user-friendly interface enables those with low programming experience to use it.
The activities on Objective 2 have specifically included:
Multipollutant measurements with the stationary monitoring network were performed with analysis of the continuously-collected data with multiple publications submitted or in preparation advancing both low-cost measurement methods and spatiotemporally-resolved studies of urban air pollution (Objectives 1-2).
One of our core activities for Objective 2 has focused around the calibration of all sensors in the monitors to be able to produce maps and other outputs of the monitoring network data. Postdoctoral Fellow Misti Zamora has evaluated calibrations for sensors in the multipollutant monitor and a manuscript “Evaluating the performance of using low-cost sensors to calibrate for cross-sensitivities in a multipollutant network” published in ACS ES&T Engineering. Multiple regression models were used to produce accurate hourly concentrations for all tested sensors except ozone, which likely requires non-linear methods to capture peak summer concentrations. All five models (particulate matter, carbon monoxide, ozone, nitrogen dioxide, and nitrogen monoxide) produced high Pearson correlation coefficients (r > 0.85), and the overall hourly averaged calibrated sensor and reference data from the evaluation period were within 3-12%. Each sensor required a distinct set of covariates to achieve the lowest possible root mean square error (RMSE). All five sensors responded to environmental factors, and three sensors exhibited cross-sensitives to another air pollutant. We compared the RMSE from models that used co-located regulatory instruments and co-located sensors as covariates to address the cross-sensitivities, and the corresponding model RMSEs were all within 0.5 ppb. This indicates that low-cost sensor networks can yield valuable data if the monitoring package is designed to co-measure key covariates. This is key for the utilization of low-cost sensors by diverse audiences since this does not require continual access to regulatory grade instruments. Full details can be found at Zamora et al. (2022) Evaluating the performance of using low-cost sensors to calibrate for cross-sensitivities in a multipollutant network. ACS ES&T Engineering, doi: 10.1021/acsestengg.1c00367.
We explored approaches using machine learning approaches such as gradient boosted decision trees (NGBoost) to calibrate the raw sensor data (without laboratory calibration) to the MDE data. In Patton et al. (2022), we showed that this method can provide more accurate estimates than the linear regression described above, even without using laboratory calibrations. NGBoost outperforms the linear regression both using a testing dataset of 20% of the full timeseries (i.e. 12/18 – 11/19 in this analysis) or comparing data trained at the MDE site at Old Town against an out-of-sample set from the MDE site in Essex. This paper also demonstrated how the distributions of concentrations produced through this machine learning approach could be applied for exposure sciences. We developed maps of PM variability in the mean and 95th percentile exposures for Baltimore on example days and the probability of daily mean PM2.5 concentrations exceeding health-based standards. Full details can be found at: Patton et al. (2022). Non-linear probabilistic calibration of low-cost environmental air pollution sensor networks for neighborhood level spatiotemporal exposure assessment. Journal of Exposure Science and Environmental Epidemiology (2022). https://doi.org/10.1038/s41370-022-00493-y
The activities on Objective 3 have specifically included:
As described previously, Objective 3 was not able to proceed as originally planned, due to COVID-19 related issues. We received IRB approval for a modified approach in which we deployed the stationary and portable multipollutant monitors to measure temporally resolved in-home exposures with detailed time-activity information, over a 4-week period. In this study we seek to address how modifiable factors influence in-home exposure to air pollutants. This includes estimating the degree to which proximity to outdoor energy-related sources impact in-home exposures to air pollutants. We also collect in-home measurements of PM2.5 using filter-based approaches to compare with the sensor data and measure ultrafine particles to better understand indoor sources. We measure temperature in the kitchen and at heating units or ventilation sources (e.g. HVAC vents) to relate these conditions with indoor concentrations at high-temporal resolution. We are also determining if home exposures assigned from maps of pollutant concentration are able to capture a substantial fraction of the variability in observed exposures (both inside and directly outside the participants’ homes). Spatiotemporal concentration fields (i.e. maps) will come from: (1) the spatial interpolation of our high-resolution network; (2) the regional air quality model at up to 1x1 km resolution (Project 3); and (3) regulatory air quality measurements. The first participant was recruited in January 2022 and we have completed measurements for 17 participants to date.
Activities in the SEARCH-CACES collaborative study included a focus on data analysis and interpretation, and dissemination of completed results via conference presentations and manuscripts by SEARCH/CACES team members. This data analysis has leveraged both online (CACES) and offline (SEARCH) measurements of gases and particles collected (a) in Pittsburgh and Baltimore using the CACES mobile laboratory (amongst the high-spatiotemporal measurement networks deployed by SEARCH) and (b) in experiments conducted in the CACES oxidation chambers. The outcomes of these studies inform the field’s understanding of not just urban air quality, but also climate-relevant research. One publication from 2022 examined the oxidation products and SOA formation from the reactions of common oxygenated volatile chemical products (VCPs). In Humes et al. (ES&T 2022), we reported on SOA production from a series of common oxygenated VCPs, including two oxygenated aromatic species, two esters, and four glycol ethers. The acyclic VCPs tend towards fragmentation, whereas aromatic rings drive SOA formation. Therefore, our results suggest that a potential strategy to reduce urban SOA from VCPs would be to reformulate consumer products to include less oxygenated aromatic compounds.
Project 3: Improving Projections of the Spatial and Temporal Changes of Multi-Pollutants to Enhance Assessment of Public Health in a Changing World.
Objective 1. We developed a daily PM2.5 land-use regression model at 1 × 1 km2 spatial resolution across the eastern US (east of 90° W) for 2008 with the aid of daily 36 × 36 km2 WRF-Chem output, 1 × 1 km2 satellite (MAIAC) aerosol optical depth (AOD) data, 1 × 1 km2 land-use type from the National Land Cover Database, and 0.125° × 0.125° ERA-Interim re-analysis meteorology incorporated into a multiple-linear regression model trained to surface observations of PM2.5 from the EPA Air Quality System monitoring network. Our model generates high-fidelity estimates of daily PM2.5 (r2 = 0.75 using a 10-fold cross-validation). WRF-Chem and gap-filling missing AOD pixels, using a merging of seasonal averages and ground monitor measurements, are the two largest contributors to the model skill. By downscaling chemical transport model output with satellite data and other spatiotemporal predictors, we can better fit the needs of those linking PM2.5 to health outcomes, which are needed at high spatial resolution (i.e., ZIP code or county level). This 1 × 1 km2 PM2.5 product is now available for epidemiological studies and has been provided to the CACES team for an inter-Center intercomparison. We developed a high-resolution NO2 dataset based on measurements from the Ozone Monitoring Instrument satellite. This new dataset, derived from a 1.33 km simulation and DISCOVER-AQ Maryland observations, yields NO2 that is two times larger in urban areas and 20 – 40% lower in rural areas. Furthermore, the new NO2 dataset retrievals are now able to capture the magnitude of the concentration gradient between urban and rural areas, which is in better agreement with the current EPA NO2 monitoring network. A similar dataset was then used to calculate decadal trends of NO2 and NOx emissions in eight US cities. Decreases in NOx emissions derived from the satellite are observed across the eight cities from 2006 to 2017 (−17% in Miami to−58% in Los Angeles (LA)), and are generally consistent with long-term trends of bottom-up inventories (−25% in Miami to−49% in LA), but there are some interannual discrepancies, e.g., a larger than estimated decrease in 2009-2010 recession.
Measurements from a new satellite, the Tropospheric Monitoring Instrument (TROPOMI) became available (in May 2018) and we used TROPOMI NO2 data to estimate NOx emissions from two large power plants and three cities in North America. For the two power plants, satellite-based NOx emissions agree to within 10% of the emissions reported by the power plants. For the US cities, we found agreement with the EPA inventory within reasonable uncertainty bounds: +22% overestimate for New York City, and -5% underestimate in Chicago. As TROPOMI continues to observe our atmosphere, we can expect to develop more estimates of NOx emissions for cities and power plants worldwide that can be especially helpful for scientists and policymakers in assessing the effectiveness of regulations on NOx emissions.
Objective 2. Using WRF-Chem simulations in our project, we found that O3 level is much higher during heat waves, atmospheric stagnation, and their compound events compared to the non-extreme period. Compound events significantly enhance O3 as both high temperature and low wind speed promote production of high O3 level. In regions with high emissions, compound events can shift the high-end tails of the probability density functions of O3 to even higher values to generate extreme O3 episodes. Despite the large anthropogenic emission reduction projected for the future, compound events increase O3 more than the single events and high O3 episodes with maximum daily 8-hr average O3 > 70 ppbv are not eliminated. We further investigated the impact of compound extreme weather events on O3 enhancement in the contiguous U.S. (CONUS) under Technology Driver Model A1B and B2 scenarios, with a focus on contrasting the effects of climate change and emission change on O3 under heat wave and stagnation. With overall warming in the future, the frequency and intensity of compound extreme events increase more than that of heat waves, so compound events promote higher O3 concentration compared to the single extreme events in larger areas of the U.S. in the future. However, averaged over the U.S., the amplification effect of compound events on O3 enhancement is diminished in the future. By examining the nonlinear effect of compound events, defined as the difference between the enhanced effect on O3 during compound events and the additive effect of heat waves and stagnation relative to non-extreme, this study showed that regions prone to positive nonlinear effect tend to have compound events marked by higher temperature and stronger stagnation than the single extreme events. Simulations showed reduced mean positive nonlinear effect in the future, suggesting that future emission reduction may provide a previously unrecognized benefit in O3 pollution control by reducing the impacts of compound events on O3. We used a novel approach to isolate the impacts of mean warming and changes in the higher-order moments of temperature on O3 over the southeastern U.S. (SEUS) and western U.S. (WUS) by the mid-21st century based on the WRF-Chem simulations under Technology Driver Model A1B and B2 scenarios. Mean warming generally dominates the impacts of climate change on O3, but the opposite changes in the higher-order moments of temperature over SEUS and WUS lead to opposite impacts on O3 exceedance in the two regions. This study suggests that improving prediction of both the mean and higher-order temperature changes may be crucial to constraining the future changes in O3 concentration to better inform air quality policy.
Objective 3. To improve modeling of fire emissions and their future changes, we constructed a machine learning (ML) model with game-theory interpretation to estimate monthly fire emissions at 0.25o resolution over the contiguous U.S. and to understand the controlling factors of fire emissions. Similar to the ML model for burned area, the ML model for fire emissions is based on the eXtreme Gradient Boosting (XGBoost) method and includes predictor variables similar to those used in the burned area model, including local meteorology, large-scale meteorological patterns, land-surface properties, and socioeconomic variables. The model is trained using monthly fire PM2.5 emission data obtained from the Global Fire Emissions Database (GFED) at 0.25 o resolution. Overall, the ML model can well reproduce the spatial pattern and interannual variability of fire emissions at 0.25° resolution over CONUS. The ML model is used to diagnose the process-based models in the Fire Modeling Intercomparison Project (FireMIP) to inform future development. More recently, we constructed a neural network (NN) model explained by the Shapley Additive explanation (SHAP) to predict fire PM2.5 emissions change and understand their drivers over CONUS in the mid-21st century under a high greenhouse gas emissions scenario (SSP5-8.5). The NN model has five layers, including one input layer with 25 neurons corresponding to the 25 predictors, three hidden layers with 200, 150, and 80 neurons, and one output layer corresponding to the predicted fire emission.
Using future meteorology and leaf area index (LAI) simulated by eight global climate models from the Coupled Model Intercomparison Project Phase 6 (CMIP6), future population density, and present-day land use and land cover (LULC) as input to the NN model, the total fire PM2.5 emissions over CONUS are projected to increase by 4-75% (model spread). Among different regions, fire emissions in the western U.S. are projected to increase more significantly in June-July-August than in other seasons and regions, with the median ratios of future to present-day fire emissions ranging from 1.67 to 2.86. The increases in fire emissions are mainly driven by increasing normalized temperature (23-29%) and decreasing soil moisture (2-10%) in the future. When future LULC change is considered, the projected fire emissions further increase by 58%-83% over the western US compared to projections without LULC change because of future increases in vegetation fraction. The results highlight the important role of warmer temperature, decreasing soil moisture, and LULC change in increasing fire emissions in the future.
Objective 4. To achieve this objective, one offline model (CMAQ) and four online coupled models (WRF-Chem, WRF-Chem-ROMS, WRF-CAM5, and two-way WRF/CMAQ) are used. Our initial applications of several regional models showed moderate to large biases in simulating surface concentrations of O3 and PM2.5. We took critical steps to improve these models in their inputs, formulations, and configurations. The major improvements in model inputs include updated chemical boundary conditions (BCONs) and the use of chemical BCONs for CO constrained by satellite retrievals for all models, and replacing the fire emissions in national emissions inventories with FINN fire emissions. Improved model formulations include a bug fix in the nucleation scheme of the MADE aerosol module in the NOAA’s released version of WRF/Chem v3.7.1 that caused sulfate mass imbalance, adjustment of the emission factor in the DEAD dust emission scheme used in WRF-CAM5, an updated cloud fraction calculation in WRF-CMAQ, and updated WRF/Chem v3.6.1 to WRF/Chem 3.7.1 in WRF/Chem-ROMS. Improved model configuration is the use of a more advanced Multi-scale Kain-Fritsch scheme cumulus scheme available in WRF/Chem v3.7.1. Using improved models, we performed the simulations for 5-year period (2008-2012) and evaluate their performance using surface and satellite data. We also explored two ensemble methods: a simple ensemble method with an equal weighting factor, and a multi-linear ensemble method with unequal weighting factors for all five models. The normalized mean biases (NMBs) for simulated maximum 8-hr average O3 concentrations are within ±15% for all models except offline-CMAQ. The NMBs for simulated 24-hr average PM2.5 are all within ±14% for all models except WRF-CAM5. Using ensemble methods effectively reduce the NMBs and root mean square errors, in particular, the multi-linear ensemble method gives the overall best performance among all model predictions.
Objective 5. To achieve this objective, one offline model (CMAQ) and one online coupled model (WRF-Chem) are used. We generated model-ready emissions using the emission change factors from Project 1 and SMOKE for multi-decades (i.e., 2020, 2030, 2040, and 2050) under five major energy transition scenarios including the reference scenario without the clean power plan (refnocpp), the “abundant natural gas” scenario (highNG), the “high electric vehicles penetration” scenario (highEV), the “port electrification” scenario (port), and “high energy efficiency” scenario (highEE). The projected domain-mean reductions in future (2048-2052) relative to current (2012-2018) under the refnocpp scenario are 1.6 ppb (4.1%) for max 8-h O3 and up to 1.1 mg m-3 (17.5%) for 24-h average PM2.5. While the PM2.5 level is projected to decrease over CONUS, max 8-h O3 is projected to decrease in most areas in CONUS (where O3 chemistry is NOx-limited) but increase in major cities (where O3 chemistry is VOC-limited). In NOx-limited areas, large reduction of NOx leads to large reduction of O3. By contrast, in VOCs-limited areas, larger reduction of NOx than reduction of VOCs leads to O3 increases, which offset the O3 reduction caused by the VOCs emission reduction. Compared to the refnocpp scenario, highEV, port, and highEE show wide-spread decreases of max 8-h O3. For comparison, the max 8-h O3 trend for the highNG scenario shows heterogeneity with larger increases over states/regions such as KY, PA, IL, IN, TX, and LA where higher natural gas/oil production is projected, but decreases over NOx-limited regions such as the southeastern U.S. where large decreases of NOx emissions occur. The reductions of PM2.5 are more apparent for highNG and highEE scenarios when compared to the refnocpp scenario, which are also consistent with their precursor emission changes. Overall, the highEE scenario shows the largest decrease of both O3 and PM2.5 (up to 3.9% and 22.6%, respectively, more reduction compared to refnocpp), indicating that this scenario has potentially the largest human health benefits.
Objective 6 (SEARCH-CACES Collaborative Project). To achieve this objective, two CTMs (offline CMAQ and WRF-Chem) and two RCMs (AP3 and InMAP) are used. This collaboration project focuses on the comparison of health impacts estimated based on complex chemical transport models (CTMs) + health model vs. reduced complexity air-quality models (RCMs). We used two CTMs (online WRF/Chem and offline WRF-CMAQ) with the Environmental Benefits Mapping and Analysis Program Community Edition (BenMAP-CE) and two RCMs including the AirPollution Emission Experiments and Policy Analysis Version 3 (AP3) and the Intervention Model for Air Pollution (InMAP). For each model, we estimate the health effects and benefit costs induced by PM2.5 over the CONUS under baseline emission scenario (NEI2011) and future energy transition scenarios (2050). CMAQ and WRF-Chem give similar spatial distribution and also domain total avoided mortality (within 2%). There are some differences between the spatial distributions estimated by the two RCMs, with the differences of 18.8% in their domain total estimates. Larger differences exist in the spatial distributions estimated by CTM and RCM approaches, in particular, for regions with high oil/gas productions, where RCMs predict increased mortality whereas CTMs predict avoided mortality. Moderate to large differences also exist in the domain total changes in mortality between CTM and RCM estimates (e.g., WRF-Chem and AP3 estimates differ by 10% and WRF-Chem and AP3 estimates differ by 27%). In general, CTM+BenMap gives higher avoided mortality than RCMs under all scenarios.
Project 4: Human Health Impacts of Energy Transitions: Today and Under a Changing World
We linked changes in air quality, from Project 3, based on different emissions scenarios, from Project 1, to estimated health impacts. These emission scenarios were developed in collaboration with state and regional air quality decision-makers through efforts with the Policy and Decision-Making Unit. This will make the findings highly relevant for real-world decision-making. Currently, we are still completing the analysis linking these many parts of the Center, and a manuscript is underway. The SAC encouraged us to consider many emissions scenarios and the associated economic costs. Below we highlight a subset of our work.
We conducted several studies related to the development of new methodology for epidemiological analysis of the health consequences of air pollution and ambient temperature. In Kim et al. (2021), we discuss adjustment methods for seasonality and time-trend used in time-series analysis in environmental epidemiology and explain why standard errors can be inflated. We suggest alternative methods to solve this problem. We conduct simulation analyses based on real data to identify whether the association between long-term exposure and health outcomes can be estimated via time-series analysis with alternative adjustment methods. Our findings suggest that time-series analysis with case-only data can be applied for estimating long-term exposure effects.
Another methodological paper was conducted in collaboration with the Environmental Data Science Unit. The control of ambient air quality in the United States has been a major public health success since the passing of the Clean Air Act, with particulate matter reductions resulting in an estimated 160,000 premature deaths prevented in 2010 alone. Currently, public policy is oriented around lowering the levels of individual pollutants and this focus has driven the nature of much epidemiological research. Recently, attention has been given to viewing air pollution as a complex mixture and to developing a multi-pollutant approach to controlling ambient concentrations. We present a statistical approach for estimating the health impacts of complex environmental mixtures using a mixture-altering contrast, which is any comparison, intervention, policy, or natural experiment that changes a mixture's composition. We combine the notion of mixture-altering contrasts with sliced inverse regression, propensity score matching, and principal stratification to assess the health effects of different air pollution chemical mixtures. This work is published in Peng et al. (2022).
Much of our work examines disparities in exposure to environmental conditions and disparities in the health consequences of environmental conditions. The disproportionate environmental health burden (i.e., environmental justice) is a central theme in much of our work. Below we highlight a few of the many environmental justice studies from this project. In Bravo et al. (2022), we assessed whether overall improvements in air quality are equitably distributed across subpopulations. We assessed spatial variability and temporal trends in concentrations of PM2.5 and ozone across North Carolina from 2002-2016, and associations with community characteristics. We fitted hierarchical Bayesian space-time models to estimate baseline concentrations of and time trends in PM2.5 and ozone for each tract, accounting for spatial between-tract correlation. Tracts with lower educational isolation and higher urbanicity had higher PM2.5 and more pronounced declines in PM2.5. Racial isolation was associated with higher PM2.5 but not with the rate of decline in PM2.5. Despite declines in pollutant concentrations, over time, disparities in exposure increased for racially and educationally isolated communities. We also examined disparities in exposure to air pollution in Kodros et al. (2022). In that work, based on the U.S., we found that populations living in racially segregated communities are exposed to a form of fine particulate matter with over three times higher mass proportions of known toxic and carcinogenic metals. A recently accepted paper (Deziel et al. 2022) evaluated the spatial distribution, variability, and relationships among different metrics of social vulnerability and isolation across urban and rural settings to inform interpretation and selection of metrics for environmental disparity research.
Another key feature of Project 4 is systematic review and meta-analysis. A systematic review and meta-analysis (Heo et al. 2022), synthesizes the state of scientific evidence on whether cardiovascular risks from PM2.5 differ for men compared to women. We searched for observational studies that included subgroup analysis by sex for impacts of short-term or long-term exposure to PM2.5 on target cardiovascular outcomes. A total of 12,502 articles were screened, with 61 meeting inclusion criteria. An additional 32 studies were added from citation chaining. RRs of all cardiovascular mortality per 10 mg/m3 long-term PM2.5 for men and women were the same (1.14; 95% CI: 1.09, 1.22) indicating no statistically different risks. Men and women did not have statistically different risks of daily cardiovascular mortality, hospitalizations from all CVD, ischemic heart disease, cardiac arrest, acute myocardial infarction, and heart failure from short-term PM2.5 exposure (difference in % change in risk per 10 µg/m3 PM2.5: 0.04 (95% CI, −0.42–0.51); −0.05 (−0.47–0.38); 0.17 (−0.90, 1.24); 1.42 (−1.06, 3.97); 1.33 (−0.05, 2.73); and −0.48 (−1.94, 1.01), respectively). In conclusion, this meta-analysis and quality of evidence assessment of current observational studies found very limited evidence of the effect modification by sex for effects of PM2.5 on CVD outcomes in adults, which can inform clinical approaches and policies.
Another review (Fong et al., 2022) focused on the intersection of immigrant and environmental health. Transnational immigration has increased since the 1950s. In countries such as the United States, immigrants now account for >15% of the population. Although differences in health between immigrants and nonimmigrants are well documented, it is unclear how environmental exposures contribute to these disparities. Immigrants is an understudied aspect of environmental justice, and is particularly important in relation to intersectionality where multiple aspects of disparities are present (e.g., race, immigrant status, socio-economic status). In this paper, we summarized current knowledge comparing immigrants’ and nonimmigrants’ exposure to and health effects of environmental exposures. We conducted a title and abstract review on 3,705 articles, a full text review on 84, and extracted findings from 50 studies. There were 43 studies that investigated exposure (e.g., metals, organic compounds, fine particulate matter, hazardous air pollutants) disparities, but only 12 studies that assessed health disparities (e.g., mortality, select morbidities). Multiple studies reported higher exposures in immigrants compared with nonimmigrants. Among immigrants, studies sometimes observed exposure disparities by country of origin and time since immigration. Of the 50 studies, 43 were conducted in North America. The environmental health of immigrants remains an understudied area, especially outside of North America. This work adds to our earlier research on immigrants and environmental health (see Fong et al. 2020 and 2021).
While a growing body of literature suggests beneficial impacts of greenness on several health outcomes, relatively few studies have examined greenness as an effect modifier to impacts of air pollution on health outcomes, and results from the existing studies are inconclusive. We performed a comprehensive, systematic review of previous literature on greenness as a potential effect modifier for associations between particulate matter air pollution and health (Heo et al, 2021). After initial screening of 7814 studies, we identified 20 eligible studies. We summarized findings on study characteristics based on several criteria: health outcome, air pollution exposure, source of air pollution data, study location, study period, and median year of the study period. Our systematic review showed that only a limited number of studies have been conducted on greenness as an effect modifier for air pollution-health associations. Collectively, the studies provide suggestive evidence for the hypothesis that areas with high greenness have lower impacts of air pollution on health, although some studies reported inconsistent findings.
These reviews add to our other published systematic reviews and meta-analyses as part of this project, such as reviews on mother’s exposure to particulate matter during pregnancy and risk of birth outcomes (Heo et al. 2019), suicide in relation to air pollution and ambient temperature (Heo et al. 2021), the role of residential greenness in the association between air pollution and health (Son et al. 2021), and effect modification of the association between temperature and mortality (Son et al. 2019).
We performed work on greenspace and health including research related to environmental justice, different types of greenspace (e.g., forests, urban parts, agricultural lands), associations between exposure to greenspace. For example, in Choi et al. (2022), we linked daily temperature and mortality data for 452 locations in 24 countries with data on Enhanced Vegetation Index (EVI) as the greenspace measurement. We used distributed lag non-linear model to estimate the heat-mortality relationship in each city and the estimates were pooled adjusting for city-specific average temperature, city-specific temperature range, city-specific population density, and gross domestic product (GDP). Cities with high greenspace value had the lowest heat-mortality relative risk of 1·19 (95% CI: 1·13, 1·25), while the heat-related relative risk was 1·46 (95% CI: 1·31, 1·62) for cities with low greenspace when comparing the 99th temperature and the minimum mortality temperature.
Given the pandemic, we have shifted some research to investigate the links between COVID-19 and air pollution. Publications on this topic include a population-based case-crossover study using individual-level mortality to examine the association between short-term exposure to air pollution and risk of COVID-19 mortality (Kim et al. 2022). A key strength of this study is the use of data at the individual-level with COVID-19 deaths as confirmed by the Cook County Medical Examiner’s Office. We aimed to examine whether short-term exposure to air pollution is associated with risk of mortality from COVID-19 for those infected with COVID-19. Case-crossover analysis was conducted to estimate the associations of estimated short-term exposures to PM2.5 and ozone on the day of death and up to 21 days before death at location of death with COVID-19. We adjusted for potential confounders by time-stratified case-crossover design and by covariate adjustments (i.e., time-invariant factors, meteorological factors, viral transmission, seasonality, and time trend). Findings indicate that short-term exposure to air pollution below the NAAQS may increase the mortality burden from COVID-19. Our other work related to the pandemic as part of the SEARCH Center includes analysis of COVID-19 in combined sewer systems (CSS) (Chan et al. 2022) and analysis of the changed use of greenspace during the pandemic in relation to depression and anxiety (Heo et al. 2021). These studies add to our many papers on COVID-19 from this and other SEARCH projects.
We considered health outcomes that are understudied compared to the more commonly examined endpoints of hospital admissions and mortality, such as kidney diseases, osteoporosis-related fracture, and suicide. For example, in Heo et al. (2022), we assessed the associations between long-term air pollution exposure and risk of osteoporotic fracture using Cox proportional hazard models to estimate hazard rations of time-varying moving window of past exposures of PM10, SO2, CO, NO2, and ozone for osteoporotic fracture for adults (age ≥ 50 years). Comorbidity and prescription associated with osteoporosis, age, sex, body mass index, health behaviors, and income were adjusted in the models. Other work from this project examined residential exposure to petroleum refining and stroke in the southern U.S., new insights for tracking global and local trends in exposure to air pollutants, stormwater control measures and combined sewer outfalls after heavy rainfalls, temporal trends in the associatitons between short-term exposure to PM2.5 and risk of hospitalizations by subpopulations and urbanicity as part of a collaborative project with the Harvard/MIT ACE Center, pollution inequality, and the effects of urbanization on vulnerability to heat-related mortality in urban and rural areas.
We conducted research on concentrated animal feeding operations (CAFOs) with work on environmental justice in relation to exposure to CAFOs in several states. In Son and Bell (2023), we examined disparities in exposure to AFOs including concentrated AFOs (CAFOs) with several environmental justice metrics and considered exposure intensity based on animal units (AUs). Using data on permitted AFOs from the Iowa Department of Natural Resources, we evaluated environmental disparities by multiple environmental justice metrics (e.g. race/ethnicity, socio-economic status (SES), income inequality (Gini index), racial isolation, and educational isolation). AFOs in Iowa were located in areas with lower percentages of racial/ethnic minority persons and high SES communities. For example, the percent of the population that is non-Hispanic Black was over 9 times higher in Census tracts without AFOs than tracts with AFOs (5.14% vs. 0.55%). However, when we considered AFO exposure intensity within the areas having AFO exposure, areas with higher AFO exposure had higher percentages of racial/ethnic minority persons (e.g. Hispanic) and low SES communities (e.g. higher educational isolation) compared to areas with lower AFO exposure. We identified complex disparities with higher exposure to non-disadvantaged subpopulations when considering areas with versus without AFOs, but higher exposure to disadvantaged communities within areas with AFOs. In Son et al. (2021), we examined disparities by exposure to CAFOs using several environmental justice metrics and considering potentially vulnerable subpopulations for North Carolina. Our findings indicate that CAFOs are located disproportionately in communities with higher percentage of minorities and in low-income communities. Distributions of environmental justice metrics generally showed similar patterns for both exposure methods, however starker disparities were observed using a buffer method. Our findings of the disproportionate location of CAFOs provide evidence of environmental disparities with respect to race and socioeconomic status in NC and have implications for future studies of environmental and health impacts of CAFOs.
FSU1 - Facility Support Unit 1: Environmental Data Science Facility Support Unit.
Some of our work and publications is in direction response to the Scientific Advisory Committee (SAC) feedback. For example, the SAC noted “We encourage continued development of hyper-local spatial-temporal calibration of PM methods and approaches, that should streamline QA/QC for the SEARCH monitoring network in Baltimore area, and possibly be applicable to other sensor networks.” This work has now been submitted to the Annals of Applied Statistics and received a favorable review. We have since then revised and re-submitted the paper. This project was conducted jointly with Project 2 in the SEARCH Center.
The SAC also noted that “The work exploring spectral decomposition methods to understand the performance of exposure models in the context of health studies is very valuable. This point was made clear in the discussion of how model uncertainty might influence the different time trends of health effects for different population groups….” We have completed work on our spectral decomposition methods for evaluating air pollution prediction models from the perspective conducting health effects studies. We developed a new metric for evaluating prediction models called “frequency band model performance”. In simulations, frequency band model performance characterizes predictions better (lower RMSE, higher correlation) when there is no error at a particular timescale (e.g., acute) and worse when error is added to that timescale, compared to overall approaches. Further, frequency band model performance is more strongly associated (R2 = 0.95) with health association bias compared to overall approaches (R2 = 0.57). For PM2.5 predictions in Salt Lake City, UT, frequency band model performance better identifies acute error that may impact estimated short-term health associations. This work was conducted with Dr. Jenna Krall of George Mason University and Dr. Josh Keller of Colorado State University and was recently published in the journal Environmental Health. Dr. Peng also presented on this work in a recent keynote address to the Center for Health and Environment: Education and Research at the University of Texas, Austin.
Our work on developing statistical methods for estimating the health effects of air pollution mixtures reached publication this year with a paper appearing in the journal Statistics in Medicine. We developed a statistical approach for estimating the health impacts of complex environmental mixtures using a mixture-altering contrast, which is any comparison, intervention, policy, or natural experiment that changes a mixture’s composition. We combine the notion of mixture-altering contrasts with sliced inverse regression, propensity score matching, and principal stratification to assess the health effects of different air pollution chemical mixtures. We demonstrated the application of this approach in an analysis of the health effects of wildfire particulate matter air pollution in the Western US. Our application of this method found that the chemical composition of urban PM2.5 appeared to be more strongly associated with respiratory hospitalizations in the Medicare population compared to wildfire PM2.5.
Finally, we have developed in conjunction with Project 2 new methods for evaluating interventions on ambient PM2.5, particularly as applied to the recent COVID-19 pandemic. We outline the assumptions required for identifying the causal changes between and intervention and ambient PM2.5 and show that many common methods often implicitly relied on strong and unrealistic assumptions about relationships between air pollutants and covariates (like meteorology) or used restrictive approaches like linear models. We present flexible machine learning-based interrupted time-series models that do not use restrictive assumptions and produce a causal estimate. For validation, we deploy an empirical diagnostic criterion for any approach, namely guarding against falsely significant effects in past years when there was no intervention. This work was recently submitted to Environmental Health Perspectives.
FSU2 - Facility Support Unit 2: Policy and Decision-Making Facility Support Unit
The Policy and Decision-Making Facility Support Unit was a critical element of the SEARCH Center’s success—it bridged gaps between the scientific community and policymakers to ensure a free flow of information. The Unit worked with key stakeholders in the field of air quality to share with them the latest research generated by the SEARCH research teams—with the ambition that, armed with this research, these stakeholders would be able to fine-tune their states’ policies. In achieving this objective, the Policy Unit facilitated briefing sessions for air quality policymakers at the state and regional levels, featuring research team members from the other arms of the Center.
This flow of information not only provided policymakers with useful tools—it has also allowed the SEARCH research groups to refine their questions, recalibrate their approaches, and supplement their research with feedback from audiences of highly informed policymakers. Critically, this two-way street enables the research teams to ensure that their research has real-world applicability, a key goal of the Policy Unit.
During the grant period, the Policy Unit organized briefing sessions with multistate associations of air quality directors from around the country—which allowed the specific interests of these associations to guide the presentations, ensuring that policymakers are receiving information that is highly aligned to their specific needs.
The Unit’s specific objectives included: (1) helping to ensure that the SEARCH Center produced policy-relevant science by means of engagement of decision making policy leaders; (2) supporting SEARCH researchers with the development of carefully defined energy policy scenarios for use by the various Project Teams; (3) ensuring that the SEARCH research projects connected to real-world policy choices and decision making processes; and (4) disseminating the SEARCH research findings through innovative outreach efforts that effectively connect with policy makers and the general public.
Throughout the grant period, the Policy Unit connected SEARCH Center research teams with multistate associations of air quality and energy policymakers, as well as state-specific agencies. These organizations included the Western States Air Resource Council (WESTAR), to whom Ken Gillingham and Drew Gentner delivered a presentation on March 1, 2021; the Central States Air Resource Agencies (CenSARA), to whom Dan Esty, Drew Gentner, and Ben Hobbs delivered a presentation on April 12, 2021; and the Maryland Department of the Environment, to whom Kirsten Koehler delivered a presentation on March 10, 2021. In February 2020, Project Team 1 conducted a webinar with the Western Regional Air Partnership (WRAP). Following these presentations, staff members at LADCO, NESCAUM, SESARM, and WESTAR/WRAP requested additional research updates that were provided prior to their Spring 2021 meeting.
Journal Articles: 75 Displayed | Download in RIS Format
| Other center views: | All 119 publications | 74 publications in selected types | All 74 journal articles |
|---|
| Type | Citation | ||
|---|---|---|---|
|
|
Armstrong B, Bell ML, de Sousa Zanotti Stagliorio Coelho M, Leon Guo YL, Guo Y, Goodman P, Hashizume M, Honda Y, Kim H, Lavigne E, Michelozzi P. Longer-term impact of high and low temperature on mortality:an international study to clarify length of mortality displacement. Environmental Health Perspectives.2017 Oct 27;125(10):107009 |
R835871 (2018) R835871 (2020) |
|
|
|
Bell M, Banerjee G, Pereira G. Residential mobility of pregnant women and implications for assessment of spatially-varying environmental exposures. JOURNAL OF EXPOSURE SCIENCE & ENVIRONMENTAL EPIDEMIOLOGY 2018;28(5):470-480. |
R835871 (2021) |
Exit Exit |
|
|
Bravo MA, Anthopolos R, Bell ML, Miranda ML. Racial isolation and exposure to airborne particulate matter and ozone in understudied US populations: environmental justice applications of downscaled numerical model output. Environment International 2016;92-93:247-255. |
R835871 (2016) R835871 (2017) R835871 (2020) R835871C004 (2016) |
Exit Exit Exit |
|
|
Bravo MA, Ebisu K, Dominici F, Wang Y, Peng RD, Bell ML. Airborne fine particles and risk of hospital admissions for understudied populations: effects by urbanicity and short-term cumulative exposures in 708 U.S. counties. Environmental Health Perspectives 2017;125(4):594-601. |
R835871 (2016) R835871 (2017) R835871 (2018) R835871 (2020) R835871C004 (2016) R835871C004 (2017) R833863 (Final) R834798 (Final) |
|
|
|
Gentner DR, Xiong F. Tracking pollutant emissions. Nature Geoscience 2017;10(12):883-884. |
R835871 (2018) R835871 (2019) R835871 (2020) R835871C002 (2017) |
Exit Exit Exit |
|
|
Glotfelty T, He J, Zhang Y. Improving organic aerosol treatments in CESM/CAM5: development, application, and evaluation. Journal of Advances in Modeling Earth Systems 2017;9(2):1506-1539. |
R835871 (2017) R835871 (2020) |
Exit Exit |
|
|
Goldberg DL, Lamsal LN, Loughner CP, Swartz WH, Lu Z, Streets DG. A high-resolution and observationally constrained OMI NO2 satellite retrieval. Atmospheric Chemistry & Physics 2017;17(18):11403-11421. |
R835871 (2017) R835871 (2020) |
Exit Exit |
|
|
Goldberg DL, Lu Z, Oda T, Lamsal LN, Liu F, Griffin D, McLinden CA, Krotkov NA, Duncan BN, Streets DG. Exploiting OMI NO2 satellite observations to infer fossil-fuel CO2 emissions from US megacities. Science of the Total Environment 2019;695:133805. |
R835871 (2019) R835871 (2020) |
Exit |
|
|
Guo Y, Gasparrini A, Li S, Sera F, Vicedo-Cabrera AM, Coelho MD, Saldiva PH, Lavigne E, Tawatsupa B, Punnasiri K, Overcenco A. Quantifying excess deaths related to heatwaves under climate change scenarios: a multicountry time series modelling study. PLoS Medicine 2018;15(7). |
R835871 (2019) R835871 (2020) |
|
|
|
He J, He R, Zhang Y. Impacts of Air–sea Interactions on Regional Air Quality Predictions Using a Coupled Atmosphere-Ocean Model in Southeastern US. Aerosol and Air Quality Research. 2018 Apr 1;18:1044-67. |
R835871 (2018) R835871 (2020) |
Exit |
|
|
Heo S, Li L, Son J, Koutrakis P, Bell M. Associations Between Gestational Residential Radon Exposure and Term Low Birthweight in Connecticut, USA. EPIDEMIOLOGY 2024;35(6):834-843 |
R835871 (Final) |
Exit |
|
|
Humes M, Wang M, Kim S, Machesky J, Gentner D, Robinson A, Donahue N, Presto A. Limited Secondary Organic Aerosol Production from Acyclic Oxygenated Volatile Chemical Products. ENVIRONMENTAL SCIENCE TECHNOLOGY 2022;56(8):4806-4815. |
R835871 (2021) R835873 (2020) |
Exit Exit |
|
|
Jin L, Berman JD, Warren JL, Levy JI, Thurston G, Zhang Y, Xu X, Wang S, Zhang Y, Bell ML. A land use regression model of nitrogen dioxide and fine particulate matter in a complex urban core in Lanzhou, China. Environmental Research 2019;177:108597. |
R835871 (2019) R835871 (2020) |
Exit |
|
|
Keet CA, Keller JP, Peng RD. Long-term coarse particulate matter exposure is associated with asthma among children in Medicaid. American Journal of Respiratory & Critical Care Medicine 2018;197(6):737-746. |
R835871 (2017) R835871 (2020) |
Exit |
|
|
Keller JP, Peng RD. Error in estimating area‐level air pollution exposures for epidemiology. Environmetrics 2019;30(8):e2573. |
R835871 (2019) R835871 (2020) |
Exit Exit |
|
|
Khare P, Gentner DR. Considering the future of anthropogenic gas-phase organic compound emissions and the increasing influence of non-combustion sources on urban air quality. Atmospheric Chemistry and Physics 2018;18(8):5391-5413. |
R835871 (2018) R835871 (2019) R835871 (2020) |
Exit |
|
|
Krall JR, Hackstadt AJ, Peng RD. A hierarchical modeling approach to estimate regional acute health effects of particulate matter sources. Statistics in Medicine 2017;36(9):1461-1475. |
R835871 (2017) R835871 (2020) |
Exit |
|
|
Li H, Dailey J, Kale T, Besar K, Koehler K, Katz HE. Sensitive and selective NO2 sensing based on alkyl- and alkylthio-thiophene polymer conductance and conductance ratio changes from differential chemical doping. ACS Applied Materials & Interfaces 2017;9(24):20501-20507. |
R835871 (2017) R835871 (2018) R835871 (2019) R835871 (2020) R835871C002 (2017) |
Exit Exit Exit |
|
|
Li L, Blomberg A, Lawrence J, Requia W, Wei Y, Liu M, Peralta A, Koutrakis P. A spatiotemporal ensemble model to predict gross beta particulate radioactivity across the contiguos United States. ENVIRONMENTAL INTERNATIONAL 2021;456(106643). |
R835871 (2021) |
Exit Exit |
|
|
Lim CC, Hayes RB, Ahn J, Shao Y, Silverman DT, Jones RR, Garcia C, Bell ML, Thurston GD. Long-term exposure to ozone and cause-specific mortality risk in the United States. American Journal of Respiratory and Critical Care Medicine 2019;200(8):1022-1031. |
R835871 (2019) R835871 (2020) R831697 (Final) R838300 (2020) |
Exit Exit |
|
|
Liu JC, Wilson A, Mickley LJ, Dominici F, Ebisu K, Wang Y, Sulprizio MP, Peng RD, Yue X, Son JY, Anderson GB, Bell ML. Wildfire-specific fine particulate matter and risk of hospital admissions in urban and rural counties. Epidemiology 2017;28(1):77-85. |
R835871 (2017) R835871 (2018) R835871 (2020) R834798 (Final) |
Exit |
|
|
Liu JC, Wilson A, Mickley LJ, Ebisu K, Sulprizio MP, Wang Y, Peng RD, Yue X, Dominici F, Bell ML. Who among the elderly is most vulnerable to exposure to and health risks of fine particulate matter from wildfire smoke? American Journal of Epidemiology 2017;186(6):730-735. |
R835871 (2017) R835871 (2018) R835871 (2020) R834798 (Final) R835875 (2017) R835875 (2018) R835875 (2019) |
Exit Exit |
|
|
Liu JC, Peng RD. The impact of wildfire smoke on compositions of fine particulate matter by ecoregion in the Western US. Journal of exposure science & environmental epidemiology. 2018 Sep 5:1. |
R835871 (2018) R835871 (2020) |
Exit |
|
|
Shi W, Zheng Y, Taylor AD, Yu J, Katz HE. Increased mobility and on/off ratio in organic field-effect transistors using low-cost guanine-pentacene multilayers. Applied Physics Letters 2017;111(4):043301. |
R835871 (2017) R835871 (2020) |
Exit |
|
|
Shi W, Yu J, Katz HE. Sensitive and selective pentacene-guanine field-effect transistor sensing of nitrogen dioxide and interferent vapor analytes. Sensors and Actuators B: Chemical 2018;254:940-948. |
R835871 (2017) R835871 (2020) |
Exit |
|
|
Silva GS, Warren JL, Deziel NC. Spatial modeling to identify sociodemographic predictors of hydraulic fracturing wastewater injection wells in Ohio census block groups. Environmental Health Perspectives 2018;126(6):067008 (8 pp.). |
R835871 (2018) R835871 (2020) CR839249 (2018) CR839249 (2019) CR839249 (Final) |
|
|
|
Son JY, Liu JC, Bell ML. Temperature-related mortality:a systematic review and investigation of effect modifiers. Environmental Research Letters 2019;14(7):073004. |
R835871 (2019) R835871 (2020) R835871 (2021) |
Exit Exit |
|
|
Son J-Y, Lane KJ, Lee J-T, Bell ML. Urban vegetation and heat-related mortality in Seoul, Korea. Environmental Research 2016;151:728-733. |
R835871 (2017) R835871 (2020) |
Exit Exit Exit |
|
|
Son J-Y, Lee HJ, Koutrakis P, Bell ML. Pregnancy and lifetime exposure to fine particulate matter and infant mortality in Massachusetts, 2001–2007. American Journal of Epidemiology 2017;186(11):1268-1276. |
R835871 (2017) R835871 (2018) R835871 (2020) |
Exit Exit |
|
|
Son J-Y, Lee J-T, Bell ML. Is ambient temperature associated with risk of infant mortality? A multi-city study in Korea. Environmental Research 2017;158:748-752. |
R835871 (2017) R835871 (2020) |
Exit Exit Exit |
|
|
Vicedo-Cabrera A, Guo Y, Sera F, Huber V, Schlesner C, Mitchell D, Tong S, Coelho M, Saldiva P, Lavigne E, Correa P, Ortega N, Kan H, Osorio S, Kysely J, Urban A, Jaakkola J, Ryti N, Pascal M, Goodman PG, Zeka A, Michelozzi P, Scortichini M, Hashizume M, Honda Y, Hurtado-Diaz M, Cruz J, Seposo X, Kim H, Tobias A, Iniguez C, Forsberg B, Astrom DO, Ragettli MS, Roosli M, Guo YL, Wu CF, Zanobetti A, Schwartz J, Bell ML, Dang TN, Van DD, Heaviside C, Vardoulakis S, Hajat S, Haines A, Armstrong B, Ebi KL, Gasparrini A. Temperature-related mortality impacts under and beyond Paris Agreement climate change scenarios. CLIMATIC CHANGE 2018;150(3-4):391-402. |
R835871 (2021) |
Exit Exit |
|
|
Warren J, Son JY, Leaderer BP, Bell ML. Investigating the impact of maternal residential mobility on identifying critical windows of susceptibility to ambient air pollution during pregnancy. American Journal of Epidemiology 2017; 187(5):992-1000. |
R835871 (2018) R835871 (2019) R835871 (2020) |
|
|
|
Yahya K, Glotfelty T, Wang K, Zhang Y, Nenes A. Modeling regional air quality and climate: improving organic aerosol and aerosol activation processes in WRF/Chem version 3.7.1. Geoscientific Model Development 2017;10(6):2333-2363. |
R835871 (2017) R835871 (2020) |
Exit Exit Exit |
|
|
Zhang J, Gao Y, Luo K, Leung LR, Zhang Y, Wang K, Fan J. Impacts of compound extreme weather events on ozone in the present and future. Atmospheric Chemistry and Physics (Online). 2018 Jul 13;18(PNNL-SA-135886). |
R835871 (2018) R835871 (2020) |
|
|
|
Esty DC, ML Bell. Business Leadership in Global Climate Change Responses . American Journal of Public Health2018;108(S2):S80-S84. |
R835871 (2018) R835871 (2020) |
Exit |
|
|
Levy Zamora M, Xiong F, Gentner D, Kerkez B, Kohrman-Glaser J, Koehler K. Field and laboratory evaluations of the low-cost plantower particulate matter sensor. Environmental Science & Technology 2018;53(2):838-849. |
R835871 (2018) R835871 (2019) R835871 (2020) |
Exit Exit |
|
|
Keet CA, Keller JP, Peng RD. Long-term coarse particulate matter exposure is associated with asthma among children in Medicaid. American Journal of Respiratory and Critical Care Medicine. 2018 Mar 15;197(6):737-46. |
R835871 (2018) R835871 (2020) |
Exit Exit |
|
|
Gong X, Lin Y, Bell ML, Zhan FB. Associations between maternal residential proximity to air emissions from industrial facilities and low birth weight in Texas, USA. Environment International 2018;120:181-198. |
R835871 (2019) R835871 (2020) |
Exit |
|
|
Tang Z, Zhang H, Bai H, Chen Y, Zhao N, Zhou M, Cui H, Lerro C, Lin X, Lv L, Zhang C. Residential mobility during pregnancy in Urban Gansu, China. Health & Place 2018;53:258-263. |
R835871 (2019) R835871 (2020) |
|
|
|
Heo S, Bell ML, Lee JT. Comparison of health risks by heat wave definition: applicability of wet-bulb globe temperature for heat wave criteria. Environmental Research 2019;168:158-170. |
R835871 (2018) R835871 (2019) R835871 (2020) |
Exit Exit |
|
|
Gillingham K, Huang P. Is abundant natural gas a bridge to a low-carbon future or a dead-end?. The Energy Journal 2019;40(2). |
R835871 (2018) R835871 (2019) R835871 (2020) |
Exit Exit |
|
|
Nori-Sarma A, Benmarhnia T, Rajiva A, Azhar GS, Gupta P, Pednekar MS, Bell ML. Advancing our understanding of heat wave criteria and associated health impacts to improve heat wave alerts in developing country settings. International Journal of Environmental Research and Public Health 2019;16(12):2089. |
R835871 (2019) R835871 (2020) |
Exit Exit |
|
|
Berman JD, Jin L, Bell ML, Curriero FC. Developing a geostatistical simulation method to inform the quantity and placement of new monitors for a follow-up air sampling campaign. Journal of exposure science & environmental epidemiology. 2019 Mar;29(2):248. |
R835871 (2018) R835871 (2020) |
Exit |
|
|
Berman JD, Jin L, Bell ML, Curriero FC. Developing a geostatistical simulation method to inform the quantity and placement of new monitors for a follow-up air sampling campaign. Journal of Exposure Science & Environmental Epidemiology 2019;29(2):248-257. |
R835871 (2019) |
Exit |
|
|
Berman JD, Jin L, Bell ML, Curriero FC. Developing a geostatistical simulation method to inform the quantity and placement of new monitors for a follow-up air sampling campaign. Journal of exposure science & environmental epidemiology. 2019 Mar;29(2):248. |
R835871 (2018) R835871 (2020) |
Exit |
|
|
Goldberg DL, Lu Z, Streets DG, de Foy B, Griffin D, McLinden CA, Lamsal LN, Krotkov NA, Eskes H. Enhanced capabilities of TROPOMI NO2:estimating NOx from North American cities and power plants. Environmental Science & Technology 2019;53(21):12594-12601. |
R835871 (2019) R835871 (2020) |
Exit |
|
|
Heo S, Bell ML. Heat waves in South Korea:differences of heat wave characteristics by thermal indices. Journal of Exposure Science & Environmental Epidemiology 2019;29(6):790-805. |
R835871 (2019) R835871 (2020) |
Exit |
|
|
Sera F, Armstrong B, Tobias A, Vicedo-Cabrera AM, Åström C, Bell ML, Chen BY, de Sousa Zanotti Stagliorio Coelho M, Matus Correa P, Cruz JC, Dang TN. How urban characteristics affect vulnerability to heat and cold:a multi-country analysis. International Journal of Epidemiology 2019;48(4):1101-1112. |
R835871 (2019) R835871 (2020) |
Exit |
|
|
Son JY, Lee JT, Lane KJ, Bell ML. Impacts of high temperature on adverse birth outcomes in Seoul, Korea:disparities by individual-and community-level characteristics. Environmental Research 2019;168:460-466. |
R835871 (2019) R835871 (2020) |
|
|
|
Chen G, Wang A, Li S, Zhao X, Wang Y, Li H, Meng X, Knibbs LD, Bell ML, Abramson MJ, Wang Y. Long-term exposure to air pollution and survival after ischemic stroke:the China national stroke registry cohort. Stroke 2019;50(3):563-570. |
R835871 (2019) R835871 (2020) |
|
|
|
Heo S, Fong KC, Bell ML. Risk of particulate matter on birth outcomes in relation to maternal socio-economic factors:a systematic review. Environmental Research Letters 2019;14(12):123004. |
R835871 (2019) R835871 (2020) |
Exit Exit |
|
|
Anderson GB, Barnes EA, Bell ML, Dominici F. The future of climate epidemiology:opportunities for advancing health research in the context of climate change. American Journal of Epidemiology 2019;188(5):866-872. |
R835871 (2019) R835871 (2020) R835872 (2019) R835872C004 (Final) |
Exit |
|
|
Nori-Sarma A, Anderson GB, Rajiva A, ShahAzhar G, Gupta P, Pednekar MS, Son JY, Peng RD, Bell ML. The impact of heat waves on mortality in Northwest India. Environmental Research 2019;176:108546. |
R835871 (2019) R835871 (2020) |
Exit |
|
|
Heo S, Bell ML. The influence of green space on the short-term effects of particulate matter on hospitalization in the US for 2000–2013. Environmental Research 2019;174:61-68. |
R835871 (2019) R835871 (2020) |
Exit |
|
|
Yan M, Wilson A, Bell ML, Peng RD, Sun Q, Pu W, Yin X, Li T, Anderson GB. The shape of the concentration-response association between fine particulate matter pollution and human mortality in Beijing, China, and its implications for health impact assessment. Environmental Health Perspectives 2019;127(6):067007. |
R835871 (2019) R835871 (2020) |
|
|
|
Heo S, Nori-Sarma A, Lee K, Benmarhnia T, Dominici F, Bell ML. The use of a quasi-experimental study on the mortality effect of a heat wave warning system in Korea. International Journal of Environmental Research and Public Health 2019;16(12):2245. |
R835871 (2019) R835871 (2020) |
|
|
|
Goldberg DL, Gupta P, Wang K, Jena C, Zhang Y, Lu Z, Streets DG. Using gap-filled MAIAC AOD and WRF-Chem to estimate daily PM2.5 concentrations at 1 km resolution in the Eastern United States. Atmospheric Environment 2019;199:443-452. |
R835871 (2019) R835871 (2020) |
Exit Exit |
|
|
Baklanov A, Zhang Y. Advances in air quality modeling and forecasting. Global Transitions 2020;2:261-70. |
R835871 (2020) |
Exit |
|
|
Woo SH, Liu JC, Yue X, Mickley LJ, Bell ML. Air pollution from wildfires and human health vulnerability in Alaskan communities under climate change. Environmental Research Letters 2020;15(9):094019. |
R835871 (2020) |
Exit Exit |
|
|
Khare P, Machesky J, Soto R, He M, Presto AA, Gentner DR. Asphalt-related emissions are a major missing nontraditional source of secondary organic aerosol precursors. Science advances 2020;6(36):eabb9785. |
R835871 (2020) |
Exit |
|
|
Fong KC, Mehta NK, Bell ML. Disparities in exposure to surrounding greenness related to proportion of the population that were immigrants to the United States. International Journal of Hygiene and Environmental Health 2020;224:113434. |
R835871 (2019) R835871 (2020) |
Exit Exit |
|
|
Rogers HM, Ditto JC, Gentner DR. Evidence for impacts on surface-level air quality in the northeastern US from long-distance transport of smoke from North American fires during the Long Island Sound Tropospheric Ozone Study (LISTOS) 2018. Atmospheric Chemistry and Physics 2020;20(2):671-82. |
R835871 (2020) |
Exit Exit |
|
|
Zhang Y, Yang P, Gao Y, Leung RL, Bell ML. Health and economic impacts of air pollution induced by weather extremes over the continental US. Environment International 2020;143:105921. |
R835871 (2020) |
Exit |
|
|
Sheu R, Stonner C, Ditto JC, Klüpfel T, Williams J, Gentner DR. Human transport of thirdhand tobacco smoke:a prominent source of hazardous air pollutants into indoor nonsmoking environments. Science Advances 2020;6(10):eaay4109. |
R835871 (2019) R835871 (2020) |
Exit Exit |
|
|
Gillingham KT, Huang P. Long-Run Environmental and Economic Impacts of Electrifying Waterborne Shipping in the United States. Environmental Science & Technology 2020;54(16):9824-33. |
R835871 (2020) |
Exit |
|
|
Nori-Sarma A, Thimmulappa RK, Venkataramana GV, Fauzie AK, Dey SK, Venkareddy LK, Berman JD, Lane KJ, Fong KC, Warren JL, Bell ML. Low-cost NO2 monitoring and predictions of urban exposure using universal kriging and land-use regression modelling in Mysore, India. Atmospheric Environment 2020;226:117395. |
R835871 (2020) |
Exit Exit |
|
|
Shinozuka Y, Saide PE, Ferrada GA, Burton SP, Ferrare R, Doherty SJ, Gordon H, Longo K, Mallet M, Feng Y, Wang Q. Modeling the smoky troposphere of the southeast Atlantic:a comparison to ORACLES airborne observations from September of 2016. Atmospheric Chemistry and Physics 2020;20(19):11491-526. |
R835871 (2020) |
Exit |
|
|
Gao Y, Zhang J, Yan F, Leung LR, Luo K, Zhang Y, Bell ML. Nonlinear effect of compound extreme weather events on ozone formation over the United States. Weather and Climate Extremes 2020;30:100285. |
R835871 (2020) |
Exit |
|
|
Heo S, Lim CC, Bell ML. Relationships between Local Green Space and Human Mobility Patterns during COVID-19 for Maryland and California, USA. Sustainability 2020;12(22):9401. |
R835871 (2020) |
Exit Exit |
|
|
Datta A, Saha A, Zamora ML, Buehler C, Hao L, Xiong F, Gentner DR, Koehler K. Statistical field calibration of a low-cost PM2. 5 monitoring network in Baltimore. Atmospheric Environment 2020;242:117761. |
R835871 (2020) |
Exit |
|
|
Schilling K, Gentner DR, Wilen L, Medina A, Buehler C, Perez-Lorenzo LJ, Pollitt KJ, Bergemann R, Bernardo N, Peccia J, Wilczynski V. An accessible method for screening aerosol filtration identifies poor-performing commercial masks and respirators. Journal of exposure science & environmental epidemiology 2020:1-0. |
R835871 (2020) |
Exit |
|
|
Berman JD, Ebisu K, Peng RD, Dominici F, Bell ML. Drought and the risk of hospital admissions and mortality in older adults in western USA from 2000 to 2013:a retrospective study. The Lancet Planetary Health. 2017 Apr 1;1(1):e17-25. |
R835871 (2018) R835871 (2020) |
Exit Exit |
|
|
Son JY, Lane KJ, Miranda ML, Bell ML. Health disparities attributable to air pollutant exposure in North Carolina:Influence of residential environmental and social factors. Health & Place 2020;62:102287. |
R835871 (2020) |
Exit |
|
|
Gasparrini A, Guo Y, Sera F, Vicedo-Cabrera AM, Huber V, Tong S, Coelho MD, Saldiva PH, Lavigne E, Correa PM, Ortega NV. Projections of temperature-related excess mortality under climate change scenarios. The Lancet Planetary Health. 2017 Dec 1;1(9):e360-7. |
R835871 (2018) R835871 (2020) |
Exit |
|
|
Armstrong B, Sera F, Vicedo-Cabrera AM, Abrutzky R, Åström DO, Bell ML, Chen BY, de Sousa Zanotti Stagliorio Coelho M, Correa PM, Dang TN, Diaz MH. The role of humidity in associations of high temperature with mortality:a multicountry, multicity study. Environmental Health Perspectives 2019;127(9):097007. |
R835871 (2019) R835871 (2020) |
|
Progress and Final Reports:
Original Abstract Subprojects under this Center: (EPA does not fund or establish subprojects; EPA awards and manages the overall grant for this center).
R835871C001 Project 1: Modeling Emissions from Energy Transitions
R835871C002 Project 2: Assessment of Energy-Related Sources, Factors and Transitions Using Novel High-Resolution Ambient Air Monitoring Networks and Personal Monitors
R835871C003 Project 3: Air Quality and Climate Change Modeling: Improving Projections of the Spatial and Temporal Changes of Multipollutants to Enhance Assessment of Public Health in a Changing World
R835871C004 Project 4: Human Health Impacts of Energy Transitions: Today and Under a Changing World
The perspectives, information and conclusions conveyed in research project abstracts, progress reports, final reports, journal abstracts and journal publications convey the viewpoints of the principal investigator and may not represent the views and policies of ORD and EPA. Conclusions drawn by the principal investigators have not been reviewed by the Agency.