
Grantee Research Project Results
2016 Progress Report: Human Neural Stem Cell Metabolomic, Cellular and Organ Level Adverse Outcome Pathway Relationships for Endocrine Active Compounds
EPA Grant Number: R835551Title: Human Neural Stem Cell Metabolomic, Cellular and Organ Level Adverse Outcome Pathway Relationships for Endocrine Active Compounds
Investigators: Stice, Steve , Smith, Mary Alice , Lu, Kun , Zhao, Qun
Institution: University of Georgia
EPA Project Officer: Aja, Hayley
Project Period: September 1, 2013 through August 31, 2016 (Extended to August 31, 2017)
Project Period Covered by this Report: September 1, 2015 through August 31,2016
Project Amount: $799,938
RFA: Development and Use of Adverse Outcome Pathways that Predict Adverse Developmental Neurotoxicity (2012) RFA Text | Recipients Lists
Research Category: Human Health , Chemical Safety for Sustainability
Objective:
Our overall objective is to determine the effects of endocrine active compounds (EACs) on events and adverse outcome pathways, spanning key temporal windows of human neural development. We are using human neural cells for metabolomics, cell function (viability and neurite outgrowth), and in vivo chick embryo central nervous system assays to reach this objective and provide information on EACs mode of actions.
Progress Summary:
OBJECTIVE 1. Characterize metabolomic profiles during windows of susceptibility (WOS) represented by neural tube stage neural progenitor (hNP; DIV 0) cells and differentiated NP (hN2; DIV 14) cells exposed to escalating doses of endocrine active compounds.
- The metabolic profile of hN2 cells changes after treatment with media that had been conditioned by exposing C3A cells with Chlorpyrifos (Fig. 1, A and B)
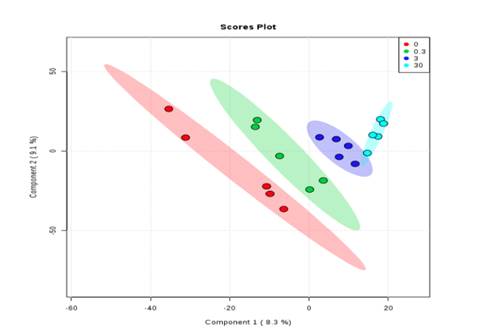
- hN2 cells demonstrate responses to Chlorpyrifos treated by C3A cells in a dose-dependent manner (Fig. 2)
- MetaboAnalystTM demonstrated greater metabolic activity following exposure of treated media to both the C3A and hN2 cells as opposed to hN2 cells alone.
Building on our previous work comparing WOS, we added a metabolism component to our system. Examples of our results are shown below. To determine whether the metabolomic profile chlorpyrifos would be changed if the parent compound was metabolized in vivo, we preconditioned media by exposing chlorpyrifos-containing media to the hepatocyte cell line, C3A. C3A cells are known for their metabolic capabilities, thus adding a metabolism component to our procedure. We compared the metabolic profile of hN2 cells after directly treating the hN2 cells with chlorpyrifos or with media containing chlorpyrifos after it was metabolized in vitro by the C3A hepatocyte cell line. Different metabolomics profiles were expressed as seen in the dose-response chromatograms (Fig. 1).
Fig. 1. hN2 cells treated with chlorpyrifos directly (A) or after chlorpyrifos had been exposed to the hepatocellular cell line, C3A (B).
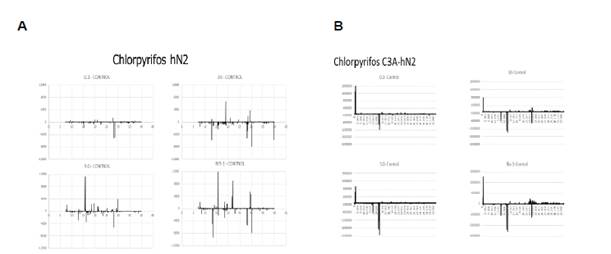
Fig. 2. Partial Least Squares-Discriminant Analysis (PLS-DA) of Chlorpyrifos treatment of varied concentrations on C3A and hN2 cells.
Using MetaboAnalystTM for pathway analysis, major pathways affected in hN2 cells directly exposed to chlorpyrifos were phenylalanine metabolism, fatty acid biosynthesis, and cyanoamino acid metabolism. When hN2 cells were exposed to conditioned media from C3A cells treated with chlorpyrifos, the major pathways affected were valine, isoleucine, and leucine biosynthesis and degradation, and aminoacyl-tRNA biosynthesis. In summary, chlorpyrifos affects amino acid and fatty acid metabolism in developing neuronal cells. An indicator of the biological impact of chlorpyrifos on neural progenitor cells was calculated by taking the sum of the absolute values of significant differences identified through t-tests of metabolomics profiles. Conditioned media from chlorpyrifos treated C3A cells had a tenfold or greater biological impact on hN2 cells than direct exposure to chlorpyrifos, suggesting the metabolites are more biologically active than the parent compound.
OBJECTIVE 2. Determine endocrine active compound-induced alterations in key human neural cellular events and establish their associations with the metabolic changes.
This year we have published a manuscript that encompasses and builds on our report for year 2.
Wu, Xian, Anirban Majumder, Robin Webb, and Steven L. Stice. "High content imaging quantification of multiple in vitro human neurogenesis events after neurotoxin exposure." BMC Pharmacology and Toxicology 2016;17(1):62.
In this manuscript, we concluded that neurotoxicant in vitro exposure during a maturation continuum affected human neurogenesis at substantially lower levels than previously known. For example, unlike prior acute studies, β-estradiol was highly toxic when present throughout the continuum and cytotoxicity was manifested starting early in the continuum via a non-estrogen receptor α (ER α) mechanism.
This past year, we introduced a more physiological representative co-culture system to represent the human condition for testing of developmental neurotoxicants. Human neural progenitor (hNP) cells are capable of independent, directed differentiation into astrocytes, oligodendrocytes and neurons and thus offer a potential cell source for developmental neurotoxicity (DNT) systems. hNP-derived pure population of neurons (Fig.3) and astrocytes (Fig 4) co-cultured at defined ratios mimic cellular heterogeneity and interaction in the central nervous system (CNS). Cytochrome P450 enzymes are expressed at a relatively high level in astrocytes and may play a critical role in the biotransformation of endogenous or exogenous compounds, including chlorpyrifos, which is an organophosphate insecticide that affects the CNS. P450 enzymes metabolize chlorpyrifos to chlorpyrifos-oxon, which is then metabolized primarily to 3, 5, 6-trichloropyridinol in addition to diethylphosphate and diethylthiophosphate. These end metabolites are less neurotoxic then than chlorpyrifos and chlorpyrifos-oxon. Our objective was to identify the interactive role of astrocytes and neurons in chlorpyrifos-induced human DNT. In neuron-only cultures, chlorpyrifos inhibited neurite length, neurite number and branch points per neuron in a dose-dependent manner during a 48 hour exposure, starting at 10 μM. However, in neuron astrocyte co-cultures, astrocytes protected neurons from the effects of chlorpyrifos at higher concentrations, up to and including 30 μM chlorpyrifos and endogenous astrocyte P450 enzymes effectively metabolized chlorpyrifos. The P450 inhibitor SKF525A partly negated the protective effect of astrocytes, allowing reduction in branch points with chlorpyrifos (10μM). Thus, the scalable and defined astrocyte-neuron co-culture model that we established here has potentially identified a role for P450 enzymes in astrocytic neuroprotection against chlorpyrifos and provides a novel model for addressing DNT in a more accurate multicellular environment.
Conclusion:
In current human DNT systems, chemical neurotoxicities have mostly been assessed by neuron only models or undefined ratios of neurons to rodent astrocytes. A defined human multicellular system provides an interactive tissue like environment with active modulation and presentation of toxicants to neurons, adding significant power to predictive in vitro DNT assays. We established a scalable, tunable and defined human PSC derived astrocyte and neuron CNS co-culture system and identified the role of astrocyte specific P450 acting to protect neurons from CPF toxicity.
Fig. 3. DIV 28 neurons are homogenous, uniformly expressed MAP2. Human DIV 28 neuron (10,000 cells/well) was cultured for 48 hours and fixed for immunofluorescent staining. (A) Neuron cell phase contrast image. (B) Hoechst nuclear staining. (C) β-III tubulin staining of neurite outgrowth. (D) MAP2 staining of neurite outgrowth. (E) Hoechst, β-III tubulin, MAP2 staining merge image. (F) Statistical analysis of MAP2 positive cell ratio in DIV0 hNP cells and DIV 28 neuron. Scale bars = 50 μm.
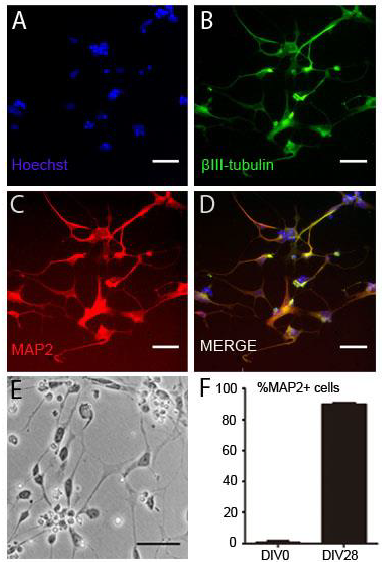
Fig. 4. Chlorpyrifos (CPF), CPF-oxon reduced neuron density and neurite outgrowth but 3, 5, 6-trichloropyridinol (TCP) was nontoxic. Human DIV 28 neuron cells (10,000 cells/well) were continuously exposed to a range of doses of CPF, CPF-oxon and TCP for 48 hours. A (Channel (1): Nuclei identification. Blue trace = accepted, Yellow trace = rejected. B (Channel (2): Cell body masks based on MAP2 expression; Blue trace = accepted cell, Red trace = rejected cell, Purple line = neurite, Yellow dot = branch point. Cells marked as rejected are not included calculating neurites per neuron or neurite length per neuron. Neurites emerging from accepted cell bodies are traced (purple lines) and quantified. C: Pseudo colored images from A and B merged. D) Total neuron density (cell density) were measured as an indicator of cell viability. E, F, G) Average number of neurites per neuron, total neurite length per neuron and total branch points per neuron were also measured. All data are presented as % from untreated control wells. (*, #) indicates significant difference from control group (P < 0.05).
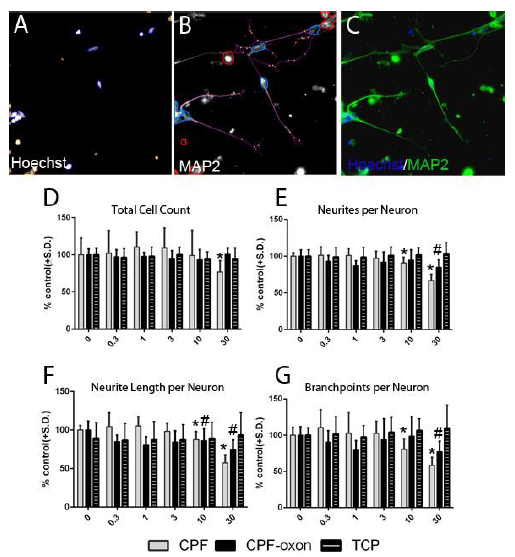
Fig. 5. Chlorpyrifos toxicity in DIV 28 neuron was reduced when astrocytes were co-cultured with neurons. Human neuron (10,000 cells/well) was separately and co-cultured with astrocyte (10,000 astrocyte & 10,000 neuron) for 48 hours and fixed for immunofluorescent staining. Cells were seeded at 15,000 cells per well in six well plates for metabolite analysis. A (Channel 1): Nuclei identification. Blue trace = accepted, Yellow trace = rejected. B (Channel 2): Cell body masks based on MAP2 expression; Blue trace = accepted cell, Red trace = rejected cell, Purple line = neurite, Yellow dot = branch point. Cells marked as rejected are not included calculating neurites per neuron or neurite length per neuron. Neurites emerging from accepted cell bodies are traced (purple lines) and quantified. C: Pseudo colored images from A and B merged. D: Total neuron density (cell density) was counted as an indicator of cell viability. E, F, G: neurite outgrowth parameters were measured. All data are presented as % from untreated control wells. (*) indicates significant difference between co-culture and neuron group at the same concentration (P < 0.05). Scale bars = 50 μm.
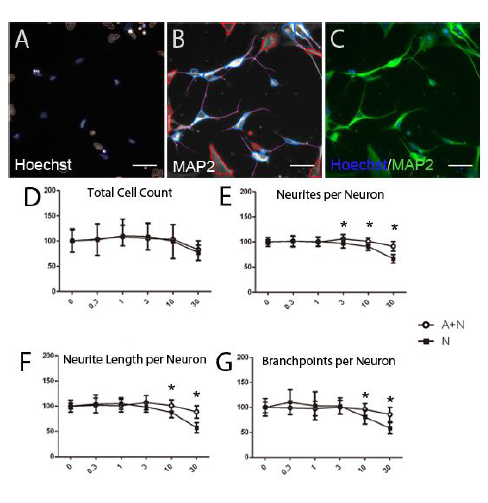
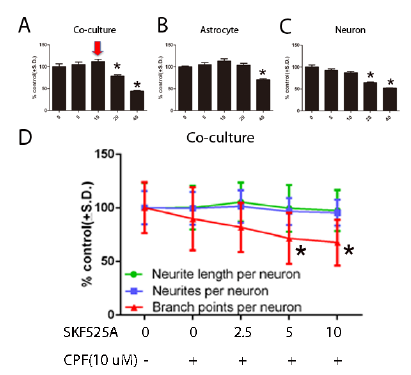
Fig. 6. SKF525A inhibited P450 activity and reversed astrocyte neuroprotective effects against CPF toxicity. Human DIV 28 neuron, astrocyte and co-culture cells (10,000 cells/well, 10,000 astrocytes & 10,000 neurons in co-culture) were continuously exposed to CPF (10μM) and a range of doses of SKF525A for 48 hours. (A) SKF525A exposure in co-culture medium for 48 hours. (B) SKF525A exposure in astrocyte culture medium for 48 hours. (C) SKF525A exposure in DIV 28 neuron culture medium for 48 hours. (D) Statistical analysis of average number of neurites per neuron, total neurite length per neuron and total branch points per neuron in co-culture exposed to CPF (10 μM) and a range of doses of SKF525A for 48 hours.
OBJECTIVE 3. Quantify the WOS vulnerability of the developing human neural cell chick chimera model.
Following the second years achievements, we continued to make more progress in the third year. We conducted more experiments longitudinally observing the growth of the chick central nervous system (CNS). Previously, we imaged six individual embryos on Days 10, 15, and 20 of embryonic development without retarding the chick's development or observing motion artifacts within our MR images. After imaging, MR image segmentation analysis allows us to calculate the volume of specific regions in the CNS for each individual chick at the three time points. Key neuroanatomy including the telencephalon, lateral ventricles, cerebellum, and brainstem were all characterized at each of the three time points imaging. The volumetric characterization and trends were consistent between all 6 of the embryos imaged. These results validate our proposed procedure for longitudinal imaging as the basis for future toxicological studies that will dose the chick embryo in ovo and longitudinally observe CNS growth under altered conditions.
- Due to the timely nature of CNS malformations caused by congenital Zika virus infection, we infected the chicken embryo with the live virus. The results were conclusive that the chicken embryo can be infected with the Zika virus and our methodology of longitudinally monitoring the CNS development demonstrated impaired growth. (Fig. 7,8,9, and 10)
- We have developed two approaches of in vivo iron mapping (a R2* method) and iron quantification (a quantitative susceptibility mapping). The two methods have been successfully applied to iron mapping and quantification of in vivo adipose tissues. Our next goal is to quantify the number of human neural cells labeled with iron oxide nanoparticles, which allows for quantitatively tracking and monitoring the cells in the chick CNS.
We concluded:
- Our novel method of imaging and assessment of key neuroanatomy and developmental biomarkers within the chick embryo brains is sensitive to detect CNS malformations caused by congenital Zika virus infections and postulate the same method will be applicable to toxicological screening.
Fig. 7. The chick embryo is permissive to persistent ZIKV infection in all organs and causes embryo death. (A) At 3 days post-infection (dpi), chick embryos display a proportional increase in infectivity to ZIKV infection. As few as 0.2 viral particles was sufficient to infect embryos but infection rates increase with greater numbers of viral particles. (B) ZIKV positive (ZIKV+) embryos display active viral replication. At 3 dpi the viral load in ZIKV+ embryos dramatically increased from the initial injected dose. Open circles indicate individual observations, and line indicates the mean of each dose. (C) ZIKV+ chick embryos demonstrate dose-dependent survival with high mortality within the first 3 dpi. (D) Infectious viral particles were isolated from E20 chick embryos after infection substantial viral loads were identified within the brain, eyes, and all other tissues evaluated relative to 0 particles (sham) injection.
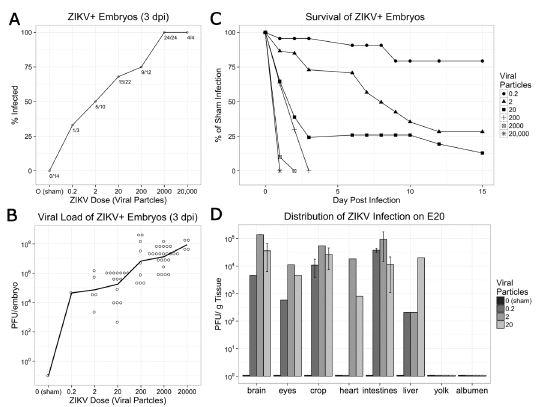
Fig. 8. MRI reveals ZIKV infected chick embryos have stunted brain growth. (A) Anatomical MRI T2-weighted images show integrity of sham injected chick embryo telencephalon (left) and malformation in similar region of ZIKV infected chick embryo (right). Dashed Boxes represent location of inset images. (B) The whole brain, (C) telencephalon, and (D) brain stem demonstrate significant increase in volume from E15 to E20 while ZIKV infected embryos did not. (E) The growth of the cerebellum did not appear to be stunted, and (F) the lateral ventricles of ZIKV infected embryos were significantly increased at both E15 and E20 when compared to DMEM injected control embryos. (G) The difference in mass of DMEM injected control eggs and ZIKV infected eggs was negligible. All comparisons were made with one-way ANOVA, * indicates P-value<0.05.
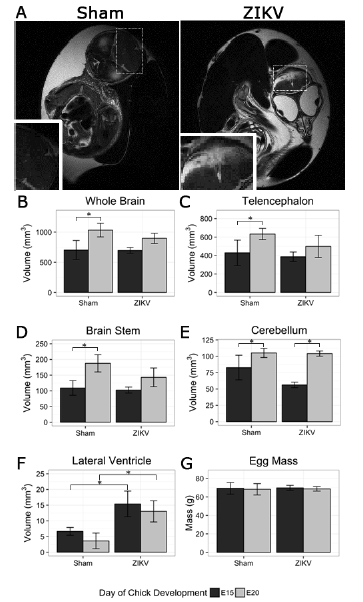
Fig. 9 ZIKV infection leads to alter T2 contrast. (A) Quantitative MRI T2 maps were calculated from acquired SEMS images demonstrate the changes between sham-injected embryos (left) and ZIKV (right) at E20. Higher T2s suggest more fluid in the ZIKV infected brain area, which is consistent to the hyperintensity contrast in the same area of anatomical images (Fig. 2A). Dashed Boxes represent location of inset images. (B) T2 quantification of comparable brain areas indicated ZIKV infections increases T2 values to, and the histogram depicts these changes.
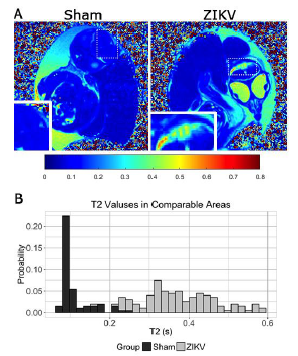
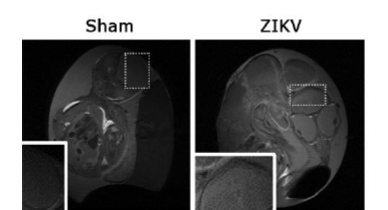
Fig. 10. Anatomical T1-weighted MRI images (Sham: left, ZIKV infected: right) of the same embryos as in Fig. 2. The ZIKV infected brain did not seem to show signs of calcifications. Dashed Boxes represent location of inset images.
Journal Articles on this Report : 3 Displayed | Download in RIS Format
| Other project views: | All 32 publications | 7 publications in selected types | All 7 journal articles |
|---|
| Type | Citation | ||
|---|---|---|---|
|
|
Goodfellow FT, Simchick GA, Mortensen LJ, Stice SL, Zhao Q. Tracking and quantification of magetically labeled stem cells using magnetic resonance imaging. Advanced Functional Materials 2016;26(22):3899-3915. |
R835551 (2015) R835551 (2016) R835551 (Final) |
Exit Exit Exit |
|
|
Wu X, Majumder A, Webb R, Stice SL. High content imaging quantification of multiple in vitro human neurogenesis events after neurotoxin exposure. BMC Pharmacology and Toxicology 2016;17(1):62. |
R835551 (2016) R835551 (Final) EPD15002 (Final) |
Exit Exit Exit |
|
|
Goodfellow FT, Tesla B, Simchick G, Zhao Q, Hodge T, Brindley MA, Stice SL. Zika virus induced mortality and microcephaly in chicken embryos. Stem Cells and Development 2016;25(22):1691-1697. |
R835551 (2016) R835551 (Final) EPD15002 (Final) |
Exit Exit |
Supplemental Keywords:
Human neural progenitor cells, neurite outgrowth, window of susceptibility, metabolomics, endocrine active compounds, neural maturation;Progress and Final Reports:
Original AbstractThe perspectives, information and conclusions conveyed in research project abstracts, progress reports, final reports, journal abstracts and journal publications convey the viewpoints of the principal investigator and may not represent the views and policies of ORD and EPA. Conclusions drawn by the principal investigators have not been reviewed by the Agency.