
Grantee Research Project Results
Final Report: Effects of Climate Change and Greenhouse Gas Mitigation Strategies on Air Quality
EPA Grant Number: R834284Title: Effects of Climate Change and Greenhouse Gas Mitigation Strategies on Air Quality
Investigators: Brouwer, Jacob , Dabdub, Donald
Institution: University of California - Irvine
EPA Project Officer: Hahn, Intaek
Project Period: December 1, 2009 through November 30, 2012 (Extended to November 30, 2013)
Project Amount: $600,000
RFA: Adaptation for Future Air Quality Analysis and Decision Support Tools in Light of Global Change Impacts and Mitigation (2008) RFA Text | Recipients Lists
Research Category: Air Quality and Air Toxics , Air , Climate Change
Objective:
Future efforts to mitigate climate change will include transitions to alternative technologies and fuels seeking reductions in greenhouse gas (GHG) emissions from U.S. energy sectors, including power generation and transportation. In addition, displacement of conventional energy strategies will impact emissions of pollutants directly influencing regional air quality (AQ) due to common generation processes and sources. The objective of this research is to quantify changes in pollutant emissions and the resulting regional AQ impacts in 2055 initiated by the implementation of alternative technologies and fuels targeting GHG emission reductions and the physical impacts of global climate change. Fundamentals central to the assessment include three quantitative analyses processes: (1) rigorous characterization of possible regional pollutant emission shifts resulting from technological perturbations associated with GHG mitigation, (2) determination of possible climate change impacts on regional AQ from physical effects, and (3) detailed regional AQ modeling to assess impacts on formation and fate of atmospheric chemical species of concern, including ozone (O3) and fine particulate matter (PM2.5). The ultimate goal of this work is to examine the physical effects of climate change on AQ and identify and characterize effective GHG mitigation strategies that can concurrently improve AQ.
Summary/Accomplishments (Outputs/Outcomes):
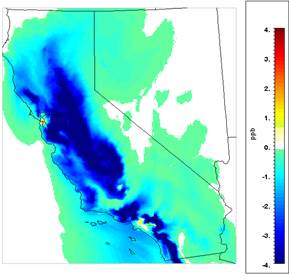
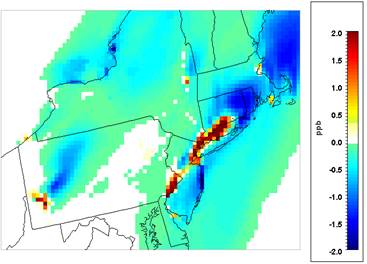
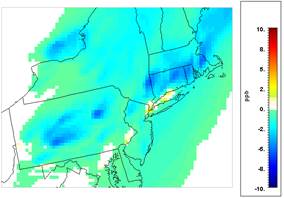 (a) | 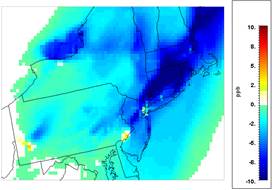 (b) |
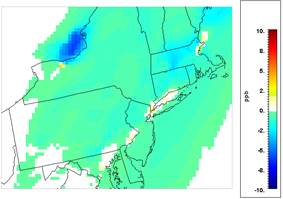 (c) | 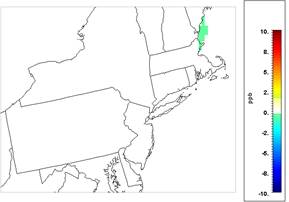 (d) |
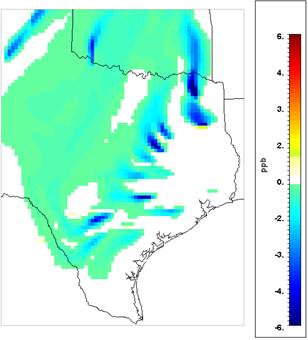 (a) | 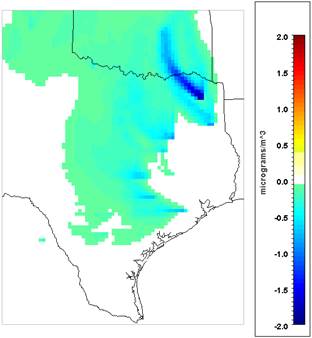 (b) |
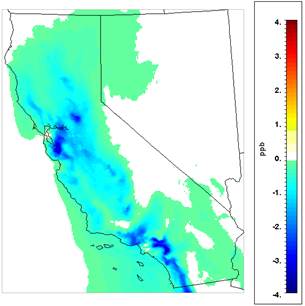 (a) | 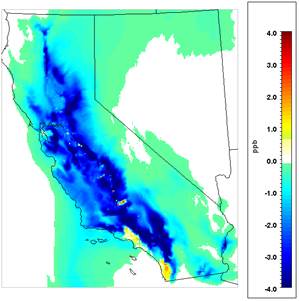 (b) |
 (c) | 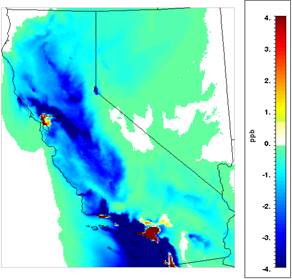 (d) |
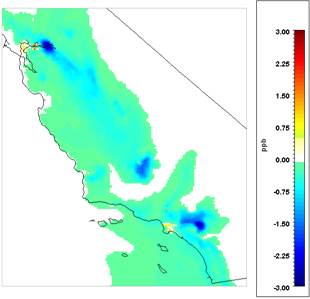
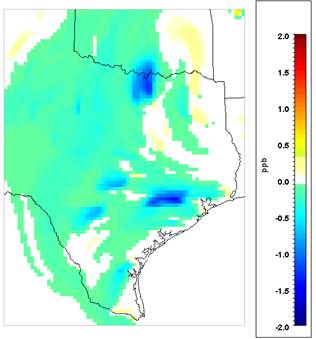 (a) | 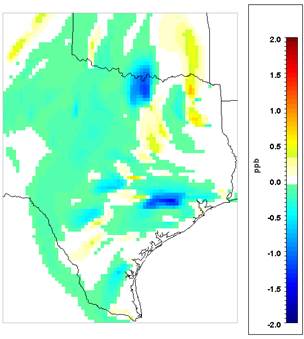 (b) |
 (a) | 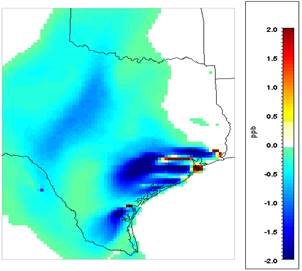 (b) |
 (a) | 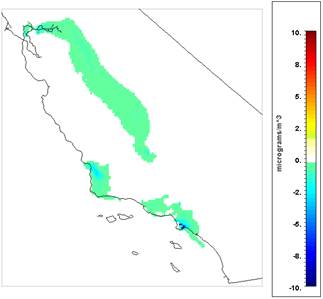 (b) |
 |
| (a) |
 |
| (b) |
Conclusions:
The transportation sector should be targeted with high priority for alternative technologies and fuels seeking GHG and pollutant emission reductions, with a particular focus on reducing precursor pollutants contributing to ground-level O3.
Maximizing AQ and GHG co-benefits from the power sector will be supported by high levels of nuclear power and renewables co-deployed with energy storage and smart grid technologies in tandem with aggressive energy efficiency and conservation strategies.
Power generation sector GHG impacts are important in 2055; but AQ impacts require consideration of spatial characteristics for conclusions regarding significance to human health.
The industrial sector should be considered with equivalent importance as power generation and transportation towards meeting future U.S. GHG and AQ goals.
In the absence of targeted elimination, coal power generation continues to dominate impacts on GHG and regional AQ, with nuclear power an optimal co-benefits mitigation strategy.
Strategies to address light duty vehicle emission impacts in 2055 should prioritize GHG reductions and seek opportunities for deployment in urban locations.
In the Light Duty Vehicle (LDV) sector, hydrogen fuel cell vehicles and electric vehicles represent the paramount opportunity for achieving GHG and AQ co-benefits; however attainment will require the co-deployment of low emitting fueling pathways.
The contribution to regional O3 and PM2.5 burdens from additional (non-light duty vehicle) transportation sub-sectors are extensive in 2055. In particular, emissions from offroad and marine sources should be targeted for emission reduction strategies.
Addressing emissions from the Goods Movement sector is of high importance to AQ control strategies in 2055 and represents an important opportunity to achieve AQ and GHG co-benefits, particularly in urban regions supporting international shipping ports.
Targeted strategies to reduce the emissions from ocean going vessels can achieve significant reductions in CO2 in tandem with important improvements in regional O3 and PM2.5
Petroleum-based transport fuel infrastructure contributes significantly to regional O3 and PM2.5 in 2055 and enhances the AQ benefits of transitioning to alternative transportation fuels
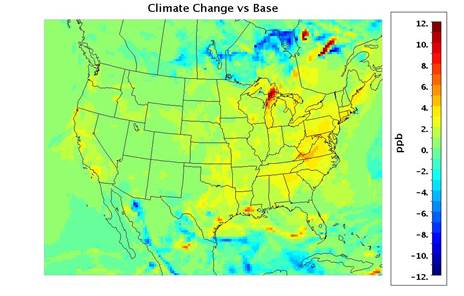
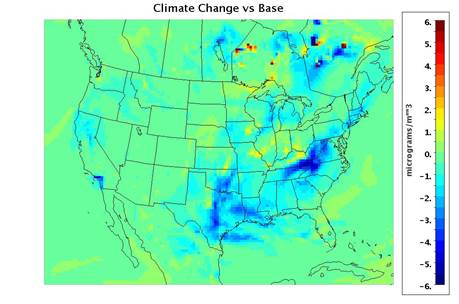
AQ sensitivity to long-term changes due to climate and background concentrations reiterates the need for climate change penalties in the assessment of air pollution control strategies.
Journal Articles on this Report : 1 Displayed | Download in RIS Format
| Other project views: | All 8 publications | 1 publications in selected types | All 1 journal articles |
|---|
| Type | Citation | ||
|---|---|---|---|
|
|
Mac Kinnon M, Shaffer B, Carreras-Sospedra M, Dabdub D, Samuelsen GS, Brouwer J. Air quality impacts of fuel cell electric hydrogen vehicles with high levels of renewable power generation. International Journal of Hydrogen Energy 2016;41(38):16592-16603. |
R834284 (Final) |
Exit Exit Exit |
Supplemental Keywords:
RFA, Air, Atmosphere, Air Pollution Effects, climate change, air quality modelingProgress and Final Reports:
Original AbstractThe perspectives, information and conclusions conveyed in research project abstracts, progress reports, final reports, journal abstracts and journal publications convey the viewpoints of the principal investigator and may not represent the views and policies of ORD and EPA. Conclusions drawn by the principal investigators have not been reviewed by the Agency.