
Grantee Research Project Results
Final Report: Predicting Relative Risk of Invasion by Saltcedar and Mud Snails in River Networks Under Different Scenarios of Climate Change and Dam Operations in the Western United States
EPA Grant Number: R833833Title: Predicting Relative Risk of Invasion by Saltcedar and Mud Snails in River Networks Under Different Scenarios of Climate Change and Dam Operations in the Western United States
Investigators: Poff, N. LeRoy , Bledsoe, Brian P. , Purkey, David , Friedman, Jonathan , Auble, Gregor T. , Shafroth, Patrick B. , Merritt, David M. , Raff, David A. , Lytle, David
Institution: Colorado State University , Oregon State University , U.S. Forest Service , U.S. Bureau of Reclamation , United States Geological Survey , Stockholm Environment Institute
EPA Project Officer: Packard, Benjamin H
Project Period: July 1, 2008 through June 30, 2012 (Extended to June 30, 2013)
Project Amount: $599,748
RFA: Ecological Impacts from the Interactions of Climate Change, Land Use Change and Invasive Species: A Joint Research Solicitation - EPA, USDA (2007) RFA Text | Recipients Lists
Research Category: Aquatic Ecosystems , Climate Change
Objective:
The spread of non-native species threatens freshwater ecosystems globally, resulting in potentially irreversible genetic losses and costly management consequences. Water control infrastructure such as reservoirs, canals, and levees can promote this biotic invasion by altering flow regimes, impairing and fragmenting habitat, and facilitating the movement of intentionally or inadvertently introduced organisms. Furthermore, climate changes that weaken thermal constraints on cold-intolerant exotic species in the Temperate Zone may exacerbate the influence of river regulation on the invasion process into new, thermally suitable habitats. The perceived likelihood of water scarcity and flood damage due to intensified drought or extreme precipitation may restrict the operational flexibility of existing dams or prompt calls for new dam construction, thereby interfering with efforts to control or prevent novel species. Introduced species spread throughout many of the highly regulated river basins of western North America during the 20th century, and the human demand for water under a warming climate is likely to influence patterns of further invasion during coming decades.
In this study, we developed models that mechanistically link species population success to climate-sensitive environmental drivers. Our overarching goal was to build a general framework with which to predict the potential distribution of invasive species in rivers on the basis of climate-sensitive thresholds of hydrogeomorphic disturbance, which we hypothesized to regulate species’ local success. We asked the question of whether climate change, river hydrogeomorphic dynamics and water management practices will interact to regulate the spread of non-native species into the upper Green River basin in southwestern Wyoming. We were particularly interested in the spread of non-native Tamarix spp. (saltcedar), which currently is limited in its northward range by cold winter temperatures. General circulation models (GCM) forecast that the upper Green River basin will become thermally suitable for invasion by saltcedar in the coming decades.
This project involved a multi-scaled, linked modeling approach. First, a species distribution of existing saltcedar populations across the western United States. Second, downscaled projected scenarios of temperature and precipitation for the upper Green River basin were input into the Water Evaluation and Planning (WEAP) model framework to general future time series of flow regimes based on precipitation and water management operations, including dams. Third, these flow regimes were coupled with GIS-derived measures of channel and valley bottom geomorphology to characterize reach-scale hydrogeomorphic disturbance regimes that regulate establishment and population success of saltcedar, thus presenting a risk-based map of potential invasion by saltcedar throughout the basin. Finally, various management activities were simulated to evaluate the potential to reduce invasion risk under future climate change.
Summary/Accomplishments (Outputs/Outcomes):
Our first objective was to develop a predictive biological model to explain the current distribution and dominance of two invasive species across the interior western US. We hypothesized that the current distribution and abundance of saltcedar and New Zealand mudsnail (Potamopyrgus antipodarum) can be explained statistically in terms of site-scale habitat dynamics, which are defined by flow regime and reach-scale geomorphology, and that the probability of species occurrence at a site would reflect a threshold response to hydrogeomorphic setting. We developed a species distribution model for saltcedar across the western US using available occurrence and abundance data and site-scale climatic, hydrologic and geomorphic predictor variables. Our model demonstrated the predictive dominance of temperature and precipitation at a landscape scale, but we also observed that flow attributes such as stream power and flow timing were significantly related to saltcedar distribution and abundance.
As input to WEAP, time series of climate forcing variables downscaled via the bias-corrected constructed analog method (BCCA) were obtained from the World Climate Research Programme’s (WCRP) Coupled Model Intercomparison Project phase 3 (CMIP3) multi-model dataset. Mean basin temperature and precipitation were calculated during the “historic” years 1970–1999 and the “future” years 2030–2059 for each of 112 potential GCM runs subject to the Intergovernmental Panel on Climate Change’s (IPCC) B1, A1B and A2 emissions storylines (Figure 1). The difference between future and historic means was then taken as ΔT and ΔP values per GCM, and used to ordinate the pool of runs. Two runs at the extremes of precipitation change (“dry," a decline in mean precipitation and “wet," an increase) were selected at each of the interquartile increases in temperature (+1.5° C or “warm” and 2.5° C or “hot," Figure 1). Mean weekly flows resulting from each of these forcing inputs were calculated during the historic and future periods, with future discharge examined under both a “business-as-usual” configuration of WEAP with operational rules identical to the historic period, and a “natural flow restored” configuration, in which water withdrawals and reservoir storage were removed from the model. While such a “natural” scenario is logistically and politically improbable, it provided an informative contrast with projections under the current level of water management.
The “wet” and “dry” inputs yielded the expected increases and decreases in overall stream flow. Time series of projected discharge over the full future record indicated that the historically characteristic pattern of annual snowmelt peaks declining to summer lows was maintained for each of the GCM forcing scenarios under both the “business-as-usual” and “natural-flow-restored” WEAP configurations (Figure 2). Despite clear differences among GCMs in the specific years of predicted high flow, the climate model inputs all generated year-to-year variation in the magnitude of modeled annual peaks. The “hot, wet” scenario generated the largest peaks relative to the historic distribution, whereas the “hot, dry” GCM resulted in annual high flows that were only occasionally larger than the historic median at many locations (Figure 3).
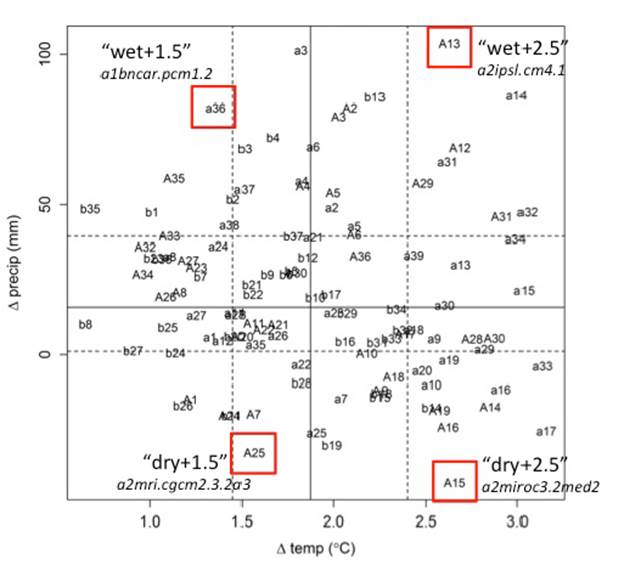
Figure 1. 112 candidate GCM forcing input series ordinated by the change in mean temperature and precipitation between the historic (1970–1999) and future (2030–2059) periods. The designations “warm” and “hot” refer to average temperature increases of 1.5 and 2.5 degrees Celsius, and the “wet” and “dry” labels indicate substantial projected increases in precipitation versus decreases from historic levels. Italicized model names refer to WCRP CMIP3 downscaling designations, and dashed lines represent the interquartile range for each measure. The selected model inputs (red boxes) were chosen to capture the largest changes in precipitation at the 25th and 75th percentiles of increased temperature, with the expectation that these differences would serve to bound the potential hydrologic outcomes, and therefore represent much of the range of potential saltcedar responses.
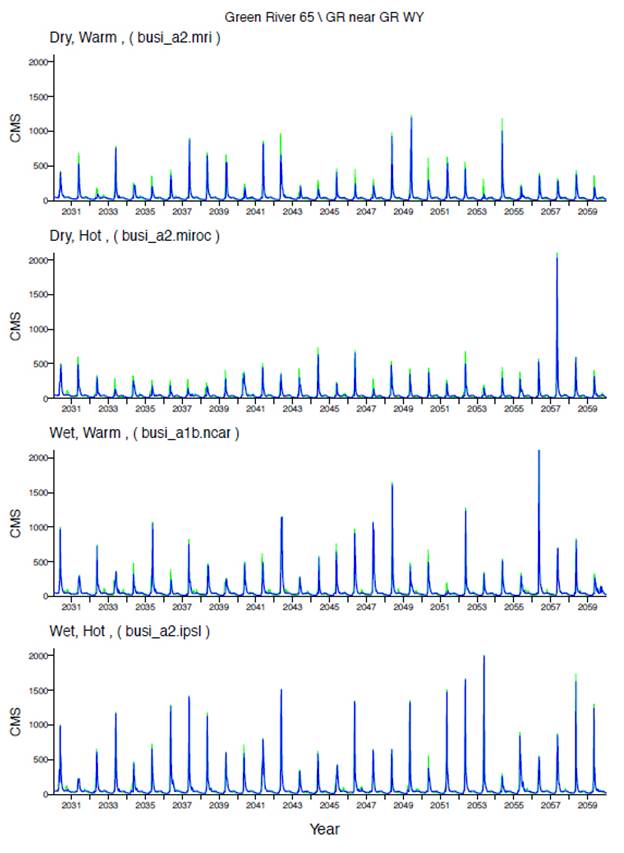
Figure 2. Modeled future weekly discharge at the focal lower network node “Green River near Green River, WY” under the 4 alternative climate scenarios and the “business-as-usual” (blue) and “natural-flow-restored” (green) WEAP configurations. As expected, decreases or increases in precipitation resulted in a clear division in flows between the “wet” and “dry” models, particularly evident in a comparison of the peaks resulting from the two “hot” scenarios (second and fourth rows), but the characteristic annual snowmelt hydrograph was maintained for each of the downscaled temperature and precipitation projections. Though differences in climate model specification resulted in sharply diverging flow projections for any particular year, all of the GCMs yielded year-to-year variation in the sequence of high flow magnitude, with occasional very large peaks years followed by much smaller maxima (i.e., inter-annual stochasticity leading to favorable establishment patterns was present in the modeled discharge). The “natural-flow-restored” configuration did not substantially alter annual high flow magnitude.
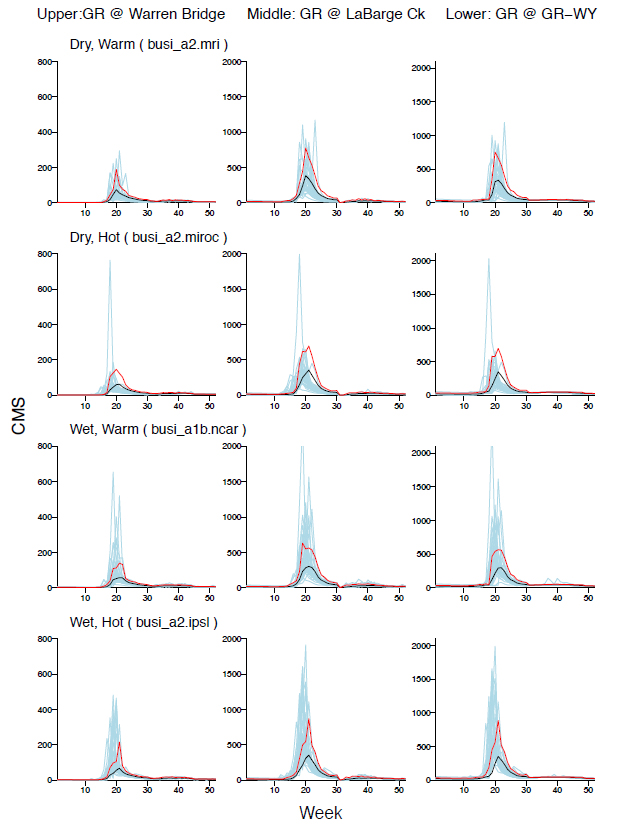
Figure 3. Projected future weekly discharge at different network positions (columns) under the “business-as-usual” configuration. Flow during each future year (light blue) is overlaid on the median (black) and 95th percentile (red) of flow during each week in the historic period, calculated individually for each climate forcing (rows). The wet scenarios consistently generated high flows greater than the per-week, historic 95th percentile, while the dry scenarios only infrequently exceeded this threshold. This within-year perspective also reveals that the timing of the spring runoff peak was consistently advanced across years and nodes for all of the 4 GCMs.
All forcing scenarios advanced the within-year timing of these high flows under both WEAP configurations, with earlier runoff somewhat more pronounced for the two hotter GCMs, consistent with expectations regarding faster melt of the snow pack (Figure 3). The flow regime attributes of a consistently earlier annual peak and between-year variation in high flow magnitude held throughout the drainage network at nodes subject to different levels of water management (Figure 3). However, the “natural” configuration did reveal the effects of water diversion on mid-‐network reaches and dams located in the lower reaches that reduced and elevated summer low flows respectively.
We also constructed a geomorphic model of the basin using a previously developed Geomorphic Valley Classification (GVC) system with GIS data on elevation, and information on geomorphic thresholds related to hydraulic energy, hillslope coupling and channel confinement. The GVC model, combined with the time-varying hydrologic regimes, provided a dynamic, spatially explicit hydrogeomorphic template for the stream network of the upper Green River basin that describes suitable habitat structure and dynamics for saltcedar establishment and persistence.
We built a mechanistic biological model to examine the “risk of invasion” for river reaches throughout the basin, based on species life history tolerance and timing of disturbance events that varied across the different combinations of climate change scenarios and modes of dam operations. We hypothesized that a reach-scale geomorphic base map can be combined with projected reach-scale flow regimes to predict probability of occurrence (habitat suitability) for saltcedar. We developed a biological model for saltcedar on hydrogeomorphic thresholds that were parameterized with values informed by prior research and the species distribution model derived from the first objective. We used this hydrogeomorphic template as the basis on which to apply a model of stage-structured woody riparian vegetation. This exploratory approach permitted the simulation of change through time in saltcedar cover area as an indicator of invasion risk.
Simulation results supported the hypothesis that invasion risk will be greatest under a “hot, wet” climate scenario, given continuation of the management status quo, but this finding was contingent on the treatment of annual high flow timing. In the biological response model, the magnitude of projected annual high flows controlled the availability of suitable establishment area and the intensity of mortality from flood disturbance relative to the overbank threshold defined by the median historic annual peak. Years in which high flows exceeded this magnitude thereby generated saltcedar seedling cover, and subsequent lower flow years led to increased adult abundance as younger stages matured.
However, the potential for such colonization was strongly dependent on whether the establishment success parameter was held constant or made a function of the week in which the annual high flow occurred (Figure 4). For example, in timing-independent simulations, adult saltcedar cover increased to the level designating high invasion risk under the regularly large floods produced by the “hot, wet” climate scenario, and invasion risk was moderate for the 3 remaining GCMs at LEF units associated with the focal lower network node (Figure 4, “Green River Near Green River, WY” below Fontenelle Dam and the confluence of the Big Sandy River). In stark contrast, the relatively small and significantly earlier peak sequence of the “hot, dry” scenario yielded no establishment opportunities at this location in a timing-sensitive simulation, and the inclusion of timing effects on saltcedar regeneration virtually eliminated the otherwise high invasion risk for the “hot, wet” scenario (Figure 4).
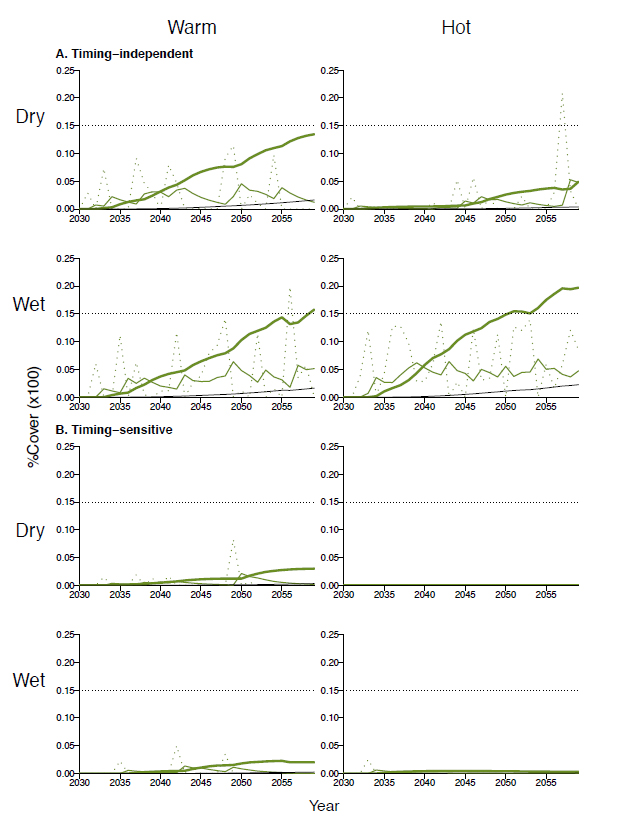
Figure 4. Simulated saltcedar abundance for a “Low Energy Floodplain” (LEF) river unit at the focal lower network node “Green River near Green River, WY” under the 4 alternative climate scenarios and the “business-as-usual” WEAP configuration. Panels illustrate the change through time of the seedling (dotted green), juvenile (light solid green), adult (heavy solid green) and dead (solid black) stages relative to the threshold designating high invasion risk (horizontal dotted line). A) Simulation runs with timing-independent establishment (estabt = 0.5) permitted saltcedar recruitment following yearly peaks greater than the historic median annual high flow. B) In contrast, the assumption that saltcedar establishment success was a function of the week in which high flow occurred entirely prevented colonization for the “hot, dry” scenario and greatly reduced the adult cover present under the remaining climate forcing inputs.
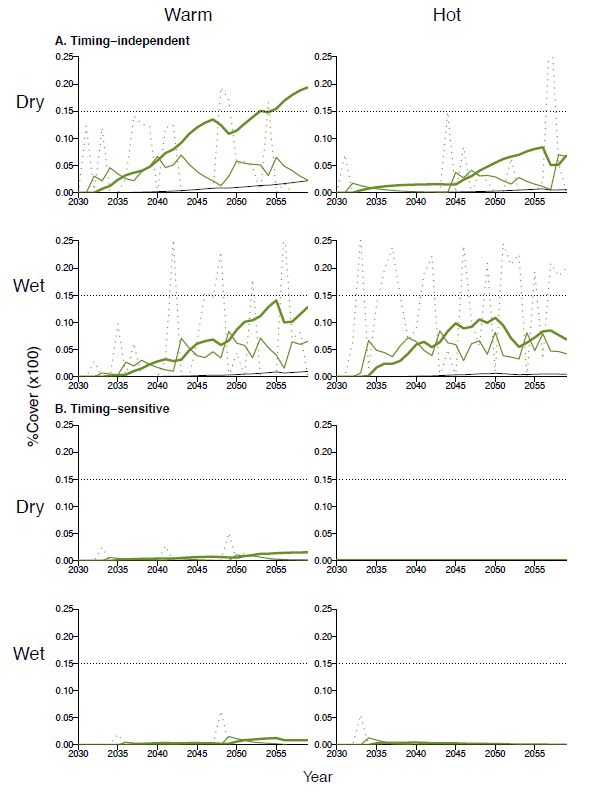
Figure 5. Simulated saltcedar abundance for a “Moderate Energy Open” river unit at the focal upper network node “Green River near Warren Bridge” under the 4 alternative climate scenarios and the “business-as-usual” WEAP configuration. Panel conventions follow Figure 4. As was the case for the lower energy, lower network node, the inclusion of peak flow timing as an influence on saltcedar establishment success dramatically reduced the simulated invasion risk. However, the assumption of slightly greater disturbance intensity relative to the scaled discharge magnitude in this setting altered the relationship among the climate scenarios for timing-independent simulations. Though the larger flood magnitudes of the “hot, wet” scenario again led to the greatest establishment opportunities, the concomitantly higher disturbance mortality acted to limit adult cover and reduce the invasion risk class. Conversely, the increase in establishing seedling area for the “warm, dry” scenario more than compensated for additional flood mortality, resulting in a shift from the “moderate” to “high” risk class.
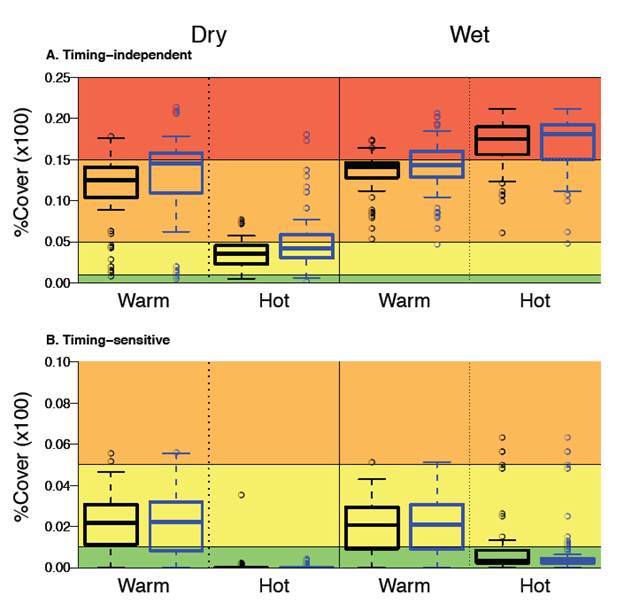
Figure 6. Simulated mean adult cover of saltcedar for all “Low Energy Floodplain” units under the 4 climate forcing scenarios and 2 management configurations for timing-independent (A) and timing-sensitive (B) runs. Though the larger annual high flows of the “hot, wet” GCM led to the highest risk for timing-independent model runs, this scenario also experienced the greatest decline in risk for timing-sensitive model runs due to earlier snowmelt runoff peaks. In addition, the combination of earlier and smaller peaks under the “hot, dry” scenario nearly eliminated saltcedar establishment opportunities in timing-sensitive simulations. High flows under the “natural-flows-restored” (blue) configuration were slightly larger than those under the “business-as-usual” (black) simulations resulting in a minor trend toward greater saltcedar invasion risk for timing-independent runs (i.e., flood suppression by water management slightly decreased seedling establishment). However, annual peaks also arrived even earlier at many locations in the absence of management, thereby eliminating this difference in timing-sensitive simulations.
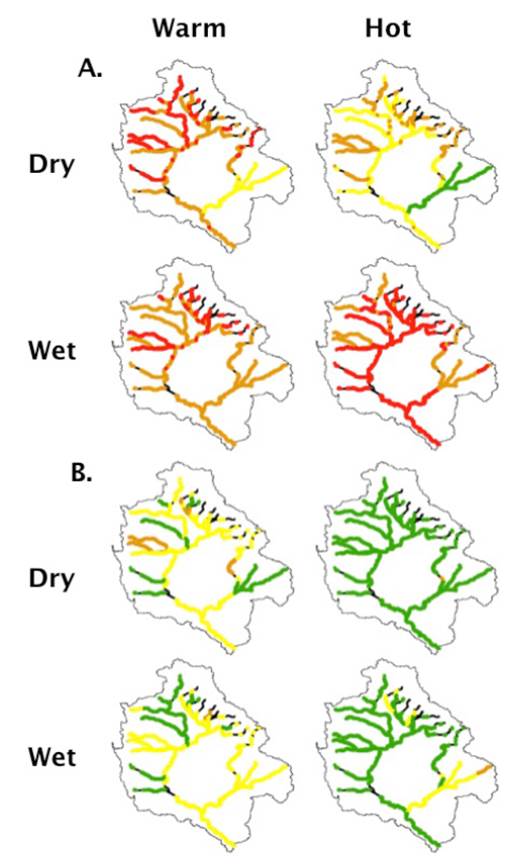
Figure 7. The spatial distribution of invasion risk classes measuring mean adult saltcedar cover during the last 5 years of model runs for each climate scenario. A) Timing-independent simulations resulted in low (yellow), moderate (orange) or high (red) relative risk for both LEF and MEO valley classes throughout the watershed, with the larger yearly floods under the “hot, wet” scenario producing the most opportunities for seedling establishment. The very low (green) risk predicted for reaches along the Big Sandy River under the “hot, dry” scenario reflected a paucity of recruitment opportunities as annual peak flows were seldom of greater magnitude than the historic median peak. B) Timing-sensitive simulations reduced invasion risk across scenarios and network locations, with the largest shifts evident for the hot scenarios with greater advancement in the week of annual high flow. The low risk predicted for the two “warm” scenarios with the inclusion of timing reflected the conservative definition of the lower boundary of this class at 1% mean adult cover. Black sections indicate reaches that were not modeled.
For timing-independent simulations, the invasion risk class for the “hot, wet” scenario was reduced to moderate in upper-network, MEO settings, where disturbance intensity was assumed to be slightly greater than LEF units relative to the magnitude of overbank scaled discharge (Figure 5). However, this shift reflected a decrease in mean adult cover due to higher flood-driven mortality rather than diminished susceptibility to saltcedar, as seedling establishment simultaneously increased with the larger floods.
The effect of flood timing on model behavior was consistent across the two geomorphic settings and throughout the drainage network (Figures 6 and 7). For LEF units in timing-independent simulations, the highest risk was associated with the “hot, wet” GCM that produced the greatest increases in yearly high flow magnitude, but all of the climate scenarios resulted in moderate to high mean adult cover (Figure 6). Yet the two hot scenarios showed the sharpest decline in adult cover for timing-sensitive simulations, where earlier snowmelt runoff peaks disfavored the recruitment of saltcedar. The spatial distribution of simulated saltcedar abundance largely followed from the assumption of differential flood disturbance intensities in LEF and MEO units, with the latter somewhat more common along tributaries in the upper network (Figure 7).
Conclusions:
This study used a novel approach to assess the relative risk of non-native species invasion in the face of rapid climate change. We combined climate downscaling with a rainfall-runoff hydrologic model coupled with human water demand (river regulation) to map future hydrologic conditions in an entire river basin (Upper Green River, Wyoming). These future flows were overlain on existing river channel and valley bottom morphology to develop a spatially-explicit, dynamic hydrogeomorphic template for the river network that could be used to assess the relative invasion success of saltcedar (Tamarix spp.) throughout the basin, with and without management interventions.
Our synthetic, biophysically process-based, multi-scale approach generated a sequence of spatially explicit maps that can provide science guidance to support strategic decision-making regarding the spatially-distributed risk of, and possible adaptation to, the spread of invasive species at local to regional scales in the western United States.
Annual peak discharge in the UGR basin during the extended growing season were projected to arrive 1 to 2 weeks earlier for the modeled years 2030–2059 relative to the 1970–1999 period. For the dry scenarios in particular, mid-network and downstream nodes subject to the accumulating effects of water withdrawal and storage exhibited earlier peak timing under the “natural” (infrastructure removed) relative to the “business-as-usual scenario”, because flow would not be withheld to meet storage requirements.
The likely invasion success of saltcedar will depend on both the magnitude and the timing of future peak flows that create potential habitat for this species. Certain geomorphic setting classes are more vulnerable than others. Under a “hot, wet” climate change scenario, saltcedar invasion risk ranked high, whereas under a “hot, dry” scenario, peak magnitudes would generally not be adequate to provide ample necessary habitat conditions and salt cedar invasion would be much lower. Significantly, a shift of only a couple of weeks in peak flow timing due to an earlier snowmelt runoff under “hot” conditions, would virtually eliminate the ability of saltcedar to establish and persist, even under the otherwise, most favorable “hot, wet” scenario. This possibility, in combination with a possible management scheme that intentionally elevates summer baseflows in downstream river channels, whether by irrigation shut off or dam release, suggests a potential mechanism for managing invasion risk while simultaneously promoting the establishment and survival of native riparian vegetation.
Journal Articles on this Report : 5 Displayed | Download in RIS Format
| Other project views: | All 25 publications | 7 publications in selected types | All 5 journal articles |
|---|
| Type | Citation | ||
|---|---|---|---|
|
|
Auerbach DA, Poff NL. Spatiotemporal controls of simulated metacommunity dynamics in dendritic networks. Journal of the North American Benthological Society 2011;30(1):235-251. |
R833833 (2010) R833833 (2011) R833833 (Final) |
Exit Exit Exit |
|
|
Auerbach DA, Deisenroth DB, McShane RR, McCluney KE, Poff NL. Beyond the concrete:accounting for ecosystem services from free-flowing rivers. Ecosystem Services 2014;10:1-5. |
R833833 (Final) |
Exit Exit Exit |
|
|
McShane RR, Auerbach DA, Friedman JM, Auble GT, Shafroth PB, Merigliano MF, Scott ML, Poff NL. Distribution of invasive and native riparian woody plants across the western USA in relation to climate, river flow, floodplain geometry and patterns of introduction. Ecography 2015;38(12):1254-1265. |
R833833 (2012) R833833 (Final) |
Exit Exit Exit |
|
|
Olden JD, Kennard MK, Lawler JJ, Poff NL. Challenges and opportunities in implementing managed relocation for conservation of freshwater species. Conservation Biology 2011;25(1):40-47. |
R833833 (Final) R833834 (2012) R833834 (Final) |
Exit Exit Exit |
|
|
Poff NL, Pyne MI, Bledsoe BP, Cuhaciyan CC, Carlisle DM. Developing linkages between species traits and multiscaled environmental variation to explore vulnerability of stream benthic communities to climate change. Journal of the North American Benthological Society 2010;29(4):1441-1458. |
R833833 (Final) |
Exit Exit |
Supplemental Keywords:
climate change, land use, water resources, dams, invasive species, temperature, precipitation, flow regime, disturbance, aquatic, riparian, habitat, risk assessment, vulnerability, decision support, conservation, ecology, hydrology, geomorphology, reach, network, watershed, scale, niche model, agent-based model, geographic information system, remote sensing, Wyoming, Colorado, Utah, EPA Region 8;, RFA, Air, Ecosystem Protection/Environmental Exposure & Risk, Scientific Discipline, Aquatic Ecosystem, Aquatic Ecosystems & Estuarine Research, Ecological Risk Assessment, Atmosphere, Environmental Chemistry, Air Pollution Effects, climate change, Environmental Monitoring, invasive species, Global Climate Change, global climate models, coastal ecosystems, climate models, climate variability, ecosystem indicators, land and water resources, ecosystem stress, land use, aquatic ecosystemsProgress and Final Reports:
Original AbstractThe perspectives, information and conclusions conveyed in research project abstracts, progress reports, final reports, journal abstracts and journal publications convey the viewpoints of the principal investigator and may not represent the views and policies of ORD and EPA. Conclusions drawn by the principal investigators have not been reviewed by the Agency.