
Grantee Research Project Results
Final Report: Effects of Nanomaterials on Human Blood Coagulation
EPA Grant Number: R832843Title: Effects of Nanomaterials on Human Blood Coagulation
Investigators: Perrotta, Peter L. , Gouma, Pelagia-Irene
Institution: West Virginia University , The State University of New York at Stony Brook
EPA Project Officer: Hahn, Intaek
Project Period: February 1, 2006 through January 31, 2009
Project Amount: $375,000
RFA: Exploratory Research: Nanotechnology Research Grants Investigating Environmental and Human Health Effects of Manufactured Nanomaterials: A Joint Research Solicitation - EPA, NSF, NIOSH (2005) RFA Text | Recipients Lists
Research Category: Safer Chemicals , Nanotechnology
Objective:
Study effects of nanomaterials on the blood coagulation system.
Summary/Accomplishments (Outputs/Outcomes):
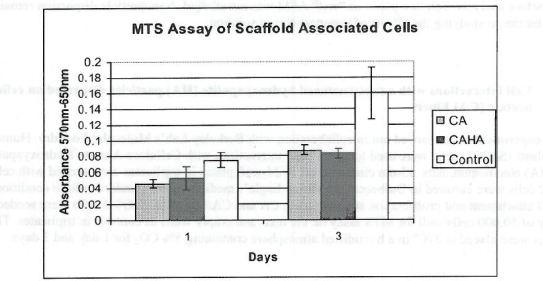
Figure 1. MTS Assay, Absorbance Spectrum after 1 day and 3 days of cells associated with CA and CA/HA mats and Controls. Error bars represent means +- SD
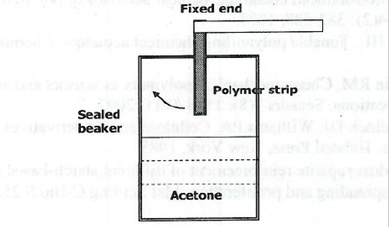
Figure 2. Setup for measuring chemical actuation
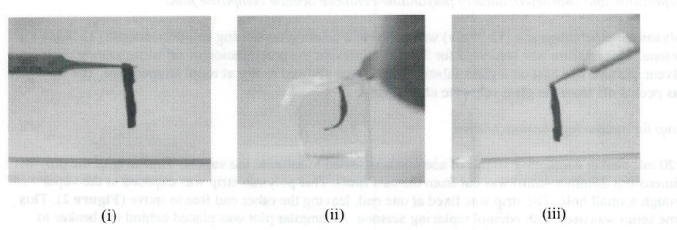
Figure 3. Optical images of bending and recovery in polyaniline-cellulose acetate films (i) Original configureation (ii) Bending in acetome vapors (iii) Recovery in air

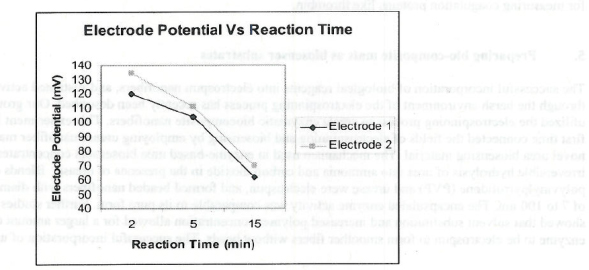
Figure 4. Plot of electrode potential (mV) Va Reaction time (Min). Two sets of readings by two electrodes are shown with similar trends and are in good agreement
| Dose | Thrombin generation (nM/min) | Peak thrombin (nM) | |
|---|---|---|---|
| Control (n=17) | NA | 2972 (708) | 195 (45) |
| Ultrafine (n=13) | 0.03 (10) | 3544 (332)* | 244 (24)* |
| Fine (n=8) | 0.03 (10) | 4277 (156)*+ | 273 (13)*+ |
Table 1 Endogeneous thombin potential (ETP) of plasma obtained from rats exposed to
and ultrafine TiO2 as compared to controls. Values denote means (standard deviations).
* Denotes statistically significant differences between the exposed and control group.
+ Denotes statistically significant differences between the exposed groups.
| Dose | N | Thrombin generation (nM/min) |
|---|---|---|
| Control | 15 | 2890 (705) |
| 0.015 (6) | 5 | 3824 (285)* |
| 0.0. (10) | 8 | 4277 (182)* |
| 0.06 (19) | 9 | 3696 (354)* |
| 0.10 (67) | 11 | 3240 (791)* |
| 0.15 (90) | 5 | 3692 (264)* |
Table 2. Endogenous thrombin potential of plasma in rats exposed to various doses of
fine TiO2 particles for 24 hours by inhalation. Values denote means (standard deviations)
* Denotes statistically significant difference between the exposed and control group.
| Particle | Dose | Fibrinogen | vWF |
|---|---|---|---|
| Fine | 0.10 (67) | 109,233) | 140 (92) |
| Fine | 0.15(90) | 1,184692 (630, 111)* | 155 (95) |
| Control | NA | 197,544 (30 1, 868) | 105 (58) |
| Ultrafine | 0.015 (6) | 139,740 (187,621) | 135 (69) |
| Ultrafine | 0.03 (10) | 81,810 (13,951) | 1 85 (130)+ |
| Ultrafine | 0.06 | 99,672 (1 06, 580) | 99 (65) |
| Ultrafine | 0.15 (38) | 52,943 (44,247) | 138 (109) |
Table 3. Fibriogen and vWF of plasma in rats exposed to various doses of fine and ultrafine
Ti02 particles for 24 hours using a Luminex assay. Values denote means (standard deviations)
flourescent units.
* Denotes statistically significant differences between this group and all other exposed groups and contros (p>0.001).
+ Denotes statistically significant differences between this group and control (p<0.01).
| Particle | Dose | Fibrinogen (ug/mL) |
|---|---|---|
| Fine | 0.10 (67) | 20 (12) |
| Fine | 0.15 (90) | 87 (8) |
| Control | NA | 51 (24) |
| Ultrafine | 0.03 (10) | 65 (26) |
| Ultrafine | 0.06 (19) | 68 (27) |
Table 4. Fibrinogen and vWF of plasma in rats exposed to vaiours doses of fine and ultrafine
T0)2 particles for 24 hours using a rat fibrinogen ELISA assay. Values denote means (standard deviations)
| Particle | Dose | Troponin I | Troponin T |
|---|---|---|---|
| Fine | 0.10 (67) | 73,612 (4,150)* | 7.042 (1070)* |
| Fine | 0.15 (90) | 67,793 (3,895) | 5,0.8 (975) |
| Control | NA | 69,495 (2.801) | 61.178 (1704) |
| Ultrafine | 0.15 (6) | 75.026 (5,237)* | 7,059 (404)* |
| Ultrafine | 0.03 (19) | 670,1 (4,4017) | 6,379 (617) |
| Ultrafine | 0.06 (19) | 68,705 (3,446) | 6,467 (350) |
| Ultrafine | 0.15 (38) | 7 1.639 (3,519) | 6.594 (779) |
Table 5. Troponin T and Tropinin I levels in plasma of rats exposed to various doses
of cine and ultrafine Ti02 particles for 24 hours using a LUminex assay. Values denote
mean (standard deviations) flourescent units.
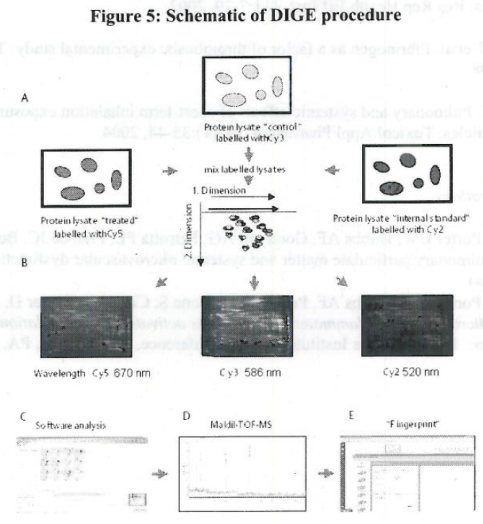
| Sample | Cy2 | Cy3 | Cy5 |
|---|---|---|---|
| 1 | Internal Standard | Control | 0.15 |
| 2 | Internal Standard | Control | 0.03 |
| 3 | Internal Standard | Control | 0.1 |
| 4 | Internal Standard | 0.15 | 0.1 |
| 5 | Internal Standard | 0.03 | 0.1 |
| 6 | Internal Standard | 0.03 | 0.15 |
Table 6. Experimental design
Conclusions:
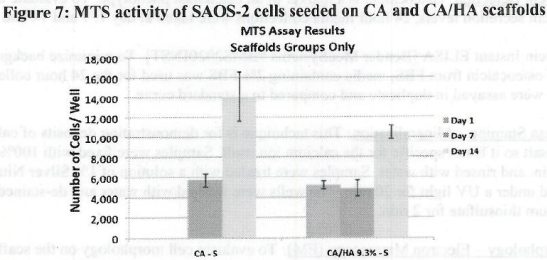
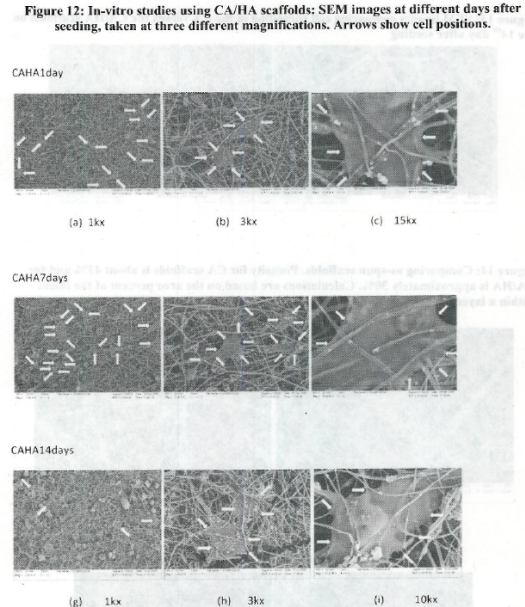
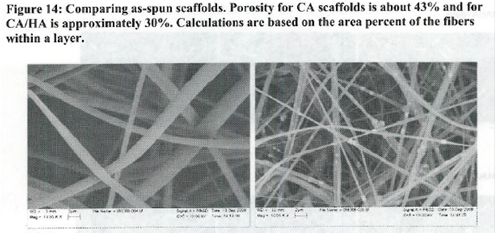
- The use of open nanomanufactured scaffolds (porosity effects)
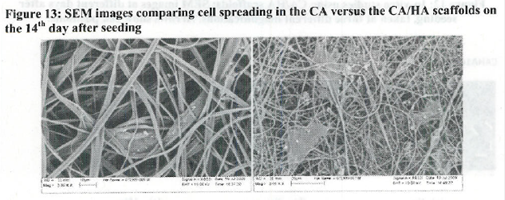
- Relationship between adhesion to nanostructured materials/cues vs cell differentiation
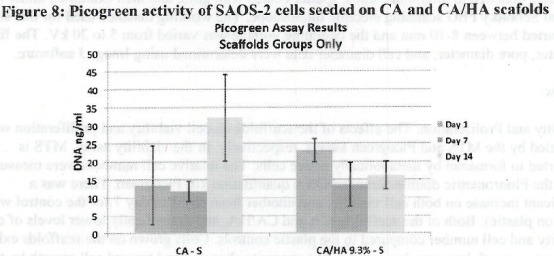
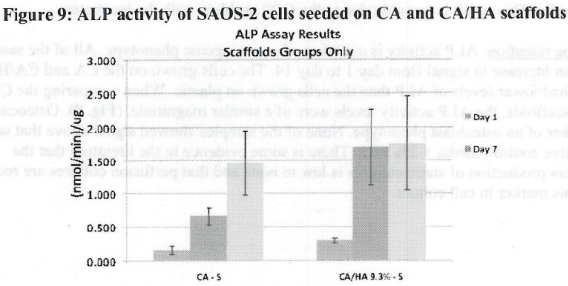
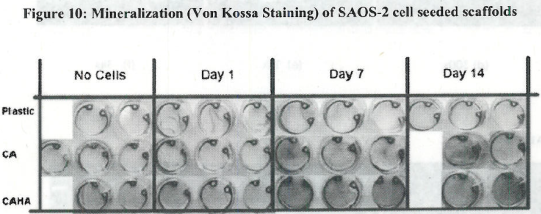
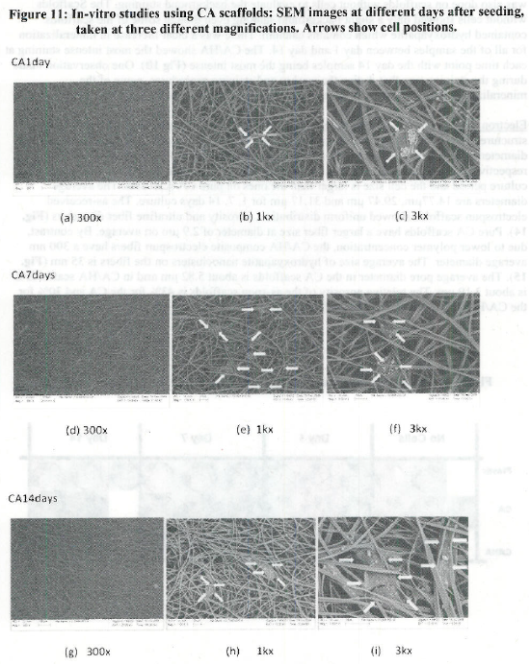
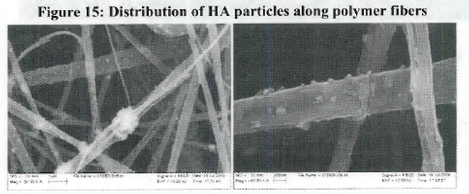
- Observed pattern of mineralization on scaffolds
References:
Journal Articles on this Report : 2 Displayed | Download in RIS Format
| Other project views: | All 22 publications | 5 publications in selected types | All 4 journal articles |
|---|
| Type | Citation | ||
|---|---|---|---|
|
|
Gadre SY, Gouma PI. Biodoped ceramics: synthesis, properties, and applications. Journal of the American Ceramic Society 2006;89(10):2987-3002. |
R832843 (2007) R832843 (Final) |
Exit |
|
|
Gouma PI, Ramachandran K. Electrospinning for bone tissue engineering. Recent Patents on Nanotechnology 2008;2(1):1-7. |
R832843 (2007) R832843 (Final) |
Exit |
Supplemental Keywords:
Nanotoxicology, coagulation, proteins, thrombosis, nanomaterials, biosensors, biocomposites, thrombin;, Health, Scientific Discipline, ENVIRONMENTAL MANAGEMENT, Health Risk Assessment, Risk Assessments, Environmental Microbiology, Biochemistry, Risk Assessment, blood clotting, bioavailability, nanotechnology, blood coagulation enzymes, nanomaterials, nanoparticle toxicity, analysis of chemical exposureRelevant Websites:
Stony Brook University: Material Science and Engineering Exit
Progress and Final Reports:
Original AbstractThe perspectives, information and conclusions conveyed in research project abstracts, progress reports, final reports, journal abstracts and journal publications convey the viewpoints of the principal investigator and may not represent the views and policies of ORD and EPA. Conclusions drawn by the principal investigators have not been reviewed by the Agency.