
Grantee Research Project Results
Final Report: Project 5 -- Architecture Development and Particle Deposition
EPA Grant Number: R832414C005Subproject: this is subproject number 005 , established and managed by the Center Director under grant R832414
(EPA does not fund or establish subprojects; EPA awards and manages the overall grant for this center).
Center: Center for the Study of Metals in the Environment
Center Director: Allen, Herbert E.
Title: Project 5 -- Architecture Development and Particle Deposition
Investigators: Wexler, Anthony S. , Plopper, Charles
Institution: University of California - Davis
EPA Project Officer: Chung, Serena
Project Period: October 1, 2005 through September 30, 2010 (Extended to September 30, 2011)
RFA: Particulate Matter Research Centers (2004) RFA Text | Recipients Lists
Research Category: Human Health , Air
Objective:
This project will quantify alterations in airway structure and architecture due to ozone and/or particle exposure during development and the resulting changes in particle deposition patterns as a function of:
- The time course of exposure during development.
- The ozone concentration and the particle concentration, size, composition, and morphology.
Summary/Accomplishments (Outputs/Outcomes):
We investigated alterations in airway dimensions such as diameter and length due to postnatal exposure to ozone and particle. To handle huge number of airways and enough number of subjects, we developed a computerized process for analyzing airway architecture.
Our overall results suggest that sub-chronic exposure to ozone during lung growth induces significant disruption in airway growth. 3 cycles of 0.5ppm ozone from postnatal day 7 through 25 with 5 days exposure per week resulted in significant decrease in airway diameter at adulthood. The airway alterations was not limited to the distal region but occur extensively from the middle to distal conducting airways. However 2 days exposure per week did not cause any significant alterations. Interaction effects of ozone and ultrafine particles was not appreciable. Exposure to ultrafine particles especially with high organic compounds seems to cause minor changes in airway dimension but more studies are required to reach any conclusion because there was variance in the results between experiments with similar conditions.
Our study showed that alterations due to early ozone exposure do not recover nearly 2 months after exposure has ceased demonstrating a persistent airway structural change following an early life exposure to ozone.
Mathematical models demonstrated that alveolar deposition per minute per unit body mass was appreciably lower for juvenile rats compared to adults and deposition per minute per unit area was lower for juvenile rats over the entire lungs for most particle sizes, implying that the alveolar region of juvenile rats is well protected by their shallow breathing and higher filtering by the extrathoracic region. This result suggest that juvenile lungs could be more susceptible to air pollutants than adults not because of difference in pollutant deposition patterns but because of different biological responses.
We also developed a new imaging technique of particles in laboratory animal models and showed details deposition patterns could be obtained both in the nasal and conducting regions.
Accomplishments by specific aim:
Specific Aim 1: To test whether the normal pattern of dysanaptic growth of airways in neonates alters airway architecture and patterns of airflow from that in adults.
Approach: Neonates will breathe clean, filtered air during development. Lung function tests will be performed. Their lungs will be fixed, excised, and casted. The casts will be imaged to reveal the lung architecture, which will be compared at sequential stages of development.
1. Acquisition of CT image data and Characterization of pulmonary architecture A custom designed micro CT scanner was used to obtain voxel image of the lung casts. In this system, the CMOS detector (Shad-o-Box 2048, Rad-icon Imaging Corp., Santa Clara, CA) with an active area of 50 –100 mm2 and 48 µm pixel size produces 1024–2048 projection images with 12-bit digital resolution. A rotary stage driven by a stepping motor (MDrive 23, Intelligent Motion Systems, Inc., Marlborough, CT) was used to rotate the lung specimens. To avoid motion artifacts of the cast during stage rotation, the cast was fixed in a block of paraffin wax. The 3D CT data set was reconstructed from 1000 projections with a custom developed cone beam reconstruction program using Feldkamp-Davis-Kress (FDK) algorithm. The 3D data set was reconstructed as a 512×512×300 array with corresponding pixel size of 79.4×79.4×86.6 m3 to cover most of rat airways. Sample of projection image is shown in figure 1.
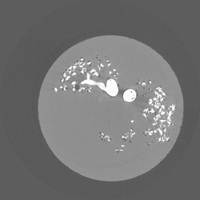
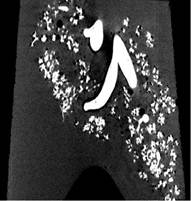
Figure 1. CT image in axial view (left) and sagittal view (right)
We developed a new algorithm to quantify the branching structure of the tree. A general mathematical bifurcation model was developed first that duplicates airway. We used 9 independent geometric parameters to characterize bifurcation geometry. By varying the combination of these geometry parameters various bifurcation shapes can be duplicated. Using the flexible bifurcation model, parameter set that minimizes error between real lung airway (CT image data) and bifurcation model is searched at each airway, extracting key geometric information of pulmonary airways (figure 2). This optimization problem is of large scale and one where a desired global minimum is hidden among many, poor, local minima. The simulated annealing method, known to be suitable for this kind of problem, is adopted to find the best fit. This algorithm was able to successfully analyze airways as small as branch radius is equal to 2 times pixel. Algorithm was validated by error analysis and comparison of statistical results obtained by our technique with previous anatomy studies of rat lung (Phillips 1995, Sera 2003).
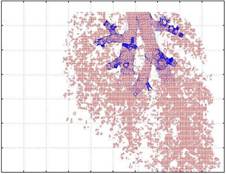
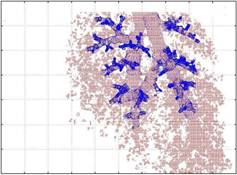
Figure 2. Demonstration of characterization of pulmonary architecture
Figure 3. Airway diameter vs Generation Figure 4. Asymmetry vs Diameter
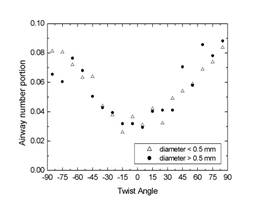
Figure 5. Distribution of twist angle
We analyzed airway architecture of seven normal rats using algorithm developed in previous year. The algorithm was validated by error analysis and comparison of statistical results obtained by comparing our technique with previous anatomy studies of rat lung (Raabe 1976; Phillips 1995). Statistical features between our study and Raabe’s measurements were very similar (Figure 3) except that small airways (diameter smaller than 1mm) of our analysis were much more symmetric than Raabe’s (Figure 4).
Especially current study showed that mean value and standard deviation of geometry parameter are not enough to characterize airway architecture; for example, twist angle, angle between successive bifurcations, is far from normal distribution (Figure 5) so typical distribution of the values of geometry parameter must be taken into account to properly describe pulmonary architecture. Using SAS we are performing statistical analysis including intersubject variance.
3. Postnatal growth of tracheobronchial airways of Sprague Dawley rats
We analyzed conducting airway architecture statistics for male Sprague Dawley rat lungs at ages 15, 28, 40, and 81 days by analyzing CT images from airway silicon casts (Figure 6). Detailed branching characteristics and intersubject variance are presented. This study shows that (a) airway growth in diameter and length is not linear with age, (b) growth of airway length is faster than that of diameter during the 15 to 81 day postnatal period (Figure 7), and (c) asymmetry in airway diameter (ratio of major to minor daughter diameter) increases with age.
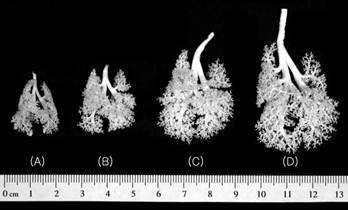
Figure 6. Lung casts at postnatal ages of (A) 15, (B) 28, (C) 40, and (D) 81 days.
Figure 7. Percentage change of (A) diameter and (B) length relative to 15 days old.
Specific Aim 2: To test whether dysanaptic postnatal growth alters the deposition of inhaled particles within the respiratory tract of infants and young children as they grow.
Approach: Neonates and adults will be exposed to different-sized particles, whose deposition pattern will be imaged. Mathematical models of particle deposition will be developed to predict these patterns and identify the cause of the deposition patterns.
1. Particle deposition in juvenile rat lungs
Using geometry information that was obtained in the Specific Aim 1 combined with previous rat lung models, we mathematically modeled particle deposition patterns in rat lungs at 15, 28, 40, and 81 days of age.
In agreement with human subjects, total deposition fraction in rat lung models was not much different between adults and juveniles. For normal breathing conditions, particles smaller than 0.1 μm deposited in extrathoracic airways more in juvenile rats compared to adults whereas alveolar deposition fraction for juvenile rats was smaller compared to adults for most particle sizes. Alveolar deposition per minute per unit body mass was appreciably lower for juvenile rats compared to adults (Figure 1) and deposition per minute per unit area was lower for juvenile rats over the entire lungs for most particle sizes (Figure 2).
This result implies imply that the alveolar region of juvenile rats is well protected by their shallow breathing and higher filtering by the extrathoracic region.
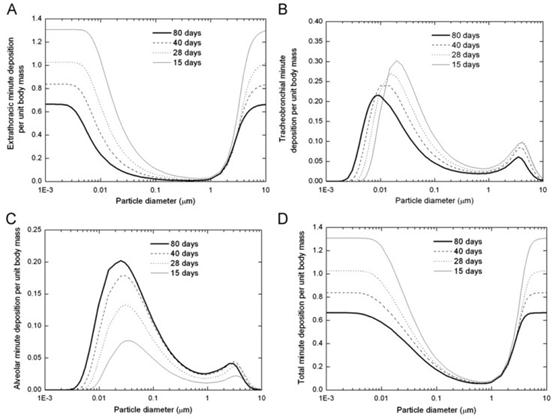
Figure 1. Minute deposition per unit body mass (10-6 ug/min/g) calculated
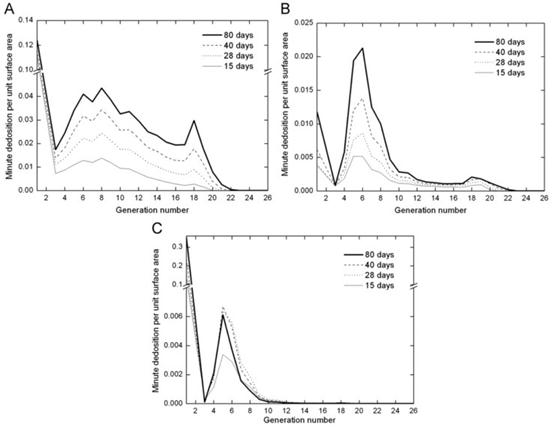
Figure 2. Minute deposition per unit surface area (ug/min/m2) as a function of airway generation
Specific Aim 3: To test whether exposure to oxidant air pollutants during critical phases of airway growth compromises postnatal airway growth.
Approach: Neonates will be exposed to ozone for various time courses related to periods of rapid growth. The approaches in Aim 1 will be used to identify the architecture, which will be compared to normals characterized in Aim 1 to quantify their variation and deviation from the norm.
Specific Aim 4: To test whether exposure to particles and ozone during critical phases of airway growth compromises growth to a greater degree than exposure to particles or ozone alone.
Approach: Neonates will be exposed to a range of particle sizes, compositions, and morphologies, with and without ozone, as a function of stage of development. The approaches and normals from Aim 1 will be used to identify the architecture and alteration due to exposure. Comparing these results to those obtained in Aim 3 will elucidate the hypothesis.
1. Lung architecture change due to ozone with/without PFP73 during development
Ozone was produced from medical grade oxygen by an electric discharge ozonizer. Mean ozone concentrations were within 0.001 ppm of the target level of 0.5. The premixed flames with φ=2.2 produced 9.5x10⁴, 4.3x10⁴ particles/cm3 in the chamber with a diameter (NMAD) of 72.7nm and a mass concentration of 20.0 µg/m3, which we refer to as PFP. Litters of Sprague-Dawley male rat pups housed with lactating mothers were placed in filtered air chambers at age one day. To investigate separate effect of each exposure, rats were exposed to 3 cycles of 5-day ozone with 2-day recovery (Ozone52) or 2-day ozone with 5-day recovery (Ozone25) or exposed to 5-day particle with 2-day recovery (PFP) for 6 hours a day. Exposure began when the pups were 7 days old and ended at 25 days old. To investigate combined effects, rat pups were exposed to PFP plus Ozone52 (OPFP5252) or PFP plus Ozone25 (OPFP5225). At 21 days of age, the rat pups were weaned and transferred into an open wire mesh rodent inhalation cage module with two animals per cage. An age-matched set of pups was exposed to filtered air (FA) using the same protocol. At 28 days old, the animals were transferred from the exposure chambers to HEPA filtered enclosures where they matured until necropsy at 80-81 days of age when lung casting for airway architecture analysis was conducted.
Body weights (BW) and lung volume (LV) were similar between FA group and exposed groups at age of 80 or 81 days except that LV for Ozone 25 was significantly smaller than FA (p=0.015).
Figures 1 and 2 show the differences in airway dimension between FA and exposed groups.
Figure 1. Airway diameter (means ± S.D.) as a function of generation number in the different groups (A) from generation 0 to 10, (B) from generation 11 to 22. * indicates p-value less than
0.05 and + in the x-axis label indicates there is interaction effect between ozone and particle exposures. log y axis in (A), linear in (B).
Figure 2. Airway length (means ± S.D.) as a function of generation number in the different groups (A) from generation 0 to 10, (B) from generation 11 to 22. See Figure 2 caption for definition of symbols.
Figure 1 shows the generation-averaged airway diameter and Table 3 summarizes the differences in airway diameter between FA and exposed groups. Airway diameter for Ozone52 changed the most compared to FA. Diameter for Ozone52 was smaller than FA group by 2.8% in generations 0-10 and by 5.1% in generations larger than 10. Diameter for Ozone52 group was significantly smaller (p<0.05) than FA in 16 of 23 generations and the difference was significant after Bonferroni adjustment (p<0.0022) in 8 generations. In contrast, diameter for the Ozone25 group was larger than the FA group by 3.7% in generations 0-10 and by 2.1% in more distal generations, but was significant (p=0.05) in only 4 generations and not after Bonferroni adjustment. Diameter for PFP was smaller than the FA group by
2.8% in generations 0-10 and slightly larger (0.7%) in more distal generations, but was only significant (p<0.05) in 4 generations and in only one after Bonferroni adjustment.
Airway diameter for OPFP5252 was smaller than FA group by 3.4% in generations 0-10 and by 4.7% in more distal ones. There was an interaction effect between ozone and particle exposures only in one generation (Figure 1b). There was no appreciable change in airway diameter for OPFP5225; diameter for OPFP5225 was larger than FA by 0.8% in generations 0-10 and smaller than FA by 0.8% in more distal ones (Figure 1b).
Figure 2 shows airway length as a function of generation and Table 4 summarizes the differences in airway length between FA and exposed groups. Airway length for Ozone52 was similar with FA group in generations 0-10 and smaller than FA by 4.8% in more distal ones. Length for Ozone52 group was significantly smaller (p<0.05) than FA in 5 generations and the difference was significant after Bonferroni adjustment (p<0.0022) in 2 generations. Airway length for PFP and Ozone 25 was similar to the FA group.
Airway length for OPFP5252 was smaller than FA group by 1.8% in generations 0-10 and by 5.6% in more distal ones. There was no interaction effect between ozone and particle exposures (Figure 2). There was no appreciable change in airway length for OPFP 5225; length for OPFP5225 was smaller than FA by 0.5% in generations 0-10 and smaller by 2.6% in more distal generations (Figure 2).
There were no appreciable differences in branching angle and rotation angle between exposed groups and FA group.
2. Lung architecture, function changes due to PFP212 exposure and cell proliferation gene expression change due to DFP230, PFP73, PFP212 during development
The diffusion flame produced a concentration of 2.4x10⁴ particles/cm3 in the exposure chamber with a number mean aerodynamic particle diameter (NMAD) of 230 nm and a mass concentration of 71.7 µg/m3 (DFP230). The premixed flames with φ=2.2, 2.5 produced 9.5x10⁴, 4.3x10⁴ particles/cm3 in the chamber with a diameter (NMAD) of 72.7, 212.0 nm and a mass concentration of 20.0, 67.4 µg/m3, respectively, which we refer to as PFP73 and PFP212. Litters of male Sprague-Dawley rat pups housed with lactating mothers were placed in filtered air chambers at age one day. Exposure for six hours a day, five days a week for three weeks began when the pups were seven days old and ended at 25 days old. A matched set of pups was exposed to filtered air using the same protocol. At 28 days old, the animals were transferred from the exposure chambers to Bioclean hoods where they matured until necropsy at 80-81 days of age.
Total lung capacity (TLC) normalized by body weights (BW) and BW itself were similar between FA group and exposed groups (p=0.8, 0.277, 0.076 for DFP230, PFP73 and PFP212 respectively) at age of 80 or 81 days.
Figs. 3-4 show the generation-averaged airway diameter and length. Contrary to PFP73, there were no significant differences in airway diameter and length between the FA and PFP212.
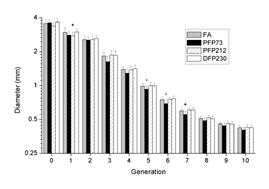
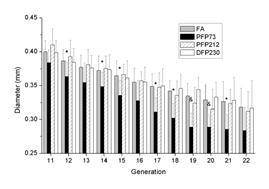
Figure 3. Airway diameter as a function of generation number in the different groups (a) from generation 0 to 10, (b) from generation 11 to 22. * indicates p-value less than 0.05 and & indicates p-value less than 0.0022 (Bonferroni adjustment).
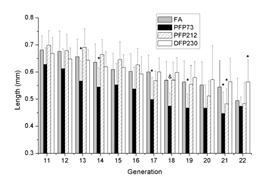
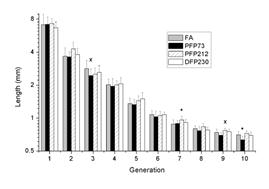
Figure 4 . Airway length as a function of generation number in the different groups (a) from generation 0 to 10, (b) from generation 11 to 22.
Exposure to PFP212 resulted in a significant increase (p = 0.013) in the methacholine EC200R indicating decrease in airway responsiveness in this group. Exposure to DFP230 or PFP73 did not significantly alter airway responsiveness to methacholine challenge when compared to FA. Exposure to PFP212 resulted in a significant increase in Rs (p = 0.005) and I (p = 0.001) compared to FA exposure. In contrast, exposure resulted in a significant decrease in I in the PFP73 (p = 0.001) group compared to FA. In addition, exposure to DFP230 resulted in a significant increase in H compared to FA exposure (p = 0.002).
Proliferating Cell Nuclear Antigen (PCNA), a gene associated with cell proliferation was quantitatively assayed using RT-PCR. Gene expression significantly decreased in neonatal rat airways following a single 6-hour exposure to PFP73 (p=0.0034), increased subsequent to PFP212 (p<0.0001) and remained unchanged from DFP230 (p=0.0675), as compared with FA control animals (Fig. 3A). To qualitatively measure protein abundance, paraformaldehyde fixed lung sections were stained against PCNA immunohistochemically. Basal PCNA positive cells, identified as cells containing dense nuclear staining, were abundant across both airway epithelium and the peribronchiolar interstitium (Fig. 5B). Abundance was diminished in PFP212 (Fig. 5C) and DFP230 (Fig. 5E) groups, but a plethora of PCNA positive proliferating cells were observed in the PFP73 group (Fig. 5D).
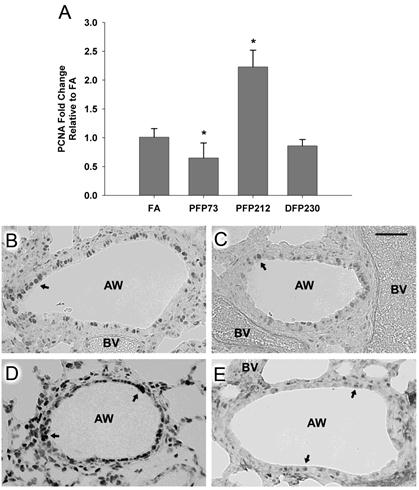
Figure 5. Expression of Proliferating Cell Nuclear Antigen (PCNA) mRNA and protein in the airways of neonatal 7 day old rats were evaluated. Gene expression was measured in microdissected airways using qRT-PCR and results were calculated using the comparative Ct method. GAPD was the reference gene. * denotes significance at P<0.05.
Specific Aim 5: To test whether compromised airways produce altered patterns of intrapulmonary particle distribution and deposition.
Approach: Normal adults and those exposed to pollutants during development will be exposed to different-sized particles, whose deposition pattern will be imaged. Mathematical models of particle deposition will be developed to predict these patterns and identify the cause of the deposition patterns, similar to Aim 2.
1. Measuring particle deposition in rat airways.
We developed methods for identifying airway geometry in the conducting airways (Lee et al 2008). In this method, the rat lungs are cast using a mixture of silicone and oil, where the lung is bleached once the silicone has cured. A micro-CT scanner is used to scan the cast lung, and in house software is used to generate detailed airway characteristics. The availability of methods and software for quantifying the airway tree, led us to explore the possibility of imaging the airways and the particles deposited in them so that we could quantify airway-by-airway particle deposition.
One of the major shortcomings of using a micro-CT scanner to image deposited particles is that we cannot ensure deposited particles to stay in place during the process of casting, bleaching and imaging. A block-face imaging cryomicrotome from Barlow Scientific, Inc. can be used to image the airways and particles (Barlow and Kelly, 1997; Kelly et al., 2000). The imaging cryomicrotome serially sections through frozen organs and images the exposed surface using various excitation and emission filters. Slice thickness and imaging resolution can be varied using software and hardware controls to image up to four different fluorescent colors. The imaging method produces voxels as small as 10 um so tissue boundaries and particle locations could conceivably by imaged to this accuracy. With respect to the initial casting process, the process of casting organs for imaging with a cryomicrotome has been modified to ensure that particles are immobile.
Method Validation
Rat nasal airways are quite complex but much less so than the conducting airways and the nasal airway length scales are much larger than the conducting airways so they are an easier place to begin this work. To find the detailed location of the particles in the nasal airways the surrounding tissue should not be bleached and the particles should not move during the scanning process. Over the course of many experiments we have come up with a technique of casting the nasal airways to freeze the deposited particles in place. In addition, it is easier to validate the method in the nasal airways because they are much more accessible. To validate the method, we used a hypodermic needle to place fluorescent particles at a few locations in the nasal passage of a rat airway. We then used our procedure to image the nasal passage and the particle location to ensure that the imaging technique located the particles in the same location where we placed them.
Figures 1a show this rat’s reconstructed nasal airways viewed from two different viewpoints. Figure 1b shows the reconstruction of the particle blobs injected into the nasal cavity, viewed from the same vantage points as Figures 1a. Figure 2a shows a blowup of one of the particle blobs with tissue fluorescence in the background. Figure 2b shows an image of the lumen in the same plane as the blob. Our experiments with injecting the yellow spots in the rat nose and casting the airway with a silicone mixture shows that the method is feasible to detect particles in the airways.
Figure 1 a). Airway Isosurface Rendering. b) Particle Blob Isosurface Rendering.
Figure 2. Cross sectional image of airway lumen. Black and white background is due to fluorescence of the tissue. 2a: one particle blob (left) colored red. 2b: the lumen at the same cross section (right) colored blue.
Imaging rat nasal airways with deposited particles
After the new method for ensuring deposited particles are immobile and stationery during the entire process of necropsy, casting and slicing, an adult rat was exposed to aerosolized Dayglo yellow dye particles for 2 hrs using a aerosol dust generator (Carvacho 2001). The rat was placed in a nose only exposure chamber (Teague 2005). Figure 3 shows the exposure setup, Saturn yellow dye is placed inside the aerosol generator which is aerosolized, the particles pass through an electrostatic neutralizer to remove any charge buildup. The rat breathes the particles flowing into the chamber which is constantly being supplied with air. Rats were exposed to aerosolized yellow dye particles for a period of 2 hours with particle concentration of 1 mg/m3 (approx) monitored using a TSI Dusttrak. The Rat head is cast using a silicone mixture and allowed to cure, once cured the specimen is then shipped frozen to Barlow Scientific for imaging.
Figure 3. Particles are aerosolized using the aerosol generator, and rats are exposed to the particles entering the exposure chamber.
Figure 4a shows the rendering of the rat nasal airway and figure 4b the deposited yellow particles along the airway. In figure 5a, a cross-section of the airway is shown, and figure 5b shows the deposited yellow particles as bright spots with background auto-fluorescence. These images clearly indicate that we can image deposited particles in the nasal airways.
Imaging particle deposition in bronchial lung airways.
Imaging of particle deposition within the thoracic airways was performed using a modified version of the method used to perform nasal particle imaging. After inhalation of fluorescent particles, the rat lungs inflated with helium and flash-frozen to lock the particles in place and cast at this temperature with silicone and fluorescent dye to color and support the lumen. Once the cast is cured, an imaging cryomicrotome sections and images the airways as well as the deposited fluorescent particles. Separate color channels are used to image deposited particles and airway lumen. Figure 4 shows images taken in the particle color (red) and the lumen fill color (blue) overlaid upon each other with an intensity threshold applied (Figure 5a). The resulting image stacks are combined for a 3-dimensional image (Figure 5b) which can be used to qualitatively examine particle locations with respect to the airway structure. Computer analysis of both image stacks is used to provide numerical analysis of particle concentration by location.
Figure 5. (a) Fluorescent inhaled particles (red) and airway lumen (blue) shown for a single transverse slice across the lung, and (b) 3-D reconstruction from combined image stacks of particles and lumen.
We developed algorithm that determines particle deposition airway-by-airway from the 3-dimensional cryomicrotome images and data analysis with a sample from 2 hour exposed rat lung is underway.
2. Airway-by-airway comparison for differentiating airway trees.
Generation-based analysis has limitations for describing monopodial branching trees such as rat lungs. Also, geometry alterations can be obscured in the generation-averaging. To complement generation- based analysis, we developed airway-by-airway analysis. The algorithm is outlined below.
First, the main tree of the rat airways was defined; a branch was identified with the main tree if the number of conducting airways attached to it was equal to or larger than 14. Note that a dichotomous tree with three generations has 14 daughter branches. Second, we determined which airways correspond to each other in the main tree to compare airways to each other. These two comparable airways were called pairs. Third, to measure differences between two trees, the difference between each pair normalized by their mean value was calculated for airway diameter and length and the difference between each pair was calculated for branching angle and rotation angle, using Eq. (1). In Eq. (1), xA and xB were geometric parameters such as airway diameter for a tree A among exposed lungs and a tree B among FA lungs respectively and N was the total number of pairs associated between the two main trees.
If the average difference from all combinations between exposed and FA groups had a positive value, the corresponding geometric parameter of exposed group was larger than FA. To test the significance of the difference between exposed and FA groups, permutation tests with null distribution were performed on 50,000 permuted samples.
Airway-by-airway analysis has advantage over generation-based analysis in that the generation scheme compares averages of geometric parameter between trees whereas the airway-by-airway analysis compares the associated pairs to judge the degree of difference between trees.
By comparing the trees airway-by-airway, we found that that rotation angle of the DFP group is significantly larger than FA, which is not as certain in the generation-based analysis (Figure 6).
Figure 6. (a) Average normalized difference in airway diameter and length between DFP and FA and (b) average difference in branching angle and rotation angle between DFP and FA. Positive value indicates that the corresponding geometric parameter of DFP is larger than FA. * indicates p-value less than 0.05 from Permutation test.
Journal Articles on this Report : 13 Displayed | Download in RIS Format
| Other subproject views: | All 21 publications | 13 publications in selected types | All 13 journal articles |
|---|---|---|---|
| Other center views: | All 128 publications | 71 publications in selected types | All 64 journal articles |
| Type | Citation | ||
|---|---|---|---|
|
|
Bein KJ, Zhao Y, Wexler AS. Conditional sampling for source-oriented toxicological studies using a single particle mass spectrometer. Environmental Science & Technology 2009;43(24):9445-9452. |
R832414 (Final) R832414C005 (Final) |
Exit Exit Exit |
|
|
Lee DY, Wexler AS, Fanucchi MV, Plopper CG. Expiration rate drives human airway design. Journal of Theoretical Biology 2008;253(2):381-387. |
R832414 (2009) R832414C005 (2008) R832414C005 (Final) |
Exit Exit Exit |
|
|
Lee DY, Wallis C, Wexler AS, Schelegle ES, Van Winkle LS, Plopper CG, Fanucchi MV, Kumfer B, Kennedy IM, Chan JKW. Small particles disrupt postnatal airway development. Journal of Applied Physiology 2010;109(4):1115-1124. |
R832414 (Final) R832414C001 (2010) R832414C005 (2010) R832414C005 (Final) |
Exit Exit Exit |
|
|
Lee DY, Wallis CD, Van Winkle LS, Wexler AS. Disruption of tracheobronchial airway growth following postnatal exposure to ozone and ultrafine particles. Inhalation Toxicology 2011;23(9):520-531. |
R832414 (Final) R832414C005 (Final) |
Exit |
|
|
Lee DY, Wexler AS. Simulated annealing implementation with shorter Markov chain length to reduce computational burden and its application to the analysis of pulmonary airway architecture. Computers in Biology and Medicine 2011;41(8):707-715. |
R832414 (Final) R832414C005 (Final) |
Exit |
|
|
Lee DY, Willits N, Wexler AS. Detecting alterations in pulmonary airway development with airway-by-airway comparison. Annals of Biomedical Engineering 2011;39(6):1805-1814. |
R832414 (Final) R832414C005 (Final) |
Exit Exit |
|
|
Lee DY, Srirama PK, Wallis C, Wexler AS. Postnatal growth of tracheobronchial airways of Sprague-Dawley rats. Journal of Anatomy 2011;218(6):717-725. |
R832414 (Final) R832414C005 (Final) |
Exit Exit Exit |
|
|
Lee DY, Wexler AS. Particle deposition in juvenile rat lungs: a model study. Journal of Aerosol Science 2011;42(9):567-579. |
R832414 (Final) R832414C005 (Final) |
Exit Exit Exit |
|
|
Lee D, Park SS, Ban-Weiss GA, Fanucchi MV, Plopper CG, Wexler AS. Bifurcation model for characterization of pulmonary architecture. Anatomical Record 2008;291(4):379-389. |
R832414 (2009) R832414C005 (2007) R832414C005 (2008) R832414C005 (Final) |
Exit Exit Exit |
|
|
Lee D, Fanucchi MV, Plopper CG, Fung J, Wexler AS. Pulmonary architecture in the conducting regions of six rats. Anatomical Record 2008;291(8):916-926. |
R832414 (2009) R832414C005 (2008) R832414C005 (Final) |
Exit Exit Exit |
|
|
Srirama PK, Wallis CD, Lee DY, Wexler AS. Imaging extra-thoracic airways and deposited particles in laboratory animals. Journal of Aerosol Science 2012;45:40-49. |
R832414 (Final) R832414C005 (Final) |
Exit Exit Exit |
|
|
Tebockhorst S, Lee D, Wexler AS, Oldham MJ. Interaction of epithelium with mesenchyme affects global features of lung architecture: a computer model of development. Journal of Applied Physiology 2007;102(1):294-305. |
R832414 (2009) R832414C005 (2007) R832414C005 (2008) R832414C005 (Final) |
Exit Exit Exit |
|
|
Wexler AS, Johnston MV. What have we learned from highly time-resolved measurements during EPA's Supersites Program and related studies? Journal of the Air & Waste Management Association 2008;58(2):303-319. |
R832414 (Final) R832414C005 (Final) |
Exit Exit |
Supplemental Keywords:
Health, RFA, Air, Scientific Discipline, PHYSICAL ASPECTS, ENVIRONMENTAL MANAGEMENT, Health Risk Assessment, Physical Processes, Risk Assessments, particulate matter, Environmental Chemistry, Biochemistry, Risk Assessment, particulate matter components, biological mechanisms, chemical characteristics, airborne particulate matter, human exposure, cardiopulmonary responses, animal model, children's health, exposure, PM, atmospheric particulate matter, toxicology, acute cardiovascular effects, human health effects, cardiovascular disease, human health risk, exposure assessmentProgress and Final Reports:
Original AbstractMain Center Abstract and Reports:
R832414 Center for the Study of Metals in the Environment Subprojects under this Center: (EPA does not fund or establish subprojects; EPA awards and manages the overall grant for this center).
R832414C001 Project 1 -- Pulmonary Metabolic Response
R832414C002 Endothelial Cell Responses to PM—In Vitro and In Vivo
R832414C003 Project 3 -- Inhalation Exposure Assessment of San Joaquin Valley Aerosol
R832414C004 Project 4 -- Transport and Fate Particles
R832414C005 Project 5 -- Architecture Development and Particle Deposition
The perspectives, information and conclusions conveyed in research project abstracts, progress reports, final reports, journal abstracts and journal publications convey the viewpoints of the principal investigator and may not represent the views and policies of ORD and EPA. Conclusions drawn by the principal investigators have not been reviewed by the Agency.