
Grantee Research Project Results
2016 Progress Report: Next Generation LUR Models: Development of Nationwide Modeling Tools for Exposure Assessment and Epidemiology
EPA Grant Number: R835873C003Subproject: this is subproject number 003 , established and managed by the Center Director under grant R835873
(EPA does not fund or establish subprojects; EPA awards and manages the overall grant for this center).
Center: Center for Air, Climate, and Energy Solutions
Center Director: Robinson, Allen
Title: Next Generation LUR Models: Development of Nationwide Modeling Tools for Exposure Assessment and Epidemiology
Investigators: Marshall, Julian D. , Brauer, Michael , Hankey, Steve , Millet, Dylan B
Institution: University of Minnesota , University of British Columbia , Virginia Tech
EPA Project Officer: Chung, Serena
Project Period: May 1, 2016 through April 30, 2021
Project Period Covered by this Report: May 1, 2016 through April 30,2017
RFA: Air, Climate And Energy (ACE) Centers: Science Supporting Solutions (2014) RFA Text | Recipients Lists
Research Category: Air , Climate Change
Objective:
The aim of Project 3 is to develop multi-pollutant (PM2.5, NO2, O3, CO, and subspecies of PM2.5<) empirical models and then to apply those models at high spatial resolution (~0.1 km with estimates at Census block centroids), with widespread spatial extent (continental United States), and for many years (c.1980 to present). In the Center for Air, Climate, and Energy Solutions (CACES), the primary use for these concentration estimates will be for exposure assessment in the epidemiological analyses (Project 5). Additional uses include to track long-term trends in environmental justice metrics, to explore within-city and neighborhood-scale modifiable factors of urban form and the built-environmental that affect exposure, and as a potential framework for distribution of sub-grid exposures in policy scenarios from Project 4.
Progress Summary:
The Project 3 goals for year 1 were to (1) assemble and process the necessary air pollution and geographic data for developing empirical air pollution models, (2) develop and test our modeling framework, and (3) to create preliminary models. Preliminary model estimates will be used for extensive model evaluation in year 2, and to provide preliminary estimates for the epidemiological analyses (Project 5). Our progress towards meeting those goals is as follows:
Assembling data: We have completed this task. We leveraged existing data and infrastructure at the University of Washington from the Multi-Ethnic Study of Atherosclerosis and Air Pollution (MESA Air) and ancillary studies; available data include US EPA monitoring data and geographic covariates (details: www.uwchscc.org/MESAAP/Documents/MESAAirDOOP.pdf). To our knowledge, we now have all existing monitoring data for PM2.5, PM10, NO2, SO2, CO, and O3 from Air Quality System (AQS), IMPROVE, and STN monitors for 1980-2015. Monitoring data have undergone additional quality control as part of the MESA Air data protocol, including assessment for level of detection (LOD, values below LOD are set to one half LOD), spuriously high data (assessed for unit reporting errors). Monitor-level annual averages were provided for each pollutant/year, provided the monitor satisfied criteria for a minimum number of data points (41 for 1-in-6 day measurements; 82 for 1-in-3 day measurements; 244 for daily measurements) and maximum gap (45 days) between measurements.
Geographic covariates include year 2000 national road and railway network, year 2000 and 2010 U.S. Census population, U.S. Geological Survey (USGS) land use and land cover from satellite (year 2006) and historical aerial photography (~1970-80s), National Emissions Inventory (NEI) emission sources (2002 NEI), and satellite-based vegetation estimates (year 2006). We have assembled additional years of USGS satellite-based land use and land cover data (1992, 2001, 2011), U.S. Census population (1990), and road network data (1992 and 2016 US Census TIGER). Covariates were processed as proximity (distance to feature) and buffer (total or percent of feature within various circular buffers) variables at monitor locations for model building, and at U.S. Census block centroids for model predictions. (Census blocks are the smallest unit delineated by the U.S. Census.)
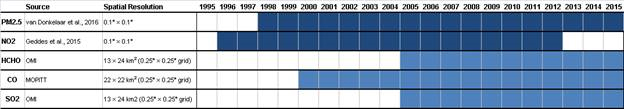
Finally, we also have assembled and processed available tropospheric satellite-based measurements of air quality (see Figure 3.1). Satellite-based PM2.5 and NO2 estimates we employ are published, publicly available, and estimates of ground-level concentrations are based on combined satellite and global chemical transport model data. Formaldehyde (HCHO) and SO2 satellite data are tropospheric column estimates from the Ozone Monitoring Instrument, CO satellite data are daytime surface level estimates from the Measurements Of Pollution In The Troposphere (MOPITT) combined Near Infrared and Thermal Infrared retrieval. HCHO, SO2, and CO swath data are screened for data flags, cloudy scenes (> 30% cloud cover), and high solar zenith angle (> 85°), then gridded annually to 0.25° resolution employing an oversampling approach.
| |
| Figure 3.1: Summary of satellite-based air quality measurements obtained and processed for use as geographic covariates. Shading indicates available years of data, for composite (dark blue) versus single instrument (light blue) satellite products. |
Developing modeling framework: Our modeling approach employs 2-stage partial least squares (PLS) + Universal Kriging to estimate annual average concentrations. PLS leverages predictive information from a large number of geographic covariates with less concern for model overfitting, while also limiting the impact of geographic covariate outliers. Making predictions at ~8-10 million Census block centroids for 6+ pollutants and 36 years (1980-2015) is a computationally intensive task. In order to address this issue, we explored (1) parsimonious models using a forward stepwise selection of a small number of "optimal" variables for PLS (relative to the ~300-400 available covariates) in order to reduce the number of covariates needing to be calculated for predictions, and (2) improved processing of covariates employing parallel processing with PostGIS.
Employing PostGIS and parallel processing, we were able to calculate our geographic covariates at all Census block centroids in ~20 days on a 10-node server. The improvement in processing of covariates with PostGIS (~100× faster than our previously published models using Python and ArcGIS) has dramatically improved our (and other researchers) ability to make fine-scale spatial predictions over large geographic scales.
Our exploration of parsimonious models illustrated that only a relatively small number of optimally selected variables (~10-20) was necessary for robust hold-out (10-fold random cross validation [CV], and 10-fold spatially clustered cross validation [CCV]) model performance. Results also illustrated marginally worse performance for models with all covariates, suggesting some model overfitting when hundreds of covariates are included in constructing PLS composite variables. Parsimonious models also have the benefit of higher interpretability of selected variables for diagnosis model prediction issues (e.g., poor performing regions, discontinuities). Therefore, we will employ our parsimonious modeling approach for model building.
Our primary modeling approach consists of annual spatial-only models; however, we will employ a spatiotemporal modeling framework with back-extrapolated long-term temporal trends for pollutants/years with limited historical monitoring coverage. Our spatiotemporal models employ linear temporal trends and long-term means estimated at monitor locations. Models of the long-term mean follow the same approach as our annual spatial-only models. The temporal component is added by employing PLS composite variables for the temporal trend (with back extrapolation for years with limited model coverage) and Kriging of the spatiotemporal residuals. We have done preliminary tests of this modeling approach, using the aforementioned parsimonious model strategy for PLS. Similar to the annual models, models with a relatively small number of variables exhibit better model performance than models including all geographic covariates. We will conduct more rigorous testing of our historical spatiotemporal modeling approach during year 2.
Preliminary models: Based on the initial results from testing our modeling framework, we have developed preliminary models with 5, 10, and 30 "optimal" variables (selected via forward stepwise selection) included in developing PLS components. The preliminary models have been developed for PM2.5 (year 1999-2015), NO2 (1979-2015), SO2 (1979-2015), O3 (1979-2015), and CO (1990-2015).
The preliminary PM2.5 models exhibit good performance across all years (CV-R2: 0.72-0.90), although performance is lower when considering spatially clustered cross validation (CCV-R2: 0.41-0.71), an approximation of performance at locations far from monitoring locations. Preliminary NO2 models exhibit good performance for years 1981-2014 (CV-R2: 0.73-0.89, CCV-R2: 0.45-0.76). NO2 monitor coverage for years 1979 and 1980 is limited, and resulting model performance is poor for these years; however, our health studies (Project 5) only require model estimates as early as 1982. Modeling NO2 for these years may improve from additional historical covariates, including historical CTM estimates (Project 1), or from our spatiotemporal modeling approach. These options will be explored in year 2. From examining prediction maps we have identified discontinuities in predictions for the NO2 model (e.g., spuriously high concentrations off the coast of New York City), corresponding to discontinuities in the underlying satellite NO2 data. These discontinuities appear to be the result of a surface-to-column conversion that employs a global CTM with large grid cells (2°×2.5°). Grid cells partially covering large coastal cities (e.g., New York, Los Angeles) and open ocean exhibit discontinuities at cell boundaries. In order to address this issue, we are currently exploring using the unconverted column NO2 data.
Preliminary O3 models with 10-30 variables included in PLS exhibit good performance for years 1990-2014 (CV-R2: 0.69-0.79, CCV-R2: 0.52 -0.71). Models for earlier years (1979-1989) exhibit much poorer performance (CV-R2: 0.51-0.66, CCV-R2: 0.09-0.39). More work will be needed in year 2 to identify why pre-1990 O3 model performance diminishes prior to 1990. We will explore changes in the number and distribution of monitoring locations, concentrations, the selected geographic covariates, and prediction maps over this time period in order to better understand and address poor performance in these early years.
Preliminary SO2 and CO models exhibit poor-to-moderate model performance (CV-R2: 0.20-0.71 and 0.23-0.57 for SO2 and CO models, respectively). Model performance far from other monitors is particularly poor (CCV-R2: 0.0-0.43, 0.0-0.47 for SO2 and CO models, respectively). Unlike the NO2 and O3 models, performance does not appear to degrade over time, exhibiting poor model performance across more recent and historical predictions. These models will require more extensive inspection in year 2 to assess possible explanations for the variation in model performance, and potential steps to address them.
Future Activities:
Model development in year 2: We will continue to assess the geographic covariates selected into each model, particularly for poorer performing pollutants and years. To do this, we will: (1) compare covariate and PLS composite score values at monitoring locations and Census block centroids, looking for variables that are not well captured by the monitoring space; (2) examine prediction maps for individual pollutants and years, looking for spurious predictions and their underlying causes; and (3) examine poor performing monitor locations and/or model regions and assess for potential missing explanatory variables. In addition to these steps, we will also be exploring the addition of historical CTM predictions from Project 1. These predictions may be particularly helpful for pre-1990 models when GIS data are limited. In addition, some of the intermediate data used to develop the emissions inventories employed in the historical CTM modeling may be useful as proximity variables (i.e., distance to feature) and could be included in model testing.
Preliminary models for Project 5: We have shared preliminary model predictions for NO2 (1990-2014) and PM2.5 (1999-2014) with Project 5 researchers in order to test the data transfer and introduce them to the planned file structure. In year 2, we will continue to coordinate with Project 5 researchers in order to address data transfer issues and ensure seamless data transfer of final model estimate in year 3. We are planning to provide Census block centroid estimates for all years (1980-2015), and county-level population-weighted estimates for years 1982-2013 to correspond with National Center for Health Statistics (NCHS) county mortality data.
Journal Articles on this Report : 1 Displayed | Download in RIS Format
| Other subproject views: | All 1 publications | 1 publications in selected types | All 1 journal articles |
|---|---|---|---|
| Other center views: | All 148 publications | 136 publications in selected types | All 136 journal articles |
| Type | Citation | ||
|---|---|---|---|
|
|
Clark LP, Millet DB, Marshall JD. Changes in transportation-related air pollution exposures by race-ethnicity and socioeconomic status:outdoor nitrogen dioxide in the United States in 2000 and 2010. Environmental Health Perspectives 2017;125(9):097012 (10 pp.). |
R835873 (2016) R835873 (2017) R835873 (2018) R835873 (Final) R835873C001 (2016) R835873C003 (2016) |
|
Supplemental Keywords:
Remote-sensing, land use patterns, urban air quality, modeling tools, exposure assessment, epidemiologyRelevant Websites:
The Center for Air, Climate, and Energy Solutions Exit
Progress and Final Reports:
Original AbstractMain Center Abstract and Reports:
R835873 Center for Air, Climate, and Energy Solutions Subprojects under this Center: (EPA does not fund or establish subprojects; EPA awards and manages the overall grant for this center).
R835873C001 Mechanistic Air Quality Impact Models for Assessment of Multiple Pollutants at High Spatial Resolution
R835873C002 Air Quality Observatory
R835873C003 Next Generation LUR Models: Development of Nationwide Modeling Tools for
Exposure Assessment and Epidemiology
R835873C004 Air Pollutant Control Strategies in a Changing World
R835873C005 Health Effects of Air Pollution and Mitigation Scenarios
The perspectives, information and conclusions conveyed in research project abstracts, progress reports, final reports, journal abstracts and journal publications convey the viewpoints of the principal investigator and may not represent the views and policies of ORD and EPA. Conclusions drawn by the principal investigators have not been reviewed by the Agency.