
Grantee Research Project Results
Final Report: Assessing the Potential Impact of Global Warming on Indoor Air Quality and Human Health in Two US Cities: Boston, MA and Atlanta, GA
EPA Grant Number: R835755Title: Assessing the Potential Impact of Global Warming on Indoor Air Quality and Human Health in Two US Cities: Boston, MA and Atlanta, GA
Investigators: Koutrakis, Petros , Mickley, Loretta J. , Zanobetti, Antonella , Sarnat, Jeremy , Sarnat, Stefanie Ebelt
Institution: Emory University , Harvard University
EPA Project Officer: Chung, Serena
Project Period: November 1, 2014 through October 31, 2017 (Extended to October 31, 2018)
Project Amount: $999,948
RFA: Indoor Air and Climate Change (2014) RFA Text | Recipients Lists
Research Category: Air Quality and Air Toxics , Air , Climate Change
Objective:
Rising temperatures associated with climate change are expected to impact future home air exchange rates, decreasing air exchange during the summer and increasing these rates during the spring and fall relative to the present. These changes in turn will alter the contributions of both indoor and outdoor PM2.5 sources to indoor air quality, and subsequently lead to differential effects of PM2.5 exposures on human health. To investigate this, we propose to use the indoor/outdoor sulfur ratio to link concentrations of indoor particles of outdoor and indoor origin to ambient temperature. We will estimate the effects of outdoor PM2.5 on total and cause-specific mortality in each city, and ultimately examine the impact of climate change-related differences in indoor particle exposures on PM2.5-related mortality.
Summary/Accomplishments (Outputs/Outcomes):
In our investigation, we collected data in two cities with different climatic conditions: Boston and Atlanta. Boston's winters are cold, where Atlanta's are milder and Atlanta's summers are hotter than Boston. The Boston data is retrospective; using existing data allowed us to begin by quantifying the relationship between future changes in ambient temperature and fine particle (PM2.5) infiltration in the Greater Boston area. In our published paper (Lee et al., 2017), we assembled a large database of archived (retrospective) indoor and outdoor air pollutant measurements from two cohorts in Boston between 2006 and 2010, consisting of 662 samples from 340 homes with weekly integrated samples collected across all 12 calendar months in the Greater Boston area. Selected variables included geographical location of each home, air pollutant sampling duration, average indoor air pollutant concentrations, and air conditioning (AC) usage. Window opening was highly correlated with AC usage and was not included in the database. An assumption underlying use of sulfur ratio (Sr) as a surrogate of PM2.5 infiltration factor (PM2.5 Finf) is the absence of indoor sources of sulfur. For this reason, samples with Sr > 1 were considered to be impacted by indoor sources and were excluded from data, together with the samples that contained missing values for Sr (40 samples from 27 homes). Furthermore, 7 samples were excluded because their sampling duration exceeded 10 days, and one sample was excluded due to inconsistent records among variables. A total of 614 samples from 321 homes were used in our statistical analysis.
Daily outdoor sulfur samples were collected at the Harvard Supersite located on the top of the University Countway Library. These daily data were used to estimate outdoor sulfur concentration that corresponded to each multi-day indoor sampling period. Sulfur is a unique tracer for indoor PM2.5 of outdoor origin because it seldom has indoor sources and it is a regional pollutant, and thus it exhibits very little spatial variability. This makes it possible to use outdoor sulfur measurements at a centrally located supersite for all study homes. In addition, sulfur is a major constituent of PM2.5 and its infiltration and deposition rates are similar to those of PM2.5, and it is present mostly in the form of sulfate, which is a stable compound that can be measured readily and accurately. Consequently, Sr has been widely accepted as a means of approximating outdoor PM2.5 Finf and we used the Sr as a surrogate for PM2.5 infiltration.
Projected daily values for temperature, wind speed, relative humidity, and precipitation in Boston were obtained for two 20-year periods: 1981-2000 and 2046-2065. We used an ensemble of 15 Coupled Model Intercomparison Project Phase 5 (CMIP5) models under the representative concentration pathway (RCP) 4.5 scenario ( Taylor et al., 2012 ). We found that there was generally good agreement in temperature between the ensemble mean from the 15 CMIP5 model projections and the North American Regional Reanalysis database for the period of 1981-2000.
The projected daily meteorological values were processed into weekly averages to predict Sr for the past and the future 20-year periods. The relative change in Sr predicted by the models provides a useful indicator of likely changes in indoor air quality under a climate change regime. An alternative approach comparing Sr derived from the 2006-2010 observations to that derived from the 2046-2065 CMIP5 projections would likely be affected by biases in the model meteorology.
First, we employed linear mixed effects models to examine the relationship between Sr and ambient temperature for all homes in the database and a subgroup of naturally ventilated homes using the indoor and outdoor data collected during 2006-2010; and second, we predicted past and future Sr using this relationship in conjunction with projected meteorological data for these periods.
In the period 1981-2000, Sr was the highest in summer, with a value of 0.69 for naturally ventilated homes and 0.60 for all homes. In contrast, the lowest Sr occurred in winter, where it was 0.46 and 0.48 for the naturally ventilated subgroup and all homes, respectively. Using winter as the baseline, the predicted seasonal change in Sr from winter to summer was higher in naturally ventilated homes, where there was a maximum 44% change compared to 30% for all homes. In the period 2046-2065, the ensemble mean monthly temperature is projected to increase by 2.1-2.9 °C, with larger increases in winter. The corresponding increase in Sr was 0.0010-0.047 for naturally ventilated homes and 0.014-0.016 for all homes. This resulted in a maximum increase of approximately 7% in future Sr for naturally ventilated homes and 2% for all homes in the month of July. During this period, the monthly difference in Sr between the two ventilation scenarios ranged from -0.0062 to 0.13, which corresponded to a 21% difference in July. Compared to the past, the future increase in Sr was generally higher for naturally ventilated homes and reached the maximum value in summer, where it was approximately 3.4 times the amount of that for all homes. Using future winter as the baseline, the predicted seasonal difference in Sr increased to as high as 54% for naturally ventilated homes and 30% for all homes.
Our Atlanta data was assembled prospectively. We collected a total of843 24-hr samplesinside 60 houses in Atlanta from Oct. 15th 2015to May 31st 2017, and collected information about house characteristics and household activities. Sampling in each household was scheduled over two sessions, during both cool and warms months, and lasting 7 consecutive days each. Samples were analyzed for sulfur by X-ray fluorescence. The Atlanta data were analyzed following the same approach used for the Boston data.We calculated the corresponding Sr, a measure of particle penetration, for these homes using the outdoor sulfur concentration measured at Atlanta's Jefferson Street monitoring site as the reference. We found that Sr at naturally ventilatedhomes averaged 0.79±0.30, higher than homeswith AC/Heating system usage (0.72±0.44). We observed a clear seasonal trend, where transition season (February to May, and October to November) had higher Sr than summer or winter (Figure 1).
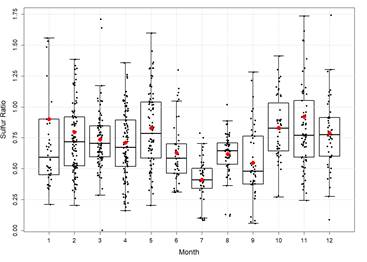
Figure 1. Distribution of sulfur ratio by month in Atlanta
We found that many behavioral factors, including time spent indoors (i.e., how long was the house occupied), open windows (Figure 2), AC/Heating system usage (Figure 2), and cooking, were significantly associated with Sr. Cleaning activities, house age, and house square footage did not significantly predict Sr.
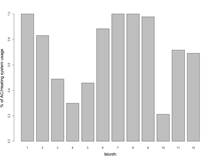
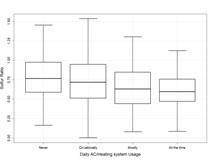
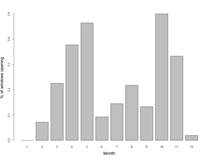
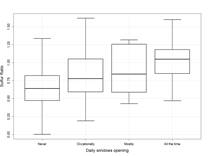
Figure 2.Distribution of sulfur ratio by AC/Heating system usage and windows opening in Atlanta. (Top Left) Percentage of AC/Heating system usage by month. (Top Right) Sulfur ratio by daily AC/Heating system usage. (Bottom Left) Percentage of windows opening by month. (Bottom Right) Sulfur ratio by daily windows opening.
As in Boston, ambient temperature was the only meteorological factor that was statistically significantly associated with Sr, when controlling for random intercepts of each household. In Atlanta, there was a significant association between Sr and linear and quadratic form of outdoor temperature. Sr was positively associated with temperature in lower temperature zone (<18 Celsius), and the Sr-temperature relation became negative with faster decline rate in Sr at higher temperature zone. The trend remained consistent between naturally ventilated homes and houses using AC/Heating system. The same trend held in both full data (N=810) and reduced dataset (n=649) where observations with Sr>1 and households with 60% of observations where Sr>1 were eliminated.
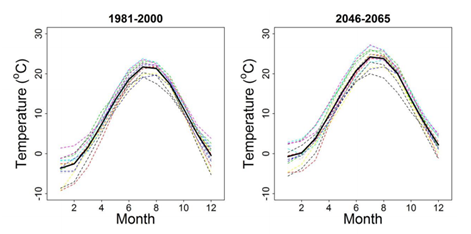
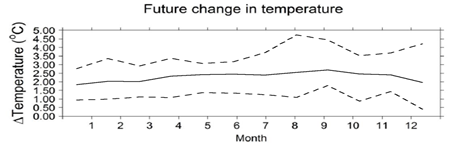
Figure 3. Mean monthly temperature for the past (1981-2000) and the future (2046-2065) time periods projected using 15 CMIP5 models (dashed lines). The solid line is the overall monthly mean across the CMIP5 models. Mean monthly temperature is projected to increase by 1.5-2.5°C in Atlanta, with larger increases in summer.
Since in the reduced dataset all linear and quadratic forms of outdoor temperature were significantly associated with Sr in all three scenarios (naturally vented, AC/Heat system, and all homes), we used the effect coefficients in the reduced dataset to predict the Sr using the modeled past/future temperature (both linear and quadratic forms) for Atlanta. The modeled seasonal trends of Sr in the past/ future were consistent with the current seasonal trend, when transition season had higher Sr and summer had lower infiltration due to the high prevalence of AC usage (Figure 4 and Figure 6). In the future (2045-2065), mean monthly temperature is projected to increase by 1.5-2.5°C in Atlanta compared with the past (1981-2000), with larger increases in summer (Figure 3). Correspondingly, in Atlanta, there will be greater infiltration during transition seasons and winter, and substantially lower infiltration in summer for the naturally ventilated homes, compared with houses using AC/Heating system (Figure 6). Moreover, climate change is projected to enhance seasonal differences in PM2.5 infiltration in Atlanta. Compared with the past, the difference in infiltration between naturally ventilated homes and houses using AC/Heating system is amplified in the future (Figure 5, 7 & 8).
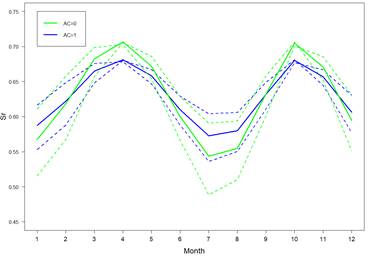
Figure 4.Predicted Atlanta mean monthly Srfor the past (1981-2000) by the two populations. The solid lines are the overall monthly mean across the CMIP5 models while the dashed lines are ± 1 SD from the overall mean. AC=0 represents the subpopulation of naturally ventilated homes and AC=1 refers to the subpopulation of using AC/Heating system.
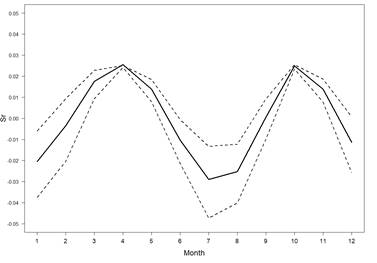
Figure 5.Difference in predicted mean monthly Srbetween the naturally ventilated homes and household with AC/Heating usage for the past (1981-2000) in Atlanta. The solid lines are the overall monthly difference across the CMIP5 models while the dashed lines are ±1 SD from the overall mean.
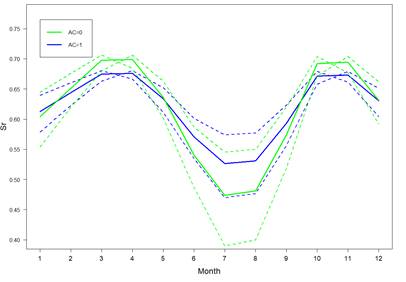
Figure 6.Predicted mean monthly Srfor the future (2046-2065) by the two populations in Atlanta.The solid lines are the overall monthly mean across the CMIP5 models while the dashed lines are ± 1 SD from the overall mean. AC=0 represents the subpopulation of naturally ventilated homes and AC=1 refers to the subpopulation of using AC/Heating system.
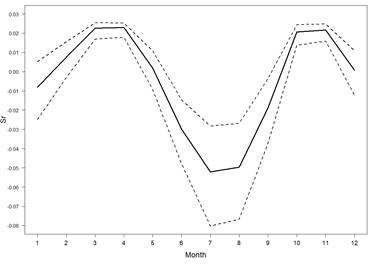
Figure 7.Difference in predicted mean monthly Srbetween the naturally ventilated homes and household with AC/Heating usage for the future (2046-2065) in Atlanta. The solid lines are the overall monthly difference across the CMIP5 models while the dashed lines are ± 1 SD from the overall mean.
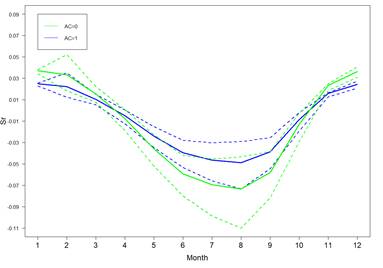
Figure 8.Monthly mean differences between the past (1981-2000) and the future (2046-2065) for predicted Srin Atlanta. The solid lines were the overall monthly difference across the CMIP5 models while the dashed lines were ± 1 SD from the overall mean. AC=0 represents the subpopulation of naturally ventilated homes and AC=1 refers to the subpopulation of using AC/Heating system.
Compared to the same analyses done in Boston, Atlanta exhibits a different effect of climate changes on future Sr (PM infiltration), mainly due to the distinct climate patterns and difference in AC/Heating system prevalence in these two cities.
To examine the projected impact of climate change on mortality due to fine PM exposure indoors, we obtained individual mortality data for the greater Boston area for the years 2000-2009 from the National Center for Health Statistics (NCHS) (2000-2006) and Massachusetts Department of Public Health (2006-2009), respectively (Zanobetti et al., 2014). The selected all-cause non-accidental daily mortality (ICD-9: 0–799) were used as the health outcome in the epidemiologic modeling, which provided sufficiently high number of deaths per day with adequate statistical power. Daily indoor PM2.5 concentrations were estimated using the Sr from the published study (Lee et al., 2017) and the daily outdoor PM2.5 concentrations collected from the Harvard Supersite.
We used a negative binomial model to assess the association between the same day indoor PM2.5 concentration and total mortality, adjusted for long-term trend and ambient temperature through smoothing splines, as well as seasons using indicator variables for the past period (2000-2009). For the future climate change scenario, we used the health model to predict the daily total mortality under the climate of the future 10 years (2056-2065), assuming that ambient PM2.5 levels and toxicity remain the same as in the present period.
A strong, positive relationship was found between indoor PM2.5 concentration and total mortality, whereas a U-shaped relationship was seen for ambient temperature with higher mortality for colder months, followed by high temperature range. Under the future climate, there was an increase in indoor PM2.5 concentrations in warmer seasons, ranging from late spring (May) to mid-autumn (October) (Figure 9). Overall, a similar trend was found for monthly averaged total mortality, with up to 3.6% and 3.7% increase in May and September (Figure 10), respectively. This is possibly due to the increase in Sr as a result of warmer climate. On the contrary, increase in temperature showed an overall protective effect (1.6 - 4.4% decrease) on mortality for colder months (January to April). The effect can be explained by the contribution of milder winter temperature due to climate change, where there was a negligible increase in indoor PM2.5 concentrations for these months.
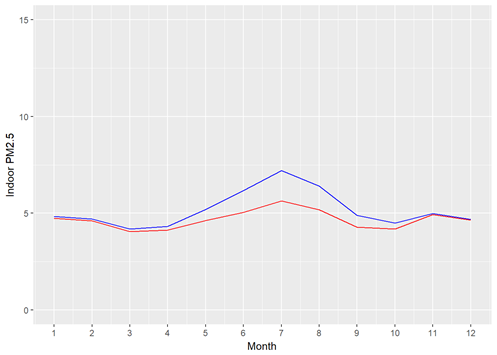
Figure 9.Indoor PM2.5concentrations under past (red, 2000-2009) and future (blue, 2056-2065) climate conditions in Boston, MA
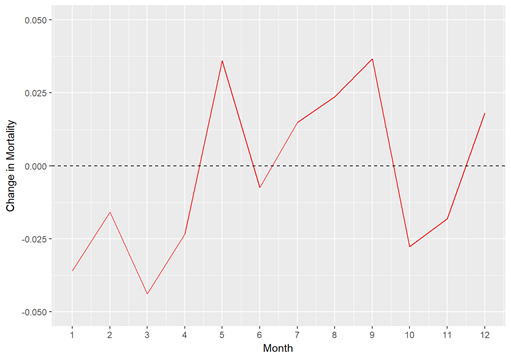
Figure 10.Changes in monthly averaged total mortality due to indoor PM2.5concentrations under future climate (2056-2065) conditions in Boston
In summary, we found opposite effects on mortality by season under the future climate change scenario. There was a general increase in total mortality in future warmer months due to the increase in indoor PM2.5 concentration mediated by higher Sr, whereas a decrease in mortality was seen for colder months because of milder temperature.
References:
Lee WC, Shen L, Catalano PJ, Mickley LJ, and Koutrakis P (2017). Effects of future temperature change on PM2.5 infiltration in the Greater Boston area. Atmospheric Environment 150: 98-105.
Taylor KE, Stouffer RJ, Meehl GA (2012), An overview of CMIP5 and experiment design. Bulletin of the American Meteorological Society 93(4): 485-498.
Zanobetti A, Austin E, Coull BA, Schwartz J, and Koutrakis P (2014). Health effects of multi-pollutant profiles. Environmental International 71:13-19.
Journal Articles on this Report : 1 Displayed | Download in RIS Format
| Other project views: | All 7 publications | 5 publications in selected types | All 5 journal articles |
|---|
| Type | Citation | ||
|---|---|---|---|
|
|
Liang D, Lee W, Liao J, Lawence J, Wolfson J, Ebelt S, Kang C, Koutrakis P, Samat J. Estimating climate change-related impacts on outdoor air pollution infiltration. ENVIRONMENTAL RESEARCH 2021;196(110923). |
R835755 (Final) R834798 (Final) R835872 (2020) R835872C001 (Final) |
Exit Exit |
Supplemental Keywords:
Indoor/Outdoor Particle Ratio, Home Air Exchange RateProgress and Final Reports:
Original AbstractThe perspectives, information and conclusions conveyed in research project abstracts, progress reports, final reports, journal abstracts and journal publications convey the viewpoints of the principal investigator and may not represent the views and policies of ORD and EPA. Conclusions drawn by the principal investigators have not been reviewed by the Agency.