
Grantee Research Project Results
2016 Progress Report: Assessing the Potential Impact of Global Warming on Indoor Air Quality and Human Health in Two US Cities: Boston, MA and Atlanta, GA
EPA Grant Number: R835755Title: Assessing the Potential Impact of Global Warming on Indoor Air Quality and Human Health in Two US Cities: Boston, MA and Atlanta, GA
Investigators: Koutrakis, Petros , Mickley, Loretta J. , Zanobetti, Antonella , Sarnat, Jeremy , Sarnat, Stefanie Ebelt
Institution: Harvard University , Rollins School of Public Health, Emory University
Current Institution: Emory University , Harvard University
EPA Project Officer: Chung, Serena
Project Period: November 1, 2014 through October 31, 2017 (Extended to October 31, 2018)
Project Period Covered by this Report: November 1, 2015 through October 31,2016
Project Amount: $999,948
RFA: Indoor Air and Climate Change (2014) RFA Text | Recipients Lists
Research Category: Air Quality and Air Toxics , Air , Climate Change
Objective:
Rising temperatures associated with climate change are expected to impact future home air exchange rates, decreasing air exchange during the summer and increasing these rates during the spring and fall relative to the present. These changes in turn will alter the contributions of both indoor and outdoor fine particulate matter (PM2.5 ) sources to indoor air quality and subsequently lead to differential effects of PM2.5 exposures on human health. To investigate this, we propose to use the indoor/outdoor sulfur ratio to link concentrations of indoor particles of outdoor and indoor origin to ambient temperature. We will estimate the effects of outdoor PM2.5 on total and cause-specific mortality in each city, and ultimately examine the impact of climate change-related differences in indoor particle exposures on PM2.5-related mortality.
Progress Summary:
Overall, the study is on schedule. The Year 2 progress on each of the specific aims of the study is summarized below.
Specific Aim (SA) 1: Assemble a large database on indoor and outdoor levels of PM2.5 mass and sulfur in two U.S. cities with very different climatic conditions: Boston, Massachusetts, and Atlanta, Georgia.
The Boston data assembly has been completed. Retrospective data from Atlanta are also available.
During Year 2, we have continued with our prospective field sampling campaign in Atlanta. In January 2016, we began sampling in Atlanta. In total, we will collect 840, 24-h integrated samples over a 2-year duration from 60 single-family residences throughout the city. Sampling in each household is scheduled for two sessions, during both cool and warm months, and lasting 7 consecutive days in each session. For each field session, PM2.5 is collected on Teflon filters using a specially designed sampler placed in the main activity room of the home. In addition, questionnaires are administered to participants for information regarding home type, age and size, as well as indoor sources that may impact PM2.5 levels, such as the presence of secondhand smoke, wood stove and candle usage. Questions regarding parameters that influence home air exchange rates are also asked, including the use of air conditioning and the number and time of open windows. To date, we have completed recruitment of 60 homes and completed 75 percent of the total sampling tasks (N = 630 sampling days). Of the first 246 samples analyzed, the average indoor sulfur concentration was 0.30 ± 0.17 µg/m3 for 41 homes in Atlanta from January 1 to June 30, 2016. The corresponding indoor-outdoor sulfur ratio for these homes was calculated to be 0.86 ± 0.55 µg/m3, using the outdoor sulfur concentration measured at Atlanta's Jefferson Street monitoring site as the reference. There was a clear seasonal trend of sulfur ratios during this period, when transition season (February to May) had higher sulfur ratios measured at homes (Figure 1).
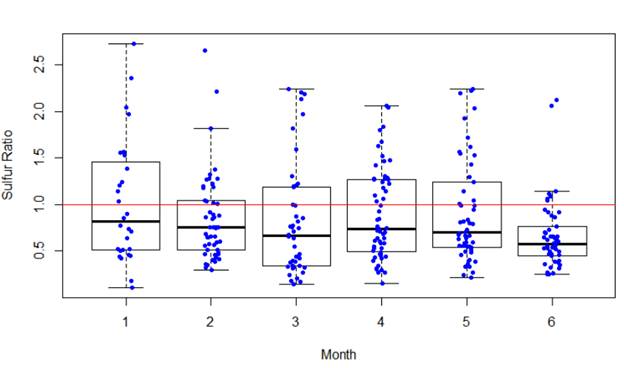
Figure 1. Sulfur ratios measured at 41 homes (246 sampling days) at Atlanta from January 1 to June 30.
Prior to the start of field sampling (October–November 2015), we conducted QA-QC analyses, including side-by-side collocated measurements (four samplers per session) in three households. A total of 42 samples were collected and analyzed. The mean sulfur mass concentration for this period across three households was 0.17 ± 0.11 ug/m3. Despite the low concentrations typical during this season in Atlanta, the colocation pairs were strongly correlated with each, with a relative precision of ± 13.1 percent and an absolute precision of ± 0.02 ug/m3. We also conducted additional side-by-side collocated measurements (eight samplers per session) at the end of 2016. In addition, 10 percent of the total samples were assigned as field blank.
SA 2: Using data collected in SA 1, establish relationships between the impact of outdoor and indoor sources on indoor PM2.5 concentrations, Ro and Ri, respectively, and ambient T. This analysis will be accomplished in two steps: First, we will express Ro, Ri and air exchange rate α as a function of the indoor/outdoor sulfur ratio Sr, and second, we will establish a quantitative relationship between Sr and T.
We have recently published a paper (Lee, et al., 2017) with retrospective data collected in the Boston area and have used the indoor-outdoor sulfur ratio (Sr) as a surrogate of the particle infiltration factor (Finf) for PM2.5. Using linear mixed effects models, we examined the Sr-temperature relationship for both the whole population of homes studied and a subpopulation of naturally ventilated homes.
SA 3: Forecast climatic conditions in Boston and Atlanta for two 20-year periods—1994 to 2014 (present) and 2044 to 2064 (future)—using data from the Coupled Model Intercomparison Project Phase 5 (CMIP5) (Intergovernmental Panel on Climate Change, AR5). We will use present and future temperatures, TP and TF, to predict present and future Sr, α, Ro and Ri values.
Projected meteorology for Atlanta has been modeled for both the 20-year future and 20-year past periods. Projected daily values for six weather variables were obtained for the period between 1981–2065, including temperature (K), wind speed (m/s), relative humidity (%), precipitation (kg/m2/day), pressure at mean sea level (Pa), and specific humidity (kg/kg) in Atlanta were obtained. We used an ensemble of 14 CMIP5 models under the representative concentration pathway (RCP) 4.5 scenario (Taylor, et al., 2012). The RCP 4.5 is an intermediate scenario, in which the radiative forcing reaches 4.5 Wm-2 by 2100 and stabilizes thereafter (Taylor, et al., 2012). These models have a horizontal resolution of ~200 km. The use of this ensemble, as opposed to selecting an individual CMIP5 model, reduces the uncertainty in the projections.
There were originally 15 forecast models that provided temperature data in the companion study for Boston (Lee, et al., 2016); however, one model no longer has historical temperature when we downloaded the data for Atlanta. As a result, that model was removed from the collection.
To compare the CMIP5 historical data to the actual weather records for data quality assurance, we used data from the North American Regional Reanalysis (NARR) database (Mesinger, et al., 2006). This data set assimilates a variety of observations in North America and has a spatial resolution of 32 × 32 km. We matched the locations of the zipcode within Atlanta to the nearest centroid of NARR grid for data extraction. Atlanta overlaps with 36 NARR grids; therefore, we averaged the values of the selected six weather variables over these 36 grids to give the final daily data for 1981–2000 in the NARR data set.
SA 4: Estimate the effects of outdoor PM2.5 on total and cause-specific mortality in each city, and examine the impact of climate change-related differences in particle exposures on PM2.5-related mortality.
Data for Boston cause-specific and total mortality for the past period has been gathered, and the analysis of Boston cause-specific and total mortality data for the 20-year past period is in progress. Daily mortality data were obtained from National Center for Health Statistics for Boston for the years 2006–2010. We are examining nonaccidental deaths due to all causes and specific diseases, derived from the International Statistical Classification of Disease, 10th Revision (ICD-10, World Health Organization 2007) codes as follows: all causes (ICD-10; A00-R99); cardiovascular diseases (ICD-10, I01–I59); respiratory diseases (ICD-10, J00–J99); myocardial infarction (ICD-10, I21-I22), and; stroke (ICD-10, I60-I69). Daily outdoor PM2.5 data for 2006–2010 were acquired from the Boston supersite. We used a Poisson regression model to assess the present period (2006–2010) effects of daily PM2.5 and present sulfur ratios, SrP, on total and cause-specific daily mortality:
Log E(Yt)P = Intercept + ns(time, df) + ns(Tt, df) + ns(Tt-1, df) + ns(Relative Humidityt, df)
+ Day of Week + β1 PM2.5,t + β2 PM2.5,t (SrPt - SrP,mean) + β3 (SrPt - SrP,mean) (1)
where, E(Yt)P is the expected death count on day t during the present period; ns is the natural cubic splines and PM2.5,t indicates the concentration of PM2.5 at day t. Time represents seasonality, which will be modeled with a ns with 5 degrees of freedom (df) per year. We will use 4 df to model the nonlinear relationships between daily mortality and same- (Tt) and previous- (Tt-1) day temperatures and same- day relative humidity. SrPt is the sulfur ratio for day t, SrP,mean represents the average of daily SrPt and SrPt - SrP,mean represents the daily SrPt centered over its mean; β1 is the effect of PM2.5 at the average SrPt, β2 represents how the effect of PM2.5 changes with SrPt, and β3 is the main effect of centered SrPt.
For the future period, we would conceptually replace SrPt with SrFt and use SrP,mean to center SrFt values. We assume that ambient PM2.5 levels and toxicity remain the same as in the present period:
Log E(Yt)F = Intercept + ns(time, df) + ns(Tt, df) + ns(Tt-1, df) + ns(Relative Humidityt, df)
+ Day of Week + β1 PM2.5,t + β2 PM2.5,t (SrFt - SrP,mean) + β3 (SrFt - SrP,mean) (2)
Subsequently, the relative risk of mortality in the future period with respect to the present can be obtained by subtracting equation (2) from (1):
E(Yt)F / E(Yt)P = exp(β2 PM2.5,t (SrFt - SrPt) + β3(SrFt - SrPt)) (3)
Therefore, the impact of climate change on PM2.5-related mortality can be determined using current mortality data and the estimated β2, β3, SrP and SrF values.
Future Activities:
SA 1
During the upcoming project period, we will continue to conduct field sampling in Atlanta and anticipate completion by summer 2017.
SA 2
Data collection in Atlanta is still in progress, so future work on SA 2 will include the analysis of Atlanta data using the techniques developed with Boston data and comparison with Boston results.
SA 3
After prospective sampling is complete (during Y3), we will use these forecasts to predict Sr for these past and future 20-year periods, as we have previously done and reported for Boston. Results of the Boston analysis (SA 2 and SA 3) have recently been published (Lee, et al., 2017). Future work on SA 3 will also include comparison with Boston results.
SA 4
Data gathering for Atlanta cause-specific and total mortality for the 20-year past/current period is in progress and will be completed along with the prospective sampling that is ongoing. Analysis of the Atlanta data, using methods developed with Boston data, will occur when prospective sampling is complete. Future work on SA 4 also will include comparison with Boston results.
Journal Articles on this Report : 1 Displayed | Download in RIS Format
| Other project views: | All 7 publications | 5 publications in selected types | All 5 journal articles |
|---|
| Type | Citation | ||
|---|---|---|---|
|
|
Lee W-C, Shen L, Catalano PJ, Mickley LJ, and Koutrakis P. Effects of Future Temperature Change on PM2.5 Infiltration in the Greater Boston Area. Atmospheric Environment 2017;150:98-105. |
R835755 (2016) R834798 (Final) R835437 (2016) |
Exit Exit Exit |
Supplemental Keywords:
Indoor/outdoor particle ratio, home air exchange rate, indoor air, air quality, Atlanta, Boston, global warmingProgress and Final Reports:
Original AbstractThe perspectives, information and conclusions conveyed in research project abstracts, progress reports, final reports, journal abstracts and journal publications convey the viewpoints of the principal investigator and may not represent the views and policies of ORD and EPA. Conclusions drawn by the principal investigators have not been reviewed by the Agency.