
Grantee Research Project Results
Final Report: Environmental Quality, Health and Learning in Conventional and High Performance School Buildings
EPA Grant Number: R835637Title: Environmental Quality, Health and Learning in Conventional and High Performance School Buildings
Investigators: Batterman, Stuart A. , Somers, Cheryl L , McCaughtry, Nate
Institution: Wayne State University , University of Michigan
EPA Project Officer: Hahn, Intaek
Project Period: November 20, 2014 through November 19, 2018 (Extended to November 19, 2019)
Project Amount: $1,000,000
RFA: Healthy Schools: Environmental Factors, Children’s Health and Performance, and Sustainable Building Practices (2013) RFA Text | Recipients Lists
Research Category: Children's Health , Endocrine Disruptors , Human Health
Objective:
This research has the following goals: (1) increasing our understanding of the relationship between environmental factors and the health and academic performance of students, teachers and staff; (2) evaluating the use and effectiveness of indoor environmental quality (IEQ) measures used in high performance school buildings; and (3) promoting an understanding of the importance of IEQ in schools and IEQ targets for high performance buildings and informing the next generation of standards for the sustainable design of schools.
Summary/Accomplishments (Outputs/Outcomes):
4.1 Teacher perceptions
A survey administered to teachers in the 37 school classrooms included questions regarding their perceptions of IEQ. Based on the 164 respondents, approximately 30% of teachers were dissatisfied with respect to thermal comfort, and over half thought the thermal comfort interfered with learning. 25% of the teachers were dissatisfied with the overall quality of the indoor air, and 15% thought that this interfered with learning. The most commonly reported odors were body odor and stale air. 18% of teachers were dissatisfied with noise levels in their classroom, and about half complained about noise from nearby classrooms and the hallway. In two schools, noises from ventilation systems and/or fans were noted. Regarding lighting in classrooms, 20% of the teachers were dissatisfied, and the same fraction indicated that this interfered with learning. 25% indicated that the electric lighting was too bright, and 14% noted glare from daylight. Regarding the overall IEQ in their classroom, over half of teachers (%) were satisfied, 35% were neutral, and 9% were dissatisfied. Teachers tended to separate issues of thermal comfort with IEQ, e.g., no teachers reported dissatisfaction with IEQ in schools that experienced widespread thermal comfort problems. A considerable fraction (40%) of teachers experienced headache or tiredness and fatigue at school with symptoms usually disappeared overnight. Overall, the survey indicated that many teachers and school staff are aware of the importance of IEQ, and many felt that IEQ, including comfort, odor and pollutant parameters, were important to the them and the educational performance of their students.
4.2 VOC levels in classrooms
Students represent a potentially vulnerable population to even low levels of pollutants, including volatile organic compounds (VOCs), which encompass a very wide range of chemicals, many of which may cause acute or chronic health effects. These chemicals arise from both indoor and outdoor sources, thus, indoor and outdoor VOC concentrations are often correlated and sometimes seasonally vary.9-11 Only a modest number of studies have examined VOCs in schools. We measured 94 VOCs in 144 classrooms in the 37 schools using passive sampling, thermal desorption, gas chromatography and mass spectroscopy.12 Aromatics, alkanes and terpenes were the major compound groups detected. Most VOCs had mean concentrations below 5 µg/m3, and most indoor/outdoor concentration ratios ranged from 1 to 10. VOC levels were correlated to several indoor environmental parameters, including relative humidity, CO2concentration, and air exchange rate. The variation in concentrations within schools tended to exceed the between-school variation for many VOCs, suggesting the diversity of internal emission sources and ventilation conditions among classrooms in the same school. Overall, no major differences in VOC concentrations were found between conventional and high-performance buildings. VOC concentrations were mostly low, and concentrations have declined from levels measured in earlier decades, suggesting the effectiveness of VOC controls on outdoor sources, widespread use of low emission materials and products, and that these factors have offset possible increases in concentrations resulting from low air exchange rates in relatively new and “tight” buildings examined. Still, opportunities remain to improve indoor air quality (IAQ) by limiting emissions from building-related sources and products and by increasing ventilation rates.
4.3 Noise levels
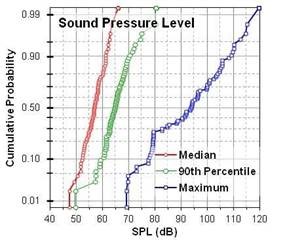
Noise is an important but rarely reported parameter in schools. As noted earlier, 18% of teachers were not satisfied with the noise level in their classroom. Figure 2 shows sound pressure levels (SPLs) measured in classrooms, recorded as 1-s averages during the occupied portion of two school days. Maximum SPL readings, some of which were very high, may indicate impact-type noises (including disturbance of the monitors), and are not very representative. Nose from building operations (e.g., HVAC system and fans) were suggested by measurements during the unoccupied portion of the day.
Fig. 2. Probability plot showing distribution of sound pressure levels across classrooms.
4.4 Ventilation measurements in school classrooms
The ventilation rate (VR) is a key parameter affecting indoor environmental quality (IEQ) and the energy consumption of buildings. We reviewed the use of CO2as a “natural” tracer gas for estimating VRs in school classrooms, specifically critiquing the steady-state, buildup, decay and transient mass balance methods.13 Occupant-generated CO2has been widely used as a tracer gas for estimating the VR. Such methods are especially suitable for high occupancy spaces like schools since indoor levels can far exceed outdoor concentrations, and the steady-state method has been used most commonly. However, we identified a number of issues that limit the accuracy of VR determinations using such methods. These include the non-uniqueness of CO2sources, fluctuations in outdoor CO2levels, variation in CO2generation rates (a result of varying number of occupants), the level of metabolic activity, and post-exercise recovery periods, and sensor performance. The field data and evaluation found very dynamic occupancy patterns in school classrooms, and VRs derived using methods that account for changes in occupancy over the school day were most applicable. The steady-state, build-up and decay methods had significant limitations and biases, showing the need to confirm that these methods are appropriate. If occupancy measurements can be obtained, then the transient mass balance method likely will provide the most consistent and accurate results among the CO2-based methods. Improved VR measurements can benefit many applications, including research examining the linkage between ventilation and health.
4.5 Ventilation rates in schools
We completed an assessment of ventilation rates (VRs) in classrooms in the 37 schools.14 Low VRs have been associated with absenteeism, poorer academic performance, and teacher dissatisfaction. VRs were measured during operating hours in classrooms in the 37 schools, using CO2and the steady-state, build-up, decay and transient mass balance methods. The transient mass balance method better matched conditions (specifically, changes in occupancy) and minimized biases seen in the other methods. During the school day, air change rates (ACRs) averaged 2.0 ± 1.3 h-1, and only 22% of classrooms met recommended minimum ventilation rates. HVAC systems were shut off at the school day close, and ACRs dropped to 0.21 ± 0.19 h-1. VRs did not differ by building type, although cost-cutting and comfort measures resulted in low VRs and potentially impaired IAQ. VRs were lower in schools that used unit ventilators or radiant heating, in smaller schools and larger classrooms. VRs depended on the HVAC type and operation, but not whether the building was designated as a conventional or “high performance.” Lower VRs were found in classrooms using unit ventilators, radiant heating systems, and sometimes energy recovery units, and in smaller buildings and larger classrooms. Air change rates fell to very low levels in the evening and early morning when HVAC systems were shut off. In nearly all classrooms, VRs were below the minimum recommended guidelines. Additional ventilation, better design and operation, and education regarding ventilation is needed. Findings highlight the need to increase VRs and to ensure that energy saving and comfort measures do not compromise ventilation and IEQ.
4.6 Student population and baseline conditions
In Phase 4, we examined three schools in detail and evaluated potential impacts from using additional ventilation and enhanced filtration. Unfortunately, one of the schools discontinued participation midway through the study. While we have baseline and additional data on this school, it was removed from the analysis given the missing data. The two remaining schools, both in the same school district, completed all five waves of the study. Classrooms were divided into two arms in each school for the case-crossover analysis. The total number of children enrolled and studied was 631, with nearly equal males and females, as shown in Table 1.
Table 1. Counts of children enrolled in each arm of the study in schools S1
| School | Male | Female | Total | |||
|---|---|---|---|---|---|---|
| Arm | Count | Percent | Count | Percent | Count | |
| S15 | 188 | 0.476 | 207 | 0.254 | 395 | |
| Arm 1 | 126 | 0.479 | 137 | 0.521 | 263 | |
| Arm 2 | 62 | 0.47 | 70 | 0.53 | 132 | |
| S18 | 122 | 0.517 | 114 | 0.483 | 236 | |
| Arm 1 | 65 | 0.512 | 62 | 0.488 | 127 | |
| Arm 2 | 57 | 0.523 | 52 | 0.477 | 127 | |
| Total | 310 | 0.491 | 321 | 0.509 | 631 | |
A breakdown of children by race/ethnicity is shown in Table 2. These two schools were predominantly Black/African American and Hispanic/Latino. The ethnic distribution showed some variation between schools, with S15 having more Hispanic/Latino children. More importantly, however, for the study, was that each arm of the schools had comparable race/ethnicity breakdown.
Table 2. Student population by race/ethnicity and study arm for school S15 and S18.
| S15 | S18 | All Schools | ||||||||||||
| Arm 1 | Arm 2 | Total | Arm 1 | Arm 2 | Total | |||||||||
| Race/Ethnicity | Count | % | Count | % | Count | % | Count | % | Count | % | Count | % | Count | % |
| American Indian or Alaskan Native | 4 | (1.5) | 0 | (0.0) | 4 | (1.0) | 2 | (1.6) | 2 | (1.8) | 4 | (1.7) | 8 | (1.3) |
| Black or African-American | 89 | (33.8) | 42 | (31.8) | 131 | (32.2) | 55 | (43.3) | 51 | (46.8) | 106 | (44.9) | 237 | (37.6) |
| Asian | 0 | (0.0) | 0 | (0.0) | 0 | (0.0) | 1 | (0.8) | 0 | (0.0) | 1 | (0.4) | 1 | (0.2) |
| Hispanic or Latino | 139 | (52.9) | 68 | (51.5) | 207 | (52.4) | 18 | (14.2) | 12 | (11.0) | 63 | (26.7) | 237 | (37.6) |
| White | 19 | (7.2) | 19 | (14.4) | 38 | (9.6) | 33 | (26.0) | 30 | (27.5) | 31 | (13.1) | 101 | (16.0) |
| Mixed | 11 | (4.2) | 3 | (2.3) | 14 | (3.5) | 17 | (13.4) | 14 | (12.8) | 31 | (13.1) | 45 | (7.1) |
| Native Hawaiian or Other Pacific Islander | 1 | (0.4) | 0 | (0.0) | 1 | (0.3) | 1 | (0.8) | 0 | (0.0) | 1 | (0.4) | 2 | (0.3) |
| Total | 263 | (100) | 132 | (100) | 395 | (100) | 127 | (100) | 109 | (100) | 236 | (100) | 631 | (100) |
4.7 Student outcome measures
Student outcome measures are summarized in Table 3, which shows averages and counts of tests completed. Outcomes investigated for each intervention address student academic performance and student cardio-respiratory endurance/capacity, as noted earlier. These data represented repeated measures of individual-level data collected from children during the several interventions designed to evaluate effects of advanced filtration and higher air change rates. In general, we saw differences between schools, sex, and, occasionally, between the arms in each school. In addition, as expected, we saw increases over time in the math and reading scores; the physical activity measures showed a flat trend. Note that Table 3 reports crude statistics, unadjusted by race/ethnicity, gender or other factors, however, results are similar after adjusting for these factors.
Table 3. Summary of academic and cardio-respiratory endurance capacity tests for students in schools S15 and S18. NOBs is number of observations.
| S12 | S18 | ||||||||||||
| Test | Wave | Arm1 | Arm 2 | Both | Arms | Arm 1 | Arm 2 | Both | Arms | ||||
| Mean | NOBs | Mean | NOBs | Mean | NOBs | Mean | NOBs | Mean | NOBs | Mean | NOBs | ||
| PACER
Reading Comprehension
Math Computation
Math Concepts Applications
Writing Sequence Score | 1 2 3 4 5 Ave 1 2 3 4 5 Ave 1 2 3 4 5 Ave 1 2 3 4 5 Ave 1 2 3 4 5 Ave | 15.83 14.72 15.01 15.27 14.75 15.11 4.18 6.70 7.79 10.51 11.45 8.13 16.43 20.93 21.57 25.60 30.58 23.02 16.43 20.93 21.57 25.60 30.58 23.02 9.38 12.32 13.77 14.43 14.86 12.95 | 218 225 220 210 203 215 169 216 220 221 221 209 221 226 224 227 226 225 221 226 224 227 226 225 209 221 215 223 221 218 | 15.58 16.46 15.45 15.29 15.58 15.67 7.14 14.32 12.03 11.54 13.20 11.64 22.64 29.81 30.47 35.48 39.38 31.56 22.64 29.81 30.47 35.48 39.38 31.56 17.67 22.04 23.05 20.38 18.62 20.35 | 110 114 105 98 102 106 102 113 110 112 115 110 109 114 109 112 115 112 109 114 109 112 115 112 107 112 110 110 113 110 | 15.74 15.30 15.16 15.27 15.02 15.30 5.16 9.25 9.18 10.85 12.03 9.29 18.50 23.89 24.49 28.86 33.53 25.85 18.50 23.89 24.49 28.86 33.53 25.85 12.14 15.57 16.81 16.39 16.12 15.40 | 328 339 325 308 305 321 271 329 330 333 336 320 330 340 333 339 341 337 330 340 333 339 341 337 316 333 325 333 334 328 | 17.35 18.25 17.47 18.98 19.94 18.40 7.78 12.38 10.82 12.45 13.64 11.41 19.65 26.65 29.53 34.08 33.99 28.78 19.65 26.65 29.53 34.08 33.99 28.78 15.55 18.72 20.61 16.54 19.43 18.17 | 102 101 96 97 98 99 94 98 93 96 94 95 102 101 98 96 96 99 102 101 98 96 96 99 98 99 96 94 94 96 | 16.93 16.31 15.96 16.79 17.20 16.64 4.55 9.72 10.16 10.81 12.34 9.52 15.33 23.35 24.06 28.61 32.34 24.74 15.33 23.35 24.06 28.61 32.34 24.74 11.89 14.82 15.38 15.13 15.63 14.57 | 76 83 78 75 83 79 57 82 78 76 83 75 80 83 80 78 83 81 80 83 80 78 83 81 75 81 79 78 81 79 | 17.17 17.38 16.79 18.02 18.69 17.61 6.37 11.19 10.52 11.72 13.04 10.57 17.76 25.17 27.07 31.63 33.23 26.97 17.76 25.17 27.07 31.63 33.23 26.97 13.95 16.96 18.26 15.90 17.69 16.55 | 178 184 174 172 181 178 151 180 171 172 177 170 182 184 178 174 179 179 182 184 178 174 179 179 173 180 175 172 175 175 |
4.8 Application of increased ventilation rates
As noted in prior sections of this report, schools typically do not achieve recommended ventilation rates, and a number of studies have suggested the importance of ventilation rates on memory, academic tests, and attendance.15-25 Many of these studies have limitations, most significantly that they were correlational, used outcome measures that may not be strong predictors of learning, and had few direct measurements of pollutant levels, and CO2 levels were often used as a surrogate for ventilation. In phase 3, we increased ventilation rates, specifically, the rate of outside air, following the scheduled defined earlier for each school building, arm and study wave and conducted repeated measurements of student academic performance and cardio-pulmonary endurance in each study arm. We altered VRs by changing damper positions to maximum outside air for air handling units that had manual controls, and by changing setpoints on the HVAC controls that used computer controls. We evaluated the impact using ACRs measured using the transient mass balance methods as described previously in Sections 4.4 and 4.5 in four classrooms in each school, using repeated measurements over a 1-week period.
In school S15, we were able to increase ACRs by 13%, based on the four classrooms, increasing from 1.94 to 2.19 hr-1; in school S18, the increase was 24%, from 1.69 to 2.10 hr-1. (These ACRs apply for operating hours.) Even these modest increases were not observed in all classrooms, however, possibly due to staff actions, such as opening windows. Several reasons may explain the relatively modest and inconsistent changes in ventilation rates, including effects of window and door opening; outdoor temperature and wind speeds changes; and the limited capacity of the HVAC systems, particularly systems that may already be operating at the maximum.
Our analysis of student outcomes, including absenteeism, academic performance, and cardiopulmonary endurance of students indicating children’s health in the two schools in Phase 3, did not show statistically significant effects associated with the change in VRs. We tested a range of models using different dependent and outcome variables with similarly null results. This likely resulted from the small changes observed, exposure measurement errors (i.e., variation of VRs among classrooms), other sources of variation, uncontrolled covariates and confounders, and possibly an insufficient sample size.
4.9 Application of high-performance filters
Filters in HVAC systems remove particulate matter (PM), an important air pollutant associated with a wide range of health outcomes, especially in vulnerable and susceptible populations like children. This element of the study had the goal of evaluating whether high performance “dropin” filters can improve indoor air quality in schools and other settings. It included both laboratory and field tests at the three schools selected in Phase 3.
Laboratory tests. Laboratory tests of new and used MERV 8 and MERV 13 filters followed ASHRAE 52.2/ISO16890 series, and removal efficiencies PM1,PM2.5 and PM10 were determined following ISO16890. The used MERV 8 filters had similar performance, suggesting that building and environmental differences in the study were not significant influences. For these filters, removal efficiency slightly increased for smaller particles (by 2 to 7%), but slightly decreased (by 7%) for larger (3-10 µm dia) particles, suggesting particle shedding or bouncing. Despite these changes, these filters maintained the removal efficiencies specified for their MERV 8 rating over the study period. The four used MERV 13 filters also showed consistent results, but performance dropped for each size range by 7 to 21%, and these filters dropped to MERV 10 or 11 equivalent. The decrease in the removal efficiency was largest for the smaller particles. These trends reflect the loss of electrostatic charge on the filter fibrous material.26, 27
Field tests. The field tests used a case-crossover approach in which filters in half of the building zones in these two schools were replaced with new MERV 8 filters, and the other half of the zones with MERV 13 filters. After 3 months, the MERV 8 and 13 filter assignments were reversed, and the air quality measurements were repeated. The filter-based PM concentrations, representing total suspended particles (TSP) in the classrooms, averaged 14 ± 8 µg/m3, slightly above outdoor levels (12 ± 5 µg/m3). While no statistically significant changes in PM levels with filter replacements were seen, at school S15, indoor levels of PM0.3-1 and PM1-5 were reduced more (12-20%) from outdoor levels with the MERV 13 filters than with the MERV 8 filters. However, no decrease was apparent at school S18 where PM levels in several classrooms increased with the enhanced filters.
We also examined the optical PM measurements in the classrooms. In general, most PM2.5 is expected to be a result of combustion-related particles, and most of this will arise from outdoor sources. To examine the performance of the filters in removing this fine fraction (outdoor) PM, we normalized indoor measurements to outdoor measurements collected at each school for the same time period and generated a percent removal estimate, which is expected to increase with better filter performance. Across the two schools and considering working hours, removals averaged 79 ± 12% with MERV 8 filters and slightly lower, 75 ± 17%, with the MERV 13 filters. This difference was not statistically significant. Again, differences were seen at the two schools: at school S15, removals changed from 68 ± 9% with the MERV 8 filters to 80 ± 17% with the MERV 13 filters; at school S18, the change went in the opposite direction (as shown with the TSP measurement) from 90 ± 6% with MERV 8 filters to 66 ± 21% with the MERV 13 filters. These inconsistent and unexpected results may have occurred from several factors, including changing occupancy and activities in the classrooms. In addition, the difficulty of replacing filters at school S18, due to many unit ventilators and other air handling units that required partial assembly and that were difficult to reach (positioned above the ceiling) may have led to non-compliance with study protocols and the increase seen in PM with the presumably better performing MERV 13 filters.
Children’s’ health and performance. Our analysis of absenteeism, academic performance, and cardiopulmonary endurance of students indicating children’s health in the two schools in Phase 3 did not show statistically significant effects associated with PM levels measured gravimetrically or optically. We tested a range of models using different dependent and outcome variables with similarly null results. In large part, this resulted from the conflicting results in the two schools, as noted above. Other sources of error, as noted earlier, may include exposure measurement errors (i.e., variation of PM levels among classrooms), other sources of variation, uncontrolled covariates and confounders.
We also modeled the effect of advanced filtration using a health impact evaluation approach.28 This analysis did indicate benefits in terms or reduced symptoms and absenteeism can be achieved when the typical MERV 8 filters are with MERV 13 or better filters. Moreover, this analysis suggests that drop-in filters may be cost-effective if the rating can be maintained. However, to ensure continued high removal efficiency of PM below 2.5 µm dia, it is essential to rely on mechanical filtration mechanisms. This can be accomplished by providing adequate physical space for filters, thus allowing acceptable airflow resistance using filter media comprised of sufficiently fine fibers that can remove small particles without relying on electrostatic mechanisms.
Summary. Overall through the study period the laboratory tests show that the MERV 8 filters maintained their rated performance based on the lab tests. While these filters had little effect on ePM1, ePM2.5 and ePM10 were 21 and 55%, respectively. In contrast, while initially meeting their rating, the efficiency of MERV 13 filters decreased with use: ePM1 decreased from 47% (new filter) to 24% (12 weeks’ use); ePM2.5 from 60 to 41%, and ePM10 from 84 to 72%. The differences in the performance of used filters for ePM2.5 and ePM10 was smaller than expected. Although the higher rated filters appeared to reduce PM levels in one of the two schools, although changes were not statistically significant, and changes were not observed at the second school. These findings highlight the importance of (1) selecting appropriate filters; (2) identifying buildings where filter replacements are feasible and can be verified; (3) monitoring indoor and outdoor PM levels to confirm that PM levels and exposures changed in the expected manner; and (4) designing and using air handlers and other HVAC units that accept deep-bed filters that can utilize mechanical filtration methods.
4.10 Outreach and education
We conducted a number of outreach activities to promote an understanding of the importance of school environmental quality on the health and performance of children in schools. This includes meeting with policy and legislative officials to discuss school IEQ issues in Lansing and Detroit, convening a Michigan group on school filters, and assisting a number of school and community organizations. Recently (early 2019), we helped a Detroit group, Southwest Detroit Environmental Vision (SWDEV),obtain an Erb Foundation grant to deploy advanced filters in schools, and are actively assisting with this work. This grant will assist with obtaining additional support to equip, ideally all of Detroit schools, with better filters. It also includes the use of low-cost monitoring techniques used by students and teachers, both to assess performance and to promote science, technology, engineering and math (STEM) skills. We will use our higher performance equipment to verify the test results, thus complementing information from the low-cost sensors.
Conclusions:
Context and goals. Schools are important environments for children, who typically spend over 1,300 hours in classrooms each year, making schools the second most important microenvironment after the home. Because indoor environmental quality (IEQ) is deficient in many schools, the performance and attendance of students may be adversely affected. This study was designed to examine school environments with the following goals: (1) increasing the understanding of the relationship between environmental factors and the health and academic performance of students, teachers and staff; (2) evaluating the use and effectiveness of IEQ measures used in high performance school buildings; and (3) promoting an understanding of the importance of IEQ in schools and IEQ targets for high performance buildings and informing the next generation of standards for the sustainable design of schools. Additionally, we evaluate the use of CO2 measurements to determine ventilation rates, test the feasibility of using several innovative measures of student academic performance and cardio-pulmonary endurance in school epidemiology studies, and evaluate the use of high performance “drop-in” replacement filters.
Approach. We recruited 37 relatively new or newly renovated schools in the U.S. Midwest, balanced between conventional and “high performance” (LEED-certified) buildings as well as EnergyStar buildings. Multiday measurements of key IEQ parameters were conducted in in 4 classrooms in each school during normal school days, e.g., ventilation rates (VR) and air change rates (ACRs), carbon dioxide (CO2), particulate matter (PM), sound pressure levels, and volatile organic compounds (VOCs), and teacher health and comfort surveys. We then selected a subset of buildings with a student cohort of 631 2nd and 3rd grade students to evaluate two practical and potentially effective strategies to improve health and academic performance, namely, ventilation rate changes and high performance air filtration, using a prospective case-crossover study design. A number of sensitive and innovative outcomes, including IEQ parameters, absenteeism, curriculum-based measures (CBM) of academic performance, and cardio-respiratory measures of physical fitness, were utilized. Lastly, we investigated costs and feasibility issues associated with the interventions; and conduct engagement, education and outreach activities aimed at promoting the importance and understanding of IEQ on student health and performance.
Results. Key results in this report and the papers and proceedings associated with this research are summarized. Broadly, our assessment of schools in our sample suggested a need for school building performance that goes beyond energy efficiency and ‘green’ design: the design of truly high-performance schools should encompass health, academic performance, practicality, operating costs, and the building life-cycle so that schools are healthy, pleasant, environmentally friendly, economically sustainable, and conducive to learning. The awareness of both health and sustainability is needed among a broad range of school stakeholders involved in both school design and operation, e.g., design practitioners, school administrators, facilities personnel, and teachers. We did not see significant differences between conventional and high-performance buildings for most IEQ measures, including PM, VOCs, CO2, VRs, and noise. After reviewing the use of CO2 as a “natural” tracer gas for estimating VRs, and suggesting that the transient mass balance methods was the most flexible and advantageous method, particularly given the low VRs and dynamic occupancy patterns observed in classrooms, we estimated VRs in 144 classrooms in the 37 schools. Most schools and classrooms in our sample did not meet ventilation requirements. During the school day, ACRs averaged 2.0±1.3 h−1, and only 22% of classrooms met recommended minimum ventilation rates. Ventilation rates did not differ by building type, although cost-cutting and comfort measures resulted in low VRs and potentially impaired IAQ. Our analysis of VOCs in these classrooms showed that aromatics, alkanes and terpenes were the major compound groups; most VOCs had concentrations below 5 µg/m3and indoor/outdoor concentration ratios from 1 to 10. While VOC concentrations have declined from levels measured in earlier decades, opportunities remain to improve IEQ by limiting emissions from buildingrelated sources and by increasing ventilation rates. Noise and thermal comfort remain issues in a minority of schools, based on teacher perceptions and measurements. In a subset of schools, we investigated the effects of increasing ventilation rates and enhancing PM filtration on children’s’ health and learning using repeated measures and the case-crossover study design, which including five waves of tests administered to the 631 2ndand 3rdgrade children in the study. We were able to increase VRs by an estimated 13 to 24%, however, results were inconsistent across classrooms and no statistically significant association was found with student outcomes. We upgraded filters from MERV 8 to MERV 13 in a second set of tests, which also showed inconsistent results for PM levels across the classrooms and schools, and again, no meaningful association with student outcomes was indicated. Follow-up laboratory tests of new and used MERV 8 and MERV 13 filters in the study, following the ASHRAE 52.2/ISO16890 series, and tests of removal efficiencies ePM1, ePM2.5 and ePM10 following ISO16890 series, showed that the MERV 13 filters did not maintain their rating in use and dropped to a MERV 10 or 11 equivalent, a result of the loss of electrostatic charge on the filter fibrous material with used. Finally, we partnered with community groups in Detroit and elsewhere to discuss the importance of IEQ in schools, and our outreach and education promoted an understanding of this topic and follow-up work by school, policy and community organizations. Details on these and many other findings from the study are elaborated in the 16 papers and presentations that have resulted from this research.
References:
1. Wargocki, P.; Wyon, D. P., The Effects of Moderately Raised Classroom Temperatures and Classroom Ventilation Rate on the Performance of Schoolwork by Children (RP1257).HVAC&R Research2007,13, (2), 193-220.
2. U.S. Green Building Council Projects.
3. Leger, L. A.; Mercier, D.; Gadoury, C.; Lambert, J., The multistage 20 metre shuttle run test for aerobic fitness.JOURNAL OF SPORTS SCIENCES1988,6, (2), 93.
4. Mahar, M. T.; Guerieri, A. M.; Hanna, M. S.; Kemble, C. D., Estimation of aerobic fitness from 20-m multistage shuttle run test performance.American journal of preventive medicine2011,41, (4 Suppl 2), S117.
5. Vincent, S. D.; Barker, R.; Clarke, M.; Harrison, J., A comparison of peak heart rates elicited by the 1-mile run/walk and the progressive aerobic cardiovascular endurance run.Research quarterly for exercise and sport1999,70, (1), 75.
6. Barnett, A.; Chan, L. Y. S.; Bruce, I. C., A preliminary study of the 20-m multistage shuttle run as a predictor of a peak VO2 in Hong Kong Chinese students. .Pediatric and Exercise Science1993,5, 42-50.
7. Mahar, M. T.; Rowe, D. A.; Parker, C. R.; Mahar, F. J.; Dawson, D. M.; Holt, J. E.,
Criterion-referenced and norm-referenced agreement between the mile run/walk and PACER.Measurement in Physical Education and Exercise Science1997,1, (4), 245-258.
8. Mahar, M. T.; Welk, G. J.; Rowe, D. A.; Crotts, D. J.; McIver, K. L., Development and validation of a regression model to estimate VO2peak from PACER 20-m shuttle run performance.Journal of Physical Activity & Health2006,3, (S2), S34-46.
9. Pekey, H.; Arslanbaş, D., The Relationship Between Indoor, Outdoor and Personal VOC Concentrations in Homes, Offices and Schools in the Metropolitan Region of Kocaeli, Turkey.Water, Air, and Soil Pollution2008,191, (1-4), 113-129.
10. Geiss, O.; Giannopoulos, G.; Tirendi, S.; Barrero-Moreno, J.; Larsen, B. R.; Kotzias, D., The AIRMEX study - VOC measurements in public buildings and schools/kindergartens in eleven European cities: Statistical analysis of the data.Atmospheric Environment2011,45, (22), 3676-3684.
11. Pegas, P. N.; Alves, C. A.; Evtyugina, M. G.; Nunes, T.; Cerqueira, M.; Franchi, M.; Pio, C. A.; Almeida, S. M.; Verde, S. C.; Freitas, M. C., Seasonal evaluation of outdoor/indoor air quality in primary schools in Lisbon.Journal of environmental monitoring : JEM2011,13, (3), 657-67.
12. Zhong, L.; Su, F. C.; Batterman, S., Volatile Organic Compounds (VOCs) in Conventional and High Performance School Buildings in the U.S.International journal of environmental research and public health2017,14, (1).
13. Batterman, S., Review and Extension of CO(2)-Based Methods to Determine Ventilation Rates with Application to School Classrooms.International journal of environmental research and public health2017,14, (2).
14. Batterman, S.; Su, F. C.; Wald, A.; Watkins, F.; Godwin, C.; Thun, G., Ventilation rates in recently constructed U.S. school classrooms.Indoor air2017,27, (5), 880-890.
15. Bakó-Biró, Z.; Kochhar, N.; Clements-Croome, D. J.; Awbi, H.; Williams, M. InVentilation rates in schools and learning performance, Clima 2007 Well Being Indoors, Helsinki, Finland, 2007; Helsinki, Finland, 2007.
16. Myhrvold, A.; Olsen, E.; Lauridsen, O., Indoor Environment in Schools –Pupils Health and Performance in Regard to CO2 Concentrations.Proceedings of the 7th International Conference on Indoor Air Quality and Climate1996.
17. Shaughnessy, R. J.; Haverinen-Shaughnessy, U.; Nevalainen, A.; Moschandreas, D., A preliminary study on the association between ventilation rates in classrooms and student performance.Indoor Air2006,16, (6), 465-468.
18. Shendell, D. G.; Prill, R.; Fisk, W. J.; Apte, M. G.; Blake, D.; Faulkner, D., Associations between classroom CO2 concentrations and student attendance in Washington and Idaho.Indoor Air2004,14, (5), 333-341.
19. Wargocki, P.; Wyon, D.; Jark, L.; Schaub Hansen, M., The effects of outdoor air supply rates in classrooms on the performance of schoolwork by children.Proceedings of CLlMA 2005, Lausanne, Switzerland2005.
20. Wargocki, P.; Wyon, D. P., The Effects of Outdoor Air Supply Rate and Supply Air Filter Condition in Classrooms on the Performance of Schoolwork by Children (RP-1257).HVAC&R Research2007,13, (2), 165-191.
21. Haverinen-Shaughnessy, U.; Moschandreas, D. J.; Shaughnessy, R. J., Association between substandard classroom ventilation rates and students’ academic achievement.Indoor Air2011,21, (2), 121-131.
22. Mendell, M. J.; Eliseeva, E. A.; Davies, M. M.; Spears, M.; Lobscheid, A.; Fisk, W. J.; Apte, M. G., Association of classroom ventilation with reduced illness absence: a prospective study in California elementary schools.Indoor Air2013.
23. Bretveld, R. W.; Doorn, W. J. v.; Evertz, S. J. C. J.; Zijden, A. v. d.; Geelen, L. M. J.; Ragas, A. M. J.; Jans, H. W. A.; Huijbregts, M. A. J., Comparing the effectiveness of interventions to improve ventilation behavior in primary schools.Indoor Air2008,18, (5), 416.
24. Mendell, M. J.; Heath, G. A., Do indoor pollutants and thermal conditions in schools influence student performance? A critical review of the literature.Indoor Air2005,15, (1), 27.
25. US National Research Council,Green Schools. Committee to Review Assess the, Health Productivity Benefits of Green Schools, National Academies Press: 2005.
26. Lehtimäki, M.; Heinonen, K., Reliability of electret filters.Building and Environment1994,29, (3), 353-355.
27. Raynor, P. C.; Chae, S. J., The Long-Term Performance of Electrically Charged Filters in a Ventilation System.J OCCUP ENVIRON HYG2004,1, (7), 463-471.
28. Martenies, S. E.; Batterman, S. A., Effectiveness of Using Enhanced Filters in Schools and
Homes to Reduce Indoor Exposures to PM2.5 from Outdoor Sources and Subsequent Health Benefits for Children with Asthma.Environmental science & technology2018,52, (18), 10767-10776.
Journal Articles on this Report : 2 Displayed | Download in RIS Format
| Other project views: | All 7 publications | 4 publications in selected types | All 4 journal articles |
|---|
| Type | Citation | ||
|---|---|---|---|
|
|
Batterman S, Su F-C, Wald A, Watkins F, Godwin C, Thun G. Ventilation rates in recently constructed U.S. school classrooms. Indoor Air 2017;27(5):880-890. |
R835637 (2015) R835637 (2016) R835637 (2017) R835637 (Final) |
Exit |
|
|
Martenies SE, Batterman SA. Effectiveness of using enhanced filters in schools and homes to reduce indoor exposures to PM2.5 from outdoor sources and subsequent health benefits for children with asthma. Environmental Science & Technology 2018;52(18):10767-10776. |
R835637 (Final) |
Exit Exit |
Progress and Final Reports:
Original AbstractThe perspectives, information and conclusions conveyed in research project abstracts, progress reports, final reports, journal abstracts and journal publications convey the viewpoints of the principal investigator and may not represent the views and policies of ORD and EPA. Conclusions drawn by the principal investigators have not been reviewed by the Agency.