
Grantee Research Project Results
Final Report: Optimal Energy Portfolios to Sustain Economic Advantage, Achieve GHG Targets, and Minimize PM2.5.
EPA Grant Number: R835879Title: Optimal Energy Portfolios to Sustain Economic Advantage, Achieve GHG Targets, and Minimize PM2.5.
Investigators: Kleeman, Michael J. , Chen, Shu-Hua , Yeh, Sonia , Ogden, Joan , Muller, Nicholas
Institution: University of California - Davis , Carnegie Mellon University
EPA Project Officer: Keating, Terry
Project Period: April 1, 2016 through March 31, 2019 (Extended to March 31, 2021)
Project Amount: $790,000
RFA: Particulate Matter and Related Pollutants in a Changing World (2014) RFA Text | Recipients Lists
Research Category: Air , Climate Change
Objective:
The overall objective of this proposal is to identify the dominant sources and chemical composition of PM2.5 in the year 2050 in California under different economically optimized energy portfolios as a test case to inform the national perspective on sustainable air quality. Sustainable air quality in this context is defined as healthy air quality for all socio-economic classes at the lowest possible economic cost.
The specific project objectives are to:
1. Analyze air quality outcomes associated with an ensemble of optimized energy portfolios for climate change in sufficient detail to allow air quality health costs to be calculated for a range of socio-economic classes (4km, 1km, 250m resolution). Generate the ensemble using combinations of different climate models, air quality models, and energy portfolios.
2. Identify a subset of energy portfolios that have the lowest total costs (including health costs associated with air pollution) and that provide equal benefit to all socio-economic classes.
3. Determine the residual PM2.5 air quality issues for the subset of “best” sustainable portfolios to identify where further technology-based mitigation strategies will be needed.
4. Create public tools for climate-energy portfolio-emissions-population exposure-health effects-sustainability analysis to enable consideration of future scenarios at lower startup costs.
Conclusions:
Equivalence between Air Quality Models:
Simulations conducted for present-day air pollution episodes in California demonstrate that three modern air quality models (CMAQ, WRF/Chem, and UCD/CIT) yield very similar results. Each model has strengths and weaknesses related to (i) the incorporation of the latest theories into the available chemical reaction mechanisms, (ii) the maximum spatial resolution that can be realistically achieved, (iii) the details of the particle size distributions that are tracked, (iv) the feedbacks between air pollution and meteorology, and (v) the computational burden of the calculations. All three models were used for different portions of the current project. The overall conclusions of the project were not sensitive to the choice of Chemical Transport Model (CTM).
Criteria Pollutant Emissions Development for Low Carbon Energy Scenarios:
California’s goal to reduce greenhouse gas (GHG) emissions 80% below 1990 levels by the year 2050 will require adoption of low carbon energy sources across all economic sectors. In addition to reducing GHG emissions, shifting to fuels with lower carbon intensity will change the emissions of conventional criteria air pollutants, including airborne particles with diameter less than 2.5 µm (PM2.5) and precursors to ozone (O3) formation. The California REgional Multisector AiR QUality Emissions (CA-REMARQUE) model was developed to predict changes to criteria pollutant emissions inventories in California in response to sophisticated emissions control programs implemented to achieve deep GHG emissions reductions. Two initial scenarios for the year 2050 were used as the starting point for calculations: a Business as Usual (BAU) scenario and an 80% GHG reduction (GHG-Step) scenario. Both the BAU and GHG-Step state-wide emission scenarios were constructed using the energy-economic optimization model, CA-TIMES, that calculates the multi-sector energy portfolio that meets projected energy supply and demand at the lowest cost, while also satisfying scenario-specific GHG emissions constraints. Corresponding criteria pollutant emissions for each scenario were then spatially allocated at 4 km resolution to support air quality analysis across California.
CA-REMARQUE uses algorithms that account for local information about activity levels and technology mixes to estimate emissions of criteria pollutants (or their precursors) that are consistent with the future GHG scenarios. The following economic sectors were separately treated using these tailored algorithms: (i) on-road, (ii) rail and off-road, (iii) marine and aviation, (iv) residential and commercial, (v) electricity generation, and (vi) biorefineries. CA-REMARQUE accounts for the adoption of new technologies in each sector, including electrification, bio-fuels, and hydrogen. Critically, criteria pollutant emissions did not decrease uniformly across all sectors of the economy. Emissions of certain criteria pollutants (or their precursors) increased in some sectors as part of the overall optimization within each of the scenarios. This produced non-uniform changes to criteria pollutant emissions in close proximity to heavily populated regions, which has implications for exposure to air pollution for those populations. As a further complication, changing fuels and technology also modified the composition of reactive organic gas emissions and the size and composition of particulate matter emissions. This is most apparent through a comparison of emissions reductions for different size fractions of primary particulate matter. Primary PM2.5 emissions decrease by 3.6% in the GHG-Step scenario versus the BAU scenario while corresponding primary PM0.1 emissions decrease by a factor of 36%. Ultrafine particles (PM0.1) are an emerging pollutant of concern expected to impact public health in future scenarios.
Low carbon energy sources typically emit very low levels of criteria pollutant emissions. Developing countries that adopt low carbon energy can decrease their criteria pollutant emissions by an order of magnitude or larger. This large reduction in baseline emissions is more important that the exact details of the updated emissions locations and chemical composition in developing countries. In contrast, fully developed countries with lower baseline levels will decrease their criteria pollutant emissions by a smaller (but still significant) amount through the adoption of low carbon energy. The smaller relative reduction makes the details of emissions locations and chemical composition more important. The complexity of the changes to criteria pollutant emissions in California due to the adoption of low-carbon energy emphasizes the need to use local information algorithms in other fully developed countries and states with strict existing environmental regulations. Simple scaling of criteria pollutant emissions in proportion to GHG reductions will be less accurate in these developed regions.
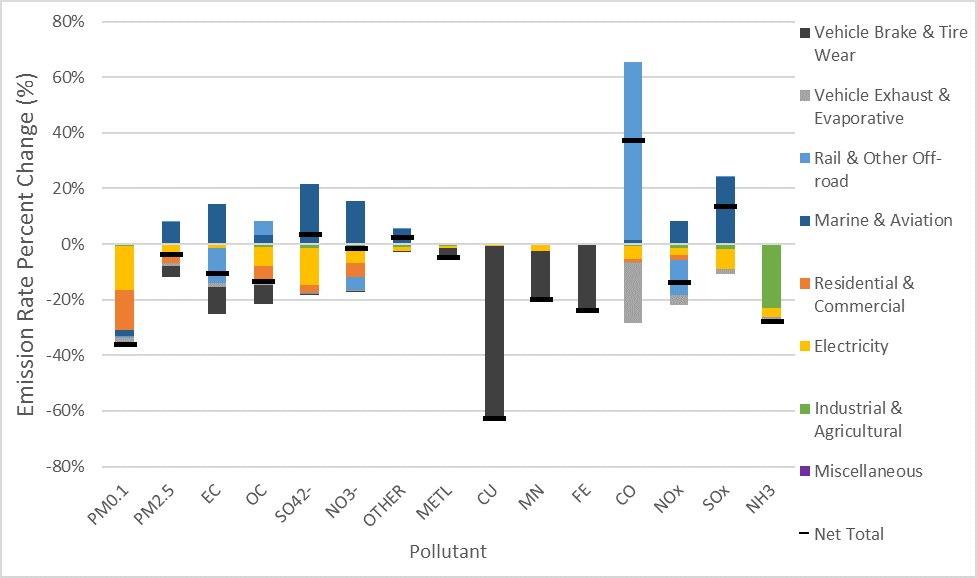
Figure 1: Change in criteria pollutant emissions due to the adoption of low-carbon energy relative to the BAU scenario. Dark line represents the net effect of increasing / decreasing emissions in different sectors.
Reference: 2018 C.B. Zapata, C. Yang, S. Yeh, J. Ogden, M.J. Kleeman. Estimating criteria pollutants using the California Regional Multisector Air Quality Emissions (CA-REMARQUE) model. Geoscientific Model Development, 11, 1293-1320.
Air Quality Health Impacts of Low Carbon Energy Scenarios:
Transformations to air quality and public health in California during the year 2054 were evaluated for a shift between a business-as-usual (BAU) energy scenario and a low-carbon energy scenario (GHG-Step) that includes new technologies, expanded electrification, and modified activity patterns. Meteorological inputs for the year 2054 were generated under a Representative Concentration Pathway (RCP) 8.5 future climate. Annual-average PM2.5 and O3 concentrations were predicted using the modified emissions and meteorology inputs with the UCD/CIT regional CTM. In the final phase of the analysis, mortality (total deaths) and mortality rate (deaths per 100,000) were calculated using established exposure-response relationships from air pollution epidemiology combined with simulated annual-average PM2.5 and O3 exposure.
Net emissions reductions in the GHG-Step scenario (across all sectors) are -36% for PM0.1 mass, -3.6% for PM2.5 mass, -10.6% for PM2.5 EC, -13.3% for PM2.5 OC, -13.7% for NOx, and -27.5% for NH3. Predicted deaths associated with air pollution in 2050 dropped by 24%–26% in California (1,537–2,758 avoided deaths yr-1) in the “climate-friendly” 2050 GHG-Step scenario, which is equivalent to a 54%–56% reduction in the air pollution mortality rate (deaths per 100,000) relative to 2010 levels. These avoided deaths have an estimated value of $11.4B–$20.4B USD per yr-1 based on the present-day Value of a Statistical Life (VSL) equal to $7.6M.
The costs for reducing California GHG emissions 80% below 1990 levels by the year 2050 depend strongly on numerous external factors such as the global price of oil. Best estimates suggest that meeting an intermediate target (40% reduction in GHG emissions by the year 2030) using a non-optimized scenario would reduce personal income by $4.95B yr-1 (-0.15%) and lower overall state GDP by $16.1B yr-1 (-0.45%). The public health benefits described here are comparable to these cost estimates, making a compelling argument for the adoption of low carbon energy in California, with implications for other regions in the United States and across the world.
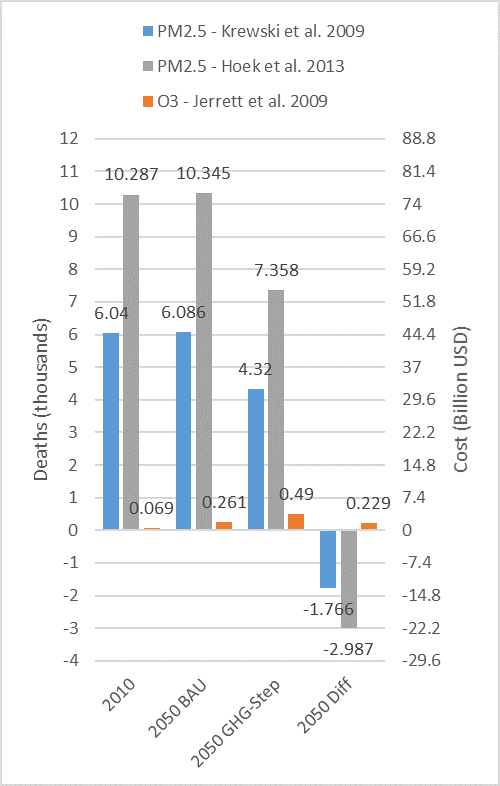
Figure 2: Estimated air pollution mortality in California in the year 2010 and the year 2050. The GHG-Step scenario reduces GHG emissions by 80% relative to 1990 levels. Blue and grey bars represent different estimates of PM2.5 air pollution mortality based on separate epidemiological studies. Orange bars represent estimates of O3 air pollution mortality (separate from the effects of PM2.5).
Reference: 2018 C.B. Zapata, C. Yang, S. Yeh, J. Ogden, M.J. Kleeman. Low Carbon Energy Generates Health Savings in California. Atmospheric Chemistry and Physics, 18, 4817-4830.
Climate Forcing Associated with Changes to Criteria Pollutants under Low-Carbon Emissions
California’s plan to reduce emissions of long-lived greenhouse gases (GHGs) through adoption of new energy systems will also lower concentrations of short-lived absorbing soot contained in airborne particulate matter (PM). The direct and indirect effects of reduced PM concentrations under a low-carbon energy (GHG-Step) scenario on radiative forcing were calculated for the year 2054. Simulations were carried out using the source-oriented WRF/Chem (SOWC) model with 12 km spatial resolution. The avoided aerosol emissions due to technology advances in the GHG-Step scenario reduced ground level PM concentrations by ~8.85% over land compared to the Business as Usual (BAU) scenario, but changes to meteorological parameters were more modest. Top of atmospheric forcing predicted by the SOWC model increased by 0.15 W m-2, surface temperature warmed by 0.001 K, and planetary boundary layer height (PBLH) increased by 2.20 cm in the GHG-Step scenario compared to the BAU scenario.
PM climate feedbacks in the GHG-Step scenario are small because the significant changes in ground level PM concentrations associated with the adoption of low-carbon energy are limited to the first few hundred meters of the atmosphere, with little change for the majority of the vertical column above that level. As an order-of-magnitude comparison, the long-term effects of global reductions in GHG emissions (RCP8.5 – RCP4.5) lowered average surface temperature over the California study domain by approximately 0.76 K, which is almost three orders of magnitude larger than the direct and indirect effects of PM changes. The effects of long-lived climate pollutants such as CO2 are much stronger than the effects of short-lived climate pollutants such as PM soot over California in the year 2054.
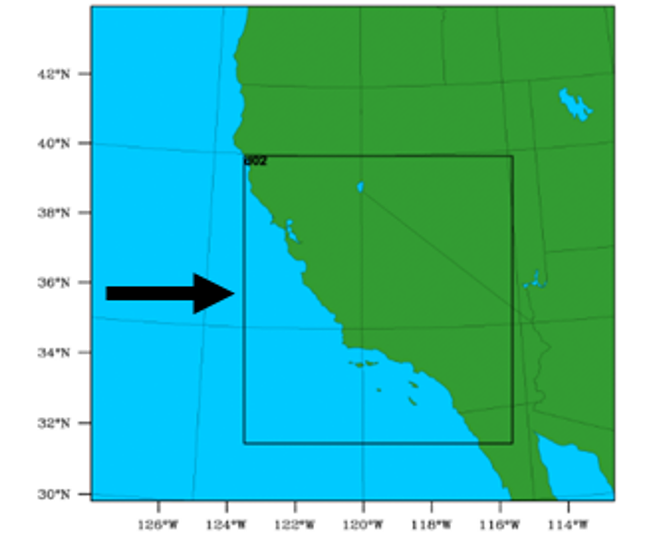
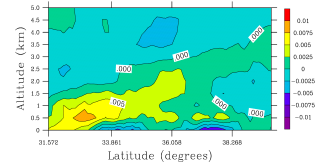
Figure 3. Study domain (left panel) and temperature change (right panel) due to the radiative feedback effects of altered particle concentrations due to the adoption of low-carbon energy in California. Black arrow in left panel shows viewing perspective used in right panel.
Reference: 2020 A. Kumar, C. Zapata, S. Yeh, C. Yang, J. Ogden, H. Lee, S. Chen, and M.J. Kleeman. Effects of low-carbon energy adoption on airborne particulate matter concentrations with feedbacks to future climate over California. Journal of Geophysical Research 125(16) Article No. e2020JD032636.
Development of Additional Low-Carbon Energy Scenarios
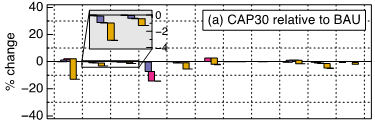
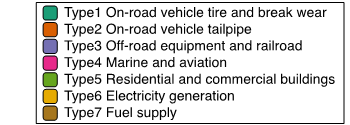
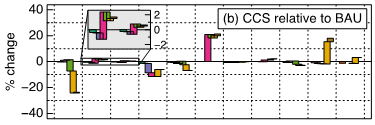
The CA-REMARQUE model developed using the BAU and GHG-Step scenarios above was used to produce four additional energy scenarios: (i) 2030CAP - a loose GHG reduction scenario that meets current policy references but only achieves a 40% GHG reduction (relative to 1990 levels) by the year 2030; (ii) CCS – a scenario that allows for more combustion to generate electricity by focusing on adoption of carbon capture and sequestration technology; (iii) NGT - a variation of the GHG-Step scenario that allows for more natural gas combustion for electricity generation; and (iv) (NGB) - a variation of the GHG-Step scenario that allows for more natural gas combustion for residential and commercial buildings. The 2030CAP, CCS, and GHG-Step scenarios use the BAU scenario as a reference point to evaluate changes to criteria pollutant emissions. The NGB and NGT scenarios use the GHG-Step scenario as a reference point to evaluate changes to criteria pollutant emissions. All of the additional energy scenarios have higher emissions of criteria pollutants compared to the GHG-Step scenario. Changes to emissions of PM2.5 mass and gas-phase precursors are generally smaller than changes to ultrafine particle mass.
 |  |
 |  |
| | |
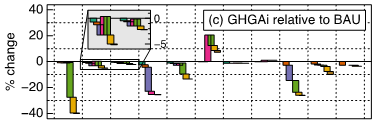

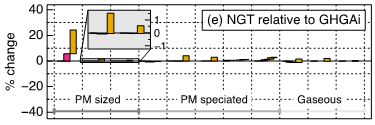
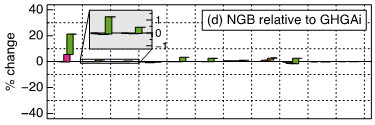
Figure 4. Pollutant emission change (%) in different scenarios relative to their reference scenario. Stacked colored bars represent contributions from different economic sectors
Framework for Environmental Justice Analysis Using Present-Day Conditions
An Environmental Justice (EJ) analysis was carried out over Los Angeles, California, to determine the optimal combination of domain size and spatial resolution to quantify air pollution disparities with CTMs at minimum computational cost and GHG emissions. Air pollution was simulated using the Weather Research and Forecasting (WRF) model coupled with Chemistry (WRF/Chem) with spatial resolution ranging from 250 m to 36 km, comparable to census tract sizes, over domains ranging in size from 320 km2 to 10,000 km2. Emissions at the finest spatial resolutions (1 km and 250 m) were created using improved spatial surrogates that more accurately represent emissions locations. Agreement between PM2.5 measurements and model predictions improved ~9% as spatial resolution increased from 4 km to 250 m, while the computational burden of the calculations increased by a factor of 256. This super-linear increase in computational burden necessitated a reduction in domain size as the spatial resolution increased, with implications for EJ calculations discussed below.
Long-term (~10 yr) average air pollution exposure disparity between different socio-economic groups varied from 1.7-5.2 μg/m3 in PM2.5 mass and 1.2-4.2 μg/m3 in primary aerosol depending on the model domain configuration. Increasing the spatial resolution finer than approximately 1 km produced diminishing returns because of the need to reduce domain size at higher resolutions. Even for regions where socio-economic information was available with 100 m spatial resolution, the benefits of resolving fine-scale spatial features were outweighed by the loss of contrast over larger distances caused by reduced domain size. Conversely, decreasing spatial resolution coarser than approximately 4 km generated larger fluctuations across the exposure distribution, which adversely influenced the accuracy of the calculated average exposure. WRF/Chem configurations that use spatial resolution/domain size of 1 km / 103 km2 and 4 km / 104 km2 over Los Angeles can detect a 0.5 µg m-3 exposure difference with statistical power greater than 90%. These configurations represent the best balance between accuracy, sensitivity across socio-economic groups, and computational burden when predicting current and future air pollution exposure disparities using CTMs over Southern California.
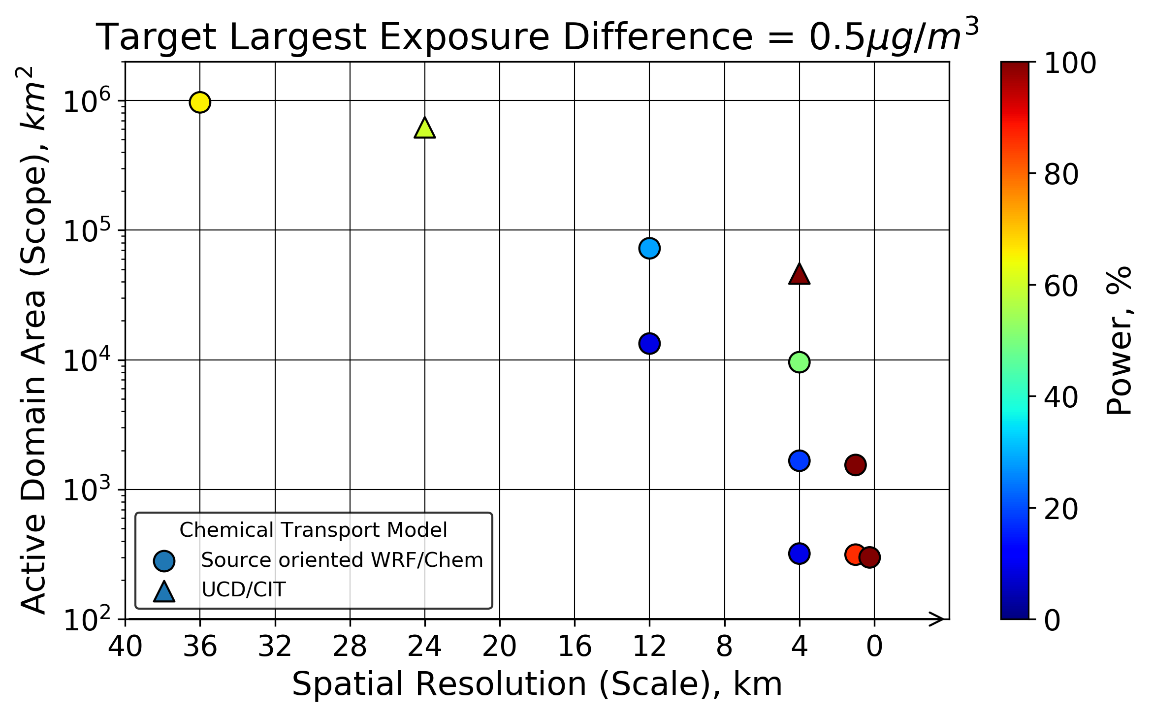
Figure 5: Statistical power for Environmental Justice (EJ) calculations for PM2.5 mass exposure over Los Angeles as a function of domain area and domain spatial resolution.
Adoption of Low-Carbon Energy Reduces Air Pollution Racial Exposure Disparities in California
An environmental justice (EJ) analysis shows that all GHG emissions reduction scenarios improve public health for all races in California. The six different energy scenarios described in the previous sections were analyzed using 4km spatial resolution over four major geographic areas in California: the greater San Francisco Bay Area including Sacramento (SFBA&SAC), the San Joaquin Valley (SJV), Los Angeles (LA), and San Diego (SD). The Weather Research & Forecasting (WRF) model was used to predict future meteorology fields by downscaling two different climate scenario (RCP4.5 and RCP8.5) generated by two different GCMs (the Community Climate System Model and the Canadian Earth Systems Model). Simulations were performed over 32 weeks randomly selected during the 10 year window from the year 2046 to 2055 to build up a long-term average in the presence of ENSO variability. The trends associated with low-carbon energy adoption were relatively stable across different locations and meteorological conditions. Final health benefits associated with PM2.5 reductions were calculated using the BenMap-CE v1.4.8 model developed by US EPA.
Average health benefits associated with low-carbon energy adoption are similar for Asian and Black residents, slightly lower for Hispanic residents, and slightly higher for White residents (see left panel Figure 6). These patterns reflect the spatial distribution of the population comprising each race/ethnicity group relative to the average air pollution exposure fields. Total health benefits for each race/ethnicity category expressed as avoided mortality and public health savings (billions of USD) are calculated by multiplying average health benefits by total population (see right panel of Figure 6). Energy scenarios with deeper cuts to GHG emissions produce greater public health benefits for all race/ethnicity categories.
Figure 6: Avoided mortality and public health benefits associated with low-carbon energy scenarios (relative to the BAU scenario ) in Northern California (SFBA&SAC, SJV) and Southern California (LA, SD). Public health benefits calculated based on the present-day Value of a Statistical Life (VSL) equal to $7.6M.
Maximum exposure disparity between race/ethnicity groups can be calculated as the difference between average concentrations experienced by the highest exposure group and the lowest exposure group. Adoption of low-carbon energy sources in the year 2050 reduces the air pollution exposure disparity between race/ethnicity groups in California by as much as 20% for PM2.5 mass and by as much as 40% for PM0.1 mass (see Figure 7). Deeper reductions in the carbon intensity of energy sources progressively reduced exposure to PM2.5 mass and PM0.1 mass for all California residents. The greater adoption of low-carbon fuels also reduced the PM exposure disparity between race/ethnicity groups. The three energy scenarios that achieved an ~80% reduction in GHG emissions relative to 1990 levels (GHG-Step, NGB, NGT) simultaneously produced the greatest reduction in PM exposure for all California residents and the greatest reduction in the disparity of that exposure.
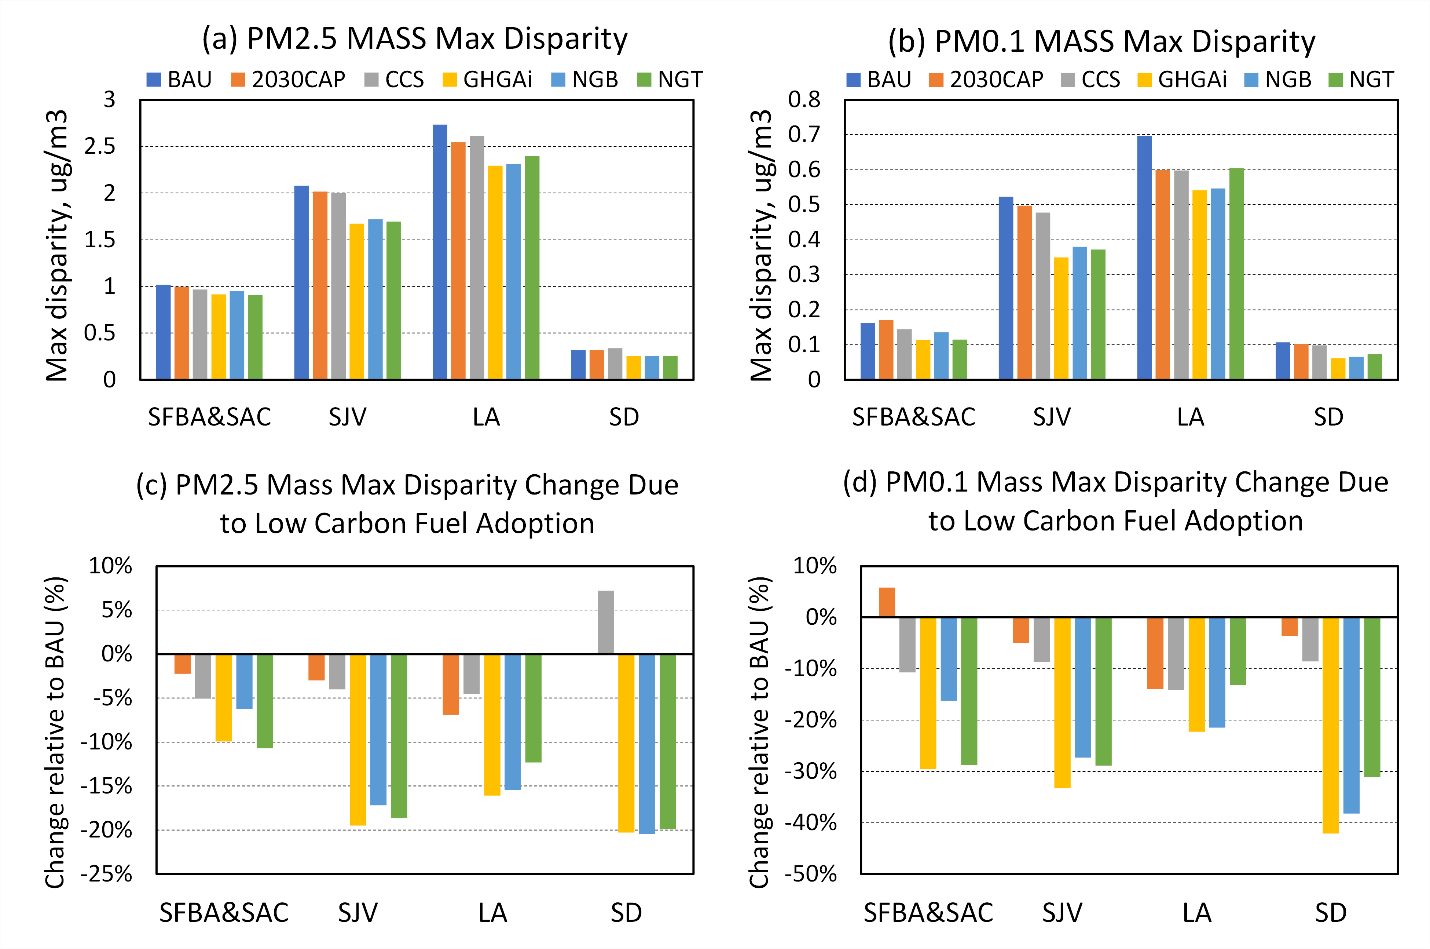
Figure 7: Change in PM2.5 mass and PM0.1 mass exposure disparities under different future energy scenarios. Maximum disparity between race/ethnicity groups is calculated as the difference between average concentrations experienced by the highest exposure group and the lowest exposure group. Top panels shows absolute values of population-weighted concentrations, bottom panels show changes relative to the BAU scenario.
Future O3 Source Apportionment
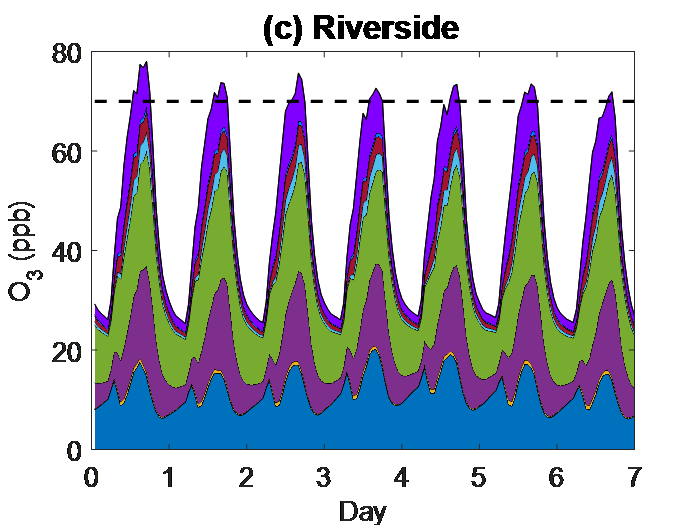
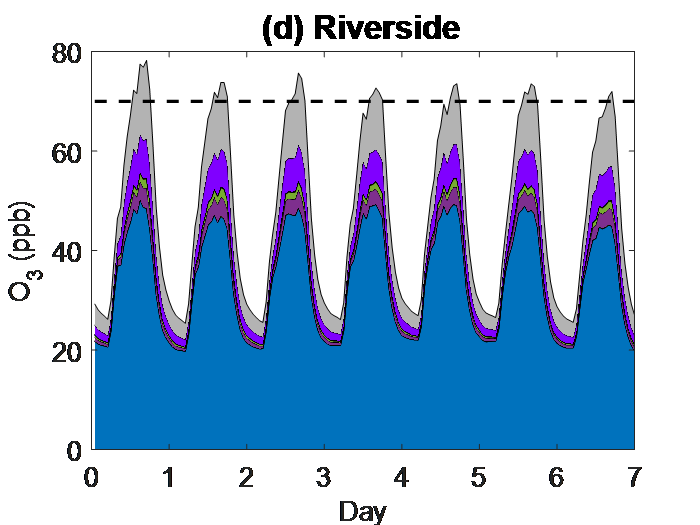
Air quality simulations for the year 2050 under the cleanest GHG-Step energy scenario still have summer O3 concentrations that exceed 70 ppb in the South Coast Air Basin surrounding Los Angeles. O3 source apportionment calculations were built into the SAPRC11 chemical mechanism at the heart of these calculations to separately predict NOx source contributions to O3 formation and VOC source contributions to O3 formation. Separate calculations for NOx and VOC were necessary to clearly understand feasible emissions control strategies. Most of the NOx that contributes to local O3 formation is emitted by local sources such as off-road equipment & rail, marine vessels & aircraft, and industrial & agricultural sources. VOC controls are more difficult to plan because the majority of the VOC that contributes to background O3 formation is released from upwind sources (outside California) or local biogenic sources. Source apportionment calculations indicate that off-road equipment & rail sources and industrial & agriculture sources do release VOC that contributes to 5-10 ppb of local O3 formation. NOx and VOC emissions from off-road equipment & rail sources and industrial & agricultural sources should be targeted for further emissions reductions through the adoption of low carbon fuels in order to reduce O3 concentrations below 70 ppb in the South Coast Air Basin in the year 2050.
| NOx Source Apportionment for O3 | VOC Source Apportionment for O3 |
 |  |
 | |
Figure 8: O3 concentrations predicted over an average summer week at Riverside, CA, during the years 2046 – 2050.
Creation public tools for climate-energy portfolio-emissions-population exposure-health effects-sustainability
The detailed energy scenarios and air quality analysis created under the current project have helped to support the development of a simplified analysis framework sponsored by the California Air Resources Board (CARB Project #20RD007, PI: Delucchi). The main part of this project will be the development of a user-friendly, publicly available model of the societal benefits of reducing emissions of criteria pollutants (CAP) and toxic air contaminants (TACs) (together designated CAPTACs) in California. The Benefits ESTimator for AIR emissions reductions (BEST-AIR) model will provide highly detailed estimates of the health benefits of CAPTAC emission reductions; detailed estimates of the agriculture and visibility benefits of CAP-emission reductions; and simple estimates of the materials and ecosystem benefits of CAP-emission reductions. BEST-AIR will estimate benefits at the level of the census tract (CT), from the present to the year 2100 and beyond.
Base-year and projected business-as-usual (BAU) emission inventories will be developed for BEST-AIR, partially based on the emissions scenarios developed under the current EPA project # RD 83587901. Statistical relationships between emissions inventories and air quality will be developed for the BEST-AIR model and the accuracy of those relationships will be tested against the CTM results created under the current EPA project # RD 83587901. BEST-AIR will then allow the user to specify new emissions reductions scenarios by pollutant, emission sector, region, and year. In effect, the BEST-AIR model will use fast statistical methods to estimate changes to emissions and changes to air quality associated with different future energy scenarios. The major advantage of BEST-AIR will be the speed of the calculations and the generalized user interface that will allow non-experts to exercise the model over a wide range of scenarios.
Journal Articles on this Report : 5 Displayed | Download in RIS Format
| Other project views: | All 11 publications | 5 publications in selected types | All 5 journal articles |
|---|
| Type | Citation | ||
|---|---|---|---|
|
|
Li Y, Kumar A, Li Y, Kleeman MJ. Adoption of low-carbon fuels reduces race/ethnicity disparities in air pollution exposure in California. Science of The Total Environment 2022;834:155230. doi:10.1016/j.scitotenv.2022.155230. |
R835879 (Final) |
Exit Exit |
|
|
Li Y, Yang C, Li Y, Kumar A, Kleeman MJ. Future emissions of particles and gases that cause regional air pollution in California under different greenhouse gas mitigation strategies. Atmospheric Environment 2022;273:118960. doi:10.1016/j.atmosenv.2022.118960. |
R835879 (Final) |
Exit Exit |
|
|
Zapata CB, Yang C, Yeh S, Ogden J, Kleeman MJ. Estimating criteria pollutants using the California Regional Multisector Air Quality Emissions (CA-REMARQUE) model v1.0. Geoscientific Model Development 2018;11(4):1293-1320. |
R835879 (2017) R835879 (2018) R835879 (2019) R835879 (Final) |
Exit Exit |
|
|
Zapata CB, Yang C, Yeh S, Ogden J, Kleeman MJ. Low carbon energy generates public health savings in California. Atmospheric Chemistry and Physics 2018;18(7):4817-4830. |
R835879 (2017) R835879 (2018) R835879 (2019) R835879 (Final) |
Exit Exit |
|
|
Kumar A, Zapata C, Yeh S, Yang C, Ogden J, Lee HH, Chen SH and Kleeman MJ. Effects of Low‐Carbon Energy Adoption on Airborne Particulate Matter Concentrations With Feedbacks to Future Climate Over California. Journal of Geophysical Research:Atmospheres 2020; 125(16). |
R835879 (Final) |
Exit Exit |
Supplemental Keywords:
Climate change, GHG, AB32, emissions reduction, criteria pollutants, air pollution, environmental justice, socio-economic status, race, ethnicity, public health
Relevant Websites:
Professor Michael Kleeman Bio Exit
Progress and Final Reports:
Original AbstractThe perspectives, information and conclusions conveyed in research project abstracts, progress reports, final reports, journal abstracts and journal publications convey the viewpoints of the principal investigator and may not represent the views and policies of ORD and EPA. Conclusions drawn by the principal investigators have not been reviewed by the Agency.