
Grantee Research Project Results
Final Report: Toxicity Screening with Zebrafish Assay
EPA Grant Number: R835168Title: Toxicity Screening with Zebrafish Assay
Investigators: Tanguay, Robyn L.
Institution: Oregon State University
EPA Project Officer: Aja, Hayley
Project Period: May 1, 2012 through April 30, 2016
Project Amount: $1,199,999
RFA: Developing High-Throughput Assays for Predictive Modeling of Reproductive and Developmental Toxicity Modulated Through the Endocrine System or Pertinent Pathways in Humans and Species Relevant to Ecological Risk Assessment (2011) RFA Text | Recipients Lists
Research Category: Chemical Safety for Sustainability
Objective:
The objectives are to:
- Expose zebrafish embryos to at least 1,000 chemicals.
- Study the morphology and behavior of the embryos to look for evidence of developmental toxicity.
- When an adverse effect occurs, conduct whole-transcriptome RNA sequencing studies to observe gene expression patterns, identify the initial biochemical target, and begin to elucidate the toxicity pathway.
- Conduct statistical modeling to compare the results of the zebrafish assay with the results of in vitro assays and other in vivo assays where they exist.
- Share our data with EPA and the broader research community.
Summary/Accomplishments (Outputs/Outcomes):
As identified on the last progress report, the following were the focus of this year’s efforts:
- Complete the array analysis for the 25 selected endocrine disruptor compounds (EDCs).
- Begin the comparative bioinformatic analysis.
- Complete the Triclosan gene expression analysis.
- Broadly disseminate results.
We have completed each of these objectives and a summary for each is below.
- Complete the array analysis for the 25 selected EDCs.
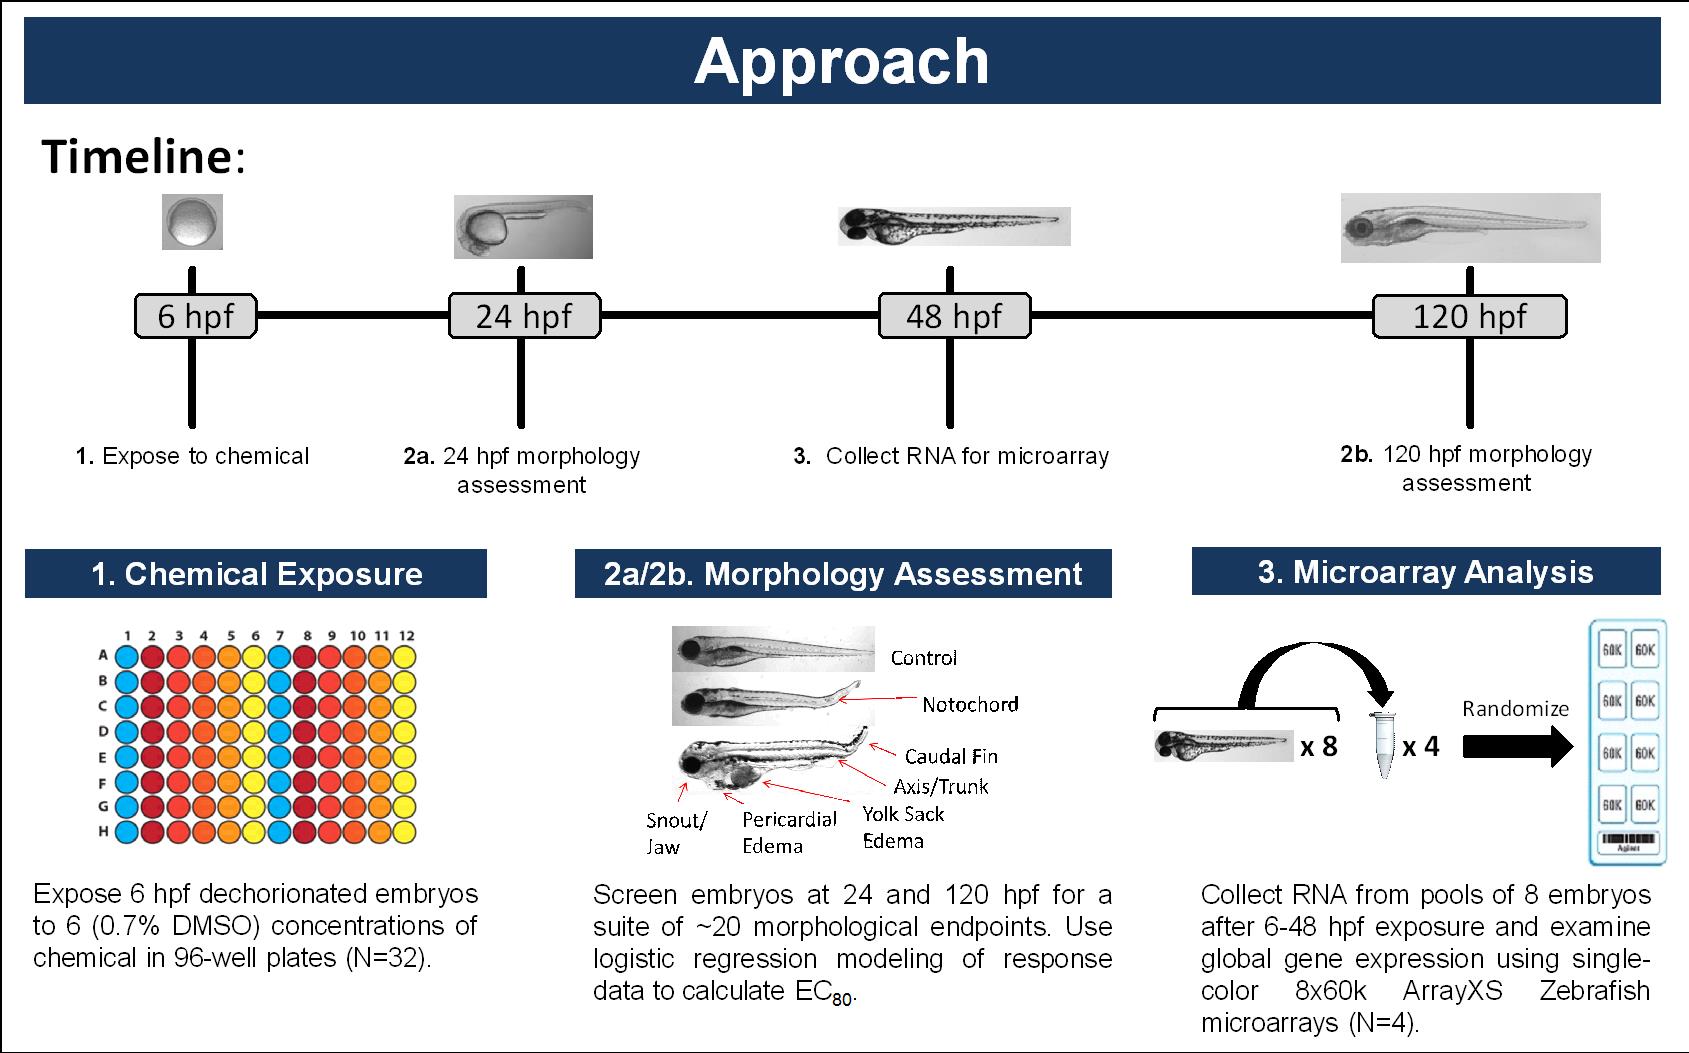
Due to variability in RNA sequencing quality, we decided to use high-density micro arrays for the gene expression studies. A summary of the experimental plan that we developed is summarized below in Figure 1. We selected the ArrayXS Zebrafish microarrays as a robust high-density platform for assessing the impact of EDCs in developing zebrafish. Because we were not primarily interested in identifying novel transcripts, these 60K high-density arrays are ideally suited for these studies. The replicates were nicely clustered using Principle Component analysis.
- Begin the comparative bioinformatic analysis of the EDC 48 hpf gene expression analysis.
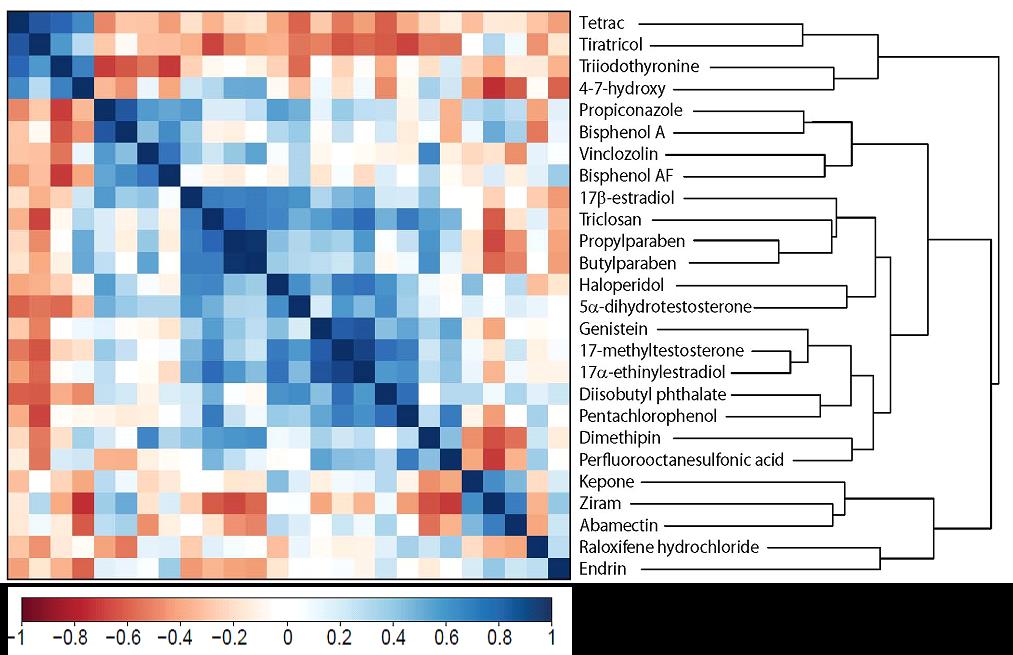
We have completed all of the initial gene expression analysis and identified clear separation of the patterns of gene expression (Figure 2). The three thyroid compounds and the unknown compound, 4-7-hydroxy, had the most similar transcriptome profiles of all chemicals tested. In this year, we have focused efforts on the thyroid active compounds. A total of 343 unique transcripts were DE for all four compounds (Figure 3). Regression analysis showed good correlation between the treatments and a small grouping of highly expressed transcripts.
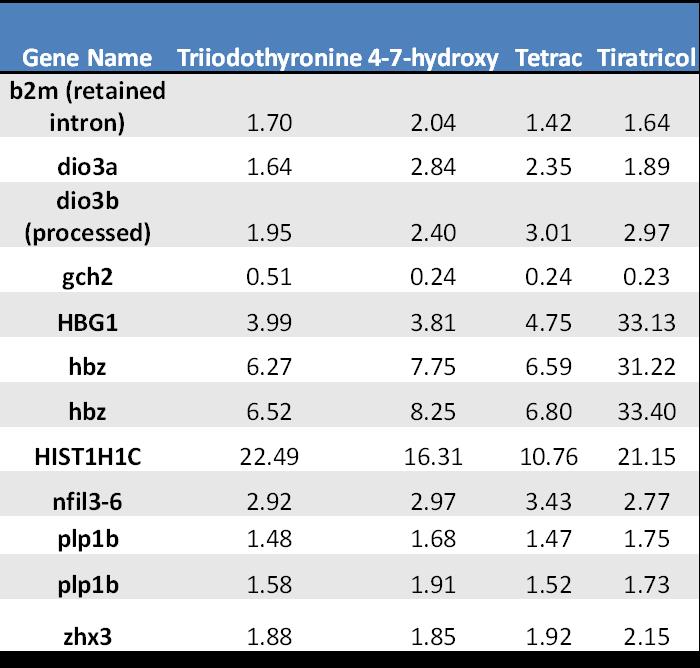
The 12 significant differentially expressed transcripts in common with all four compounds are listed in Table 1. It is noteworthy that these transcripts may represent new diagnostic biomarkers of thyroid active compounds in this model. The validation studies are underway. Finally, pathway analysis is underway and will be the focus of the next year.
Figure 1. Overall experimental approach for gene expression analysis.
Figure 2. Clustered correlation matrix of the transcript-wise Pearson correlation coefficients of the top 1000 significant differentially expressed (DE) probes between each treatment group (p ≤ 0.05). The three thyroid compounds and the unknown compound, 4-7-hydroxy, had the most similar transcriptome profiles of all chemicals tested.
Figure 3. Ranked scatter matrix and significant transcript overlap between the thyroid cluster.
Table 1. Overlapping significant differentially expressed transcripts following exposure to thyroid active compounds. - Complete the Triclosan gene expression analysis.
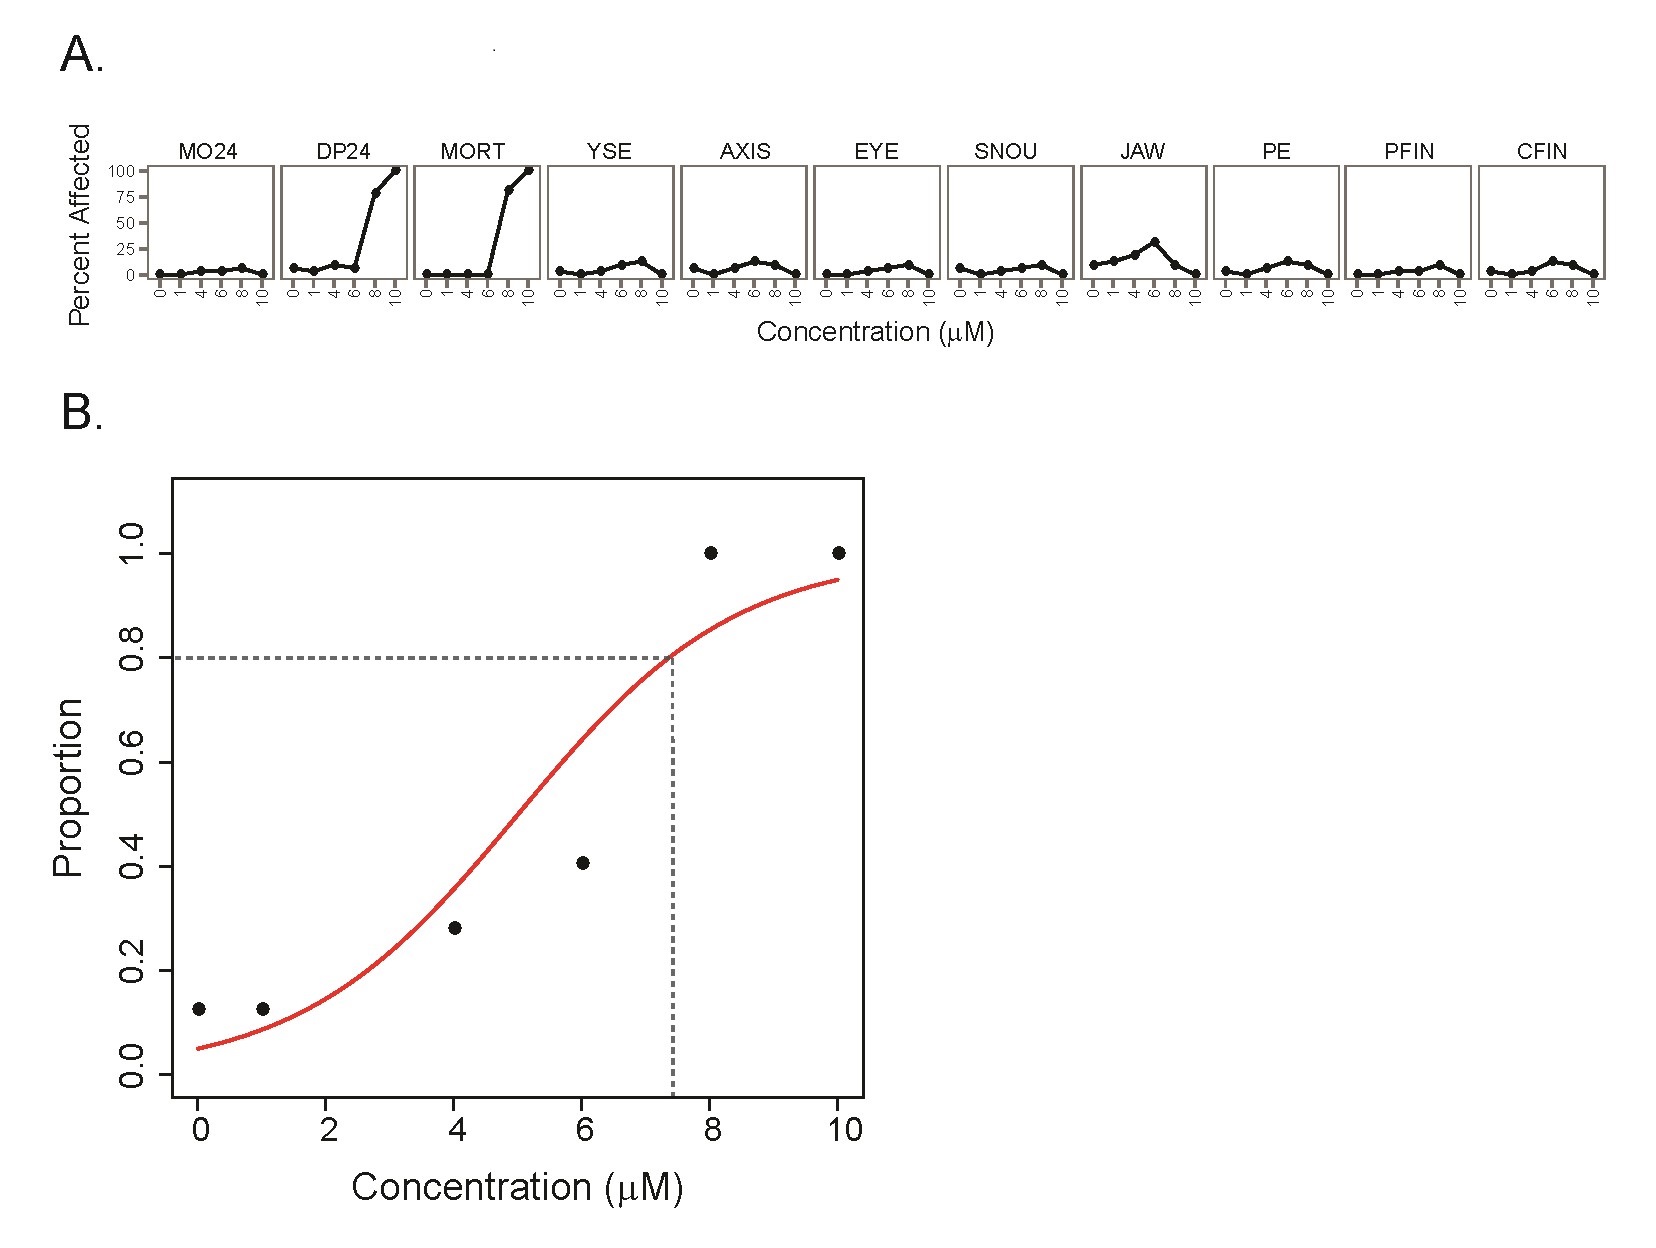
We have completed detailed gene expression analysis following Triclosan (TCS) exposures. Developmental toxicity of TCS was predominated by 24 hpf developmental delay, which was followed by mortality at 5 days (Figure 4) with a calculated EC80 of 7.37 mM. Of all of the tested chemicals in this study, TCS led to the largest number of gene expression changes with a total of 922 significantly DE transcripts (p-value ≤ 0.05, fold change ≥ 2), and GO enrichment analysis identified several biological processes effected by TCS including blood coagulation, platelet activation, glycolysis, and oxygen transport (Figure 5). In order to identify whether the TCS-induced transcriptional changes were involved in endocrine-related processes, we performed downstream functional analysis using MetaCore and identified several enriched biological processes and transcription factors that are involved in liver function (Table 2, Table 3). We did not observe significant enrichments in any biological processes or transcription factors that would indicate endocrine disruption by TCS. Furthermore, we conducted tissue-specific gene enrichment analysis, which showed that the significant DE transcripts were specifically enriched in the liver and brain and not in any endocrine tissues (Figure 6). These results suggest that TCS is hepatotoxic in embryonic zebrafish and is likely not impacting endocrine-related pathways at this concentration in 48 hpf zebrafish. We also examined all of the ToxCast™ in vitro bioactivity data for TCS to compare these results with our transcriptomic data. We examined the response profile of TCS at three different levels of the ToxCast™ annotation scheme in order to examine its overall response across all assays and at more biologically relevant levels including the protein and nuclear receptor level. These results are summarized in Figure 7. Overall, the ToxCast™ bioactivity data were more similar to the hypothesized role of CAR/PXR signaling in TCS-induced effects on serum thyroxine levels from in vitro and rat studies than the hepatotoxic signature we observed in our zebrafish transcriptional data. Future studies will further explore the hepatotoxic mechanism of TCS in zebrafish. This manuscript was submitted to TAAP in May 2016.
Figure 4. Developmental toxicity (mortality and morbidity) profile and logistic regression analysis of TCS exposure. (A) Concentration response profile for 10, 8, 6, 4, 1, and 0 mM TCS exposure across 11 phenotypic endpoints. (B) Logistic regression analysis of TCS developmental effects for any adverse phenotype, with logistic curve shown in red. Dashed lines indicate the EC80.
Figure 5. TCS exposure induces robust transcriptional changes in embryonic zebrafish. Heatmap visualization with bi-hierarchical clustering of significantly differentially expressed transcripts due to developmental exposure to the EC80 of TCS (FDR corrected p-value ≤ 0.05, fold change ≥ 2.0). The two clusters are annotated by significant functional clusters of enriched GO terms as determined by DAVID.
Table 2. Significantly enriched MetaCore process networks.
Table 3. Statistically over-connected transcription factors
Figure 6. TCS-induced transcriptional changes are significantly enriched in the liver and brain. Tissue-specific gene enrichment analysis of the significantly differentially expressed orthologous human genes was performed and visualized using the TSEA tool Exit (http://genetics.wustl.edu/jdlab/tsea/). Tissue enrichments are visualized as hexagonal nodes aligned along a dendrogram indicating the similarity of tissue-enriched transcript lists across the 25 tissues.
Figure 7. TCS bioactivity profile across three ToxCast assay annotation levels. Hit-call data across the “biological_process_target” (A), “intended_target_family” (B), and the nuclear receptor subset of “intended_target_family” (C) assay annotation levels were visualized using radial pie diagrams. For reference, the height of a slice indicates the hit percent and the size/angle of the slice indicates the total number of assays within that slice.


Journal Articles on this Report : 7 Displayed | Download in RIS Format
| Other project views: | All 27 publications | 7 publications in selected types | All 7 journal articles |
|---|
| Type | Citation | ||
|---|---|---|---|
|
|
Bugel SM, Wehmas LC, La Du JK, Tanguay RL. Phenotype anchoring in zebrafish reveals a potential role for matrix metalloproteinases (MMPs) in tamoxifen's effects on skin epithelium. Toxicology and Applied Pharmacology 2016;296:31-41. |
R835168 (Final) |
Exit Exit Exit |
|
|
Garcia GR, Noyes PD, Tanguay RL. Advancements in zebrafish applications for 21st century toxicology. Pharmacology & Therapeutics 2016;161:11-21. |
R835168 (Final) |
Exit Exit |
|
|
Reif DM, Truong L, Mandrell D, Marvel S, Zhang G, Tanguay RL. High-throughput characterization of chemical-associated embryonic behavioral changes predicts teratogenic outcomes. Archives of Toxicology 2016;90(6):1459-1570. |
R835168 (Final) |
Exit Exit Exit |
|
|
Truong L, Bugel SM, Chlebowski A, Usenko CY, Simonich MT, Simonich SLM, Tanguay RL. Optimizing multi-dimensional high throughput screening using zebrafish. Reproductive Toxicology 2016;65:139-147. |
R835168 (Final) R835796 (2017) |
Exit Exit Exit |
|
|
Zhang G, Truong L, Tanguay RL, Reif DM. A new statistical approach to characterize chemical-elicited behavioral effects in high-throughput studies using zebrafish. PLoS One 2017;12(1):e0169408 (16 pp.). |
R835168 (Final) R835796 (2017) |
Exit Exit Exit |
|
|
Zhang G, Marvel S, Truong L, Tanguay RL, Reif DM. Aggregate entropy scoring for quantifying activity across endpoints with irregular correlation structure. Reproductive Toxicology 2016;62:92-99. |
R835168 (Final) R835796 (2017) R835802 (2015) R835802 (2016) R835802 (2017) R835802 (2018) R835802C003 (2015) |
Exit Exit Exit |
|
|
Zhang G, Roell KR, Truong L, Tanguay RL, Reif DM. A data-driven weighting scheme for multivariate phenotypic endpoints recapitulates zebrafish developmental cascades. Toxicology and Applied Pharmacology 2017;314:109-117. |
R835168 (Final) |
Exit Exit Exit |
Progress and Final Reports:
Original AbstractThe perspectives, information and conclusions conveyed in research project abstracts, progress reports, final reports, journal abstracts and journal publications convey the viewpoints of the principal investigator and may not represent the views and policies of ORD and EPA. Conclusions drawn by the principal investigators have not been reviewed by the Agency.