
Grantee Research Project Results
Final Report: Creating Building Blocks for a More Dynamic Air Quality Management Framework
EPA Grant Number: R835215Title: Creating Building Blocks for a More Dynamic Air Quality Management Framework
Investigators: Demerjian, Kenneth L. , Hogrefe, Christian , Mao, Huiting , Yun, Jeongran , Civerolo, Kevin , Beauharnois, Mark , Ku, Michael , Bielawa, Robert
Institution: U. S. Environmental Protection Agency , New York State Department of Environmental Conservation , The State University of New York
Current Institution: New York State Department of Environmental Conservation , The State University of New York , U. S. Environmental Protection Agency
EPA Project Officer: Chung, Serena
Project Period: June 1, 2012 through May 31, 2015 (Extended to May 31, 2016)
Project Amount: $499,945
RFA: Dynamic Air Quality Management (2011) RFA Text | Recipients Lists
Research Category: Air Quality and Air Toxics , Air
Objective:
The overall objectives of the project are to: (1) develop a prototype system for providing real-time information on the contribution of short-term emission sources to air quality in relation to other source categories and the potential air quality benefits from episodic control measures, and (2) perform a comprehensive multipollutant air quality assessment that examines trends in pollutant concentrations versus emission controls and co-pollutant effects, and develop possible indicators that may aid in improved tracking of the effect of emission controls.
Summary/Accomplishments (Outputs/Outcomes):
This final report covers work performed during the original 3-year project period (June 1, 2012–May 31, 2015) and a 1-year, no-cost extension, bringing the revised end date of the project to May 31, 2016. This final report provides a summary of the results from Community Multiscale Air Quality—Direct Decoupled Method (CMAQ-DDM) computations and related analyses. In addition, a summary in the application and results of observation-based analyses for multipollutant air quality assessments is presented.
CMAQ-DDM Sensitivity Simulation Results
CMAQ-DDM simulations were used to compute O3 sensitivity to NOx and VOC precursor emission changes in emission categories, including (1) all anthropogenic emission sources, (2) mobile source emissions, (3) combined area and nonroad emissions, (4) “peaking unit” electric generating unit (EGU) point sources emissions, (5) all EGU point sources emissions, (6) other point sources emissions, (7) biogenic emissions, and (8) boundary conditions. The spatial sensitivity fields were calculated separately for the emission categories from the New York City-only area (NYCONLY), the MANEVU region except New York City (MVNONYC), the Southeastern U.S. region (SESARM), and the rest of the modeling domain (LADCEN) to distinguish sensitivities from local versus regional emissions.
An example of the sensitivity analyses performed is provided for Holtsville, New York, one of six monitoring sites studied in the region. Figure 1 shows hourly average distributions of O3 sensitivity to NOx/VOC emissions from the four emission sensitivity regions for the 10 worst days of daily maximum 8-hour average ozone at the Holtsville site. Contributions of NOx/VOC emissions from each emission category—mobile sources, area and nonroad sources, all EGU point sources, all other point sources, and biogenic sources—also are shown in Figure 1. The major contributions of NOx to O3 concentrations at the Holtsville site come from mobile sources. VOC contributions to O3 concentrations come mainly from biogenic sources. The comparison of O3 sensitivity to mobile-source NOx emissions versus O3 sensitivity to all-source NOx emissions indicates that up to 50 percent of O3 sensitivity to all-source NOx emissions is from mobile sources emissions. While up to 20 percent of O3 sensitivity to all-sources NOx emissions is from all EGU NOx source emissions.
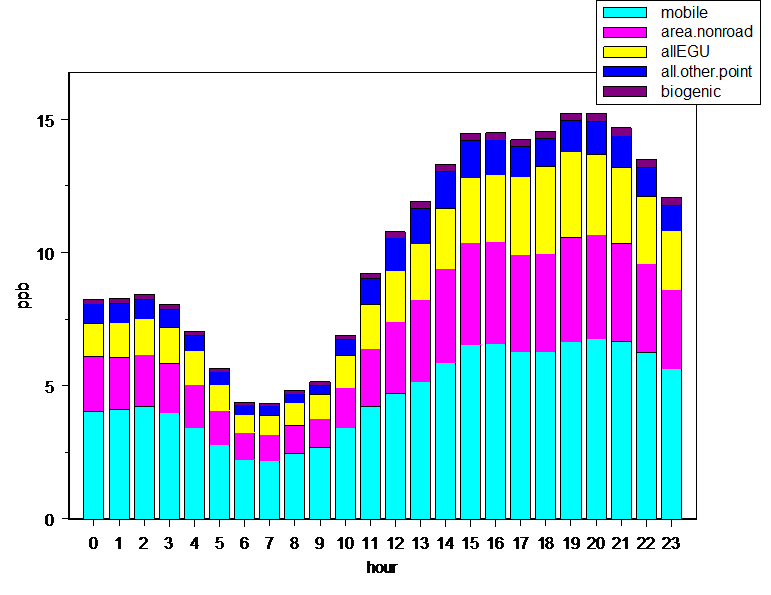
Figure 1a. Hourly average distributions of O3 sensitivity to emissions/regions at the Holtsville site for 10 worst days of daily maximum 8-hour average O3: NOx from the MVNONYC region
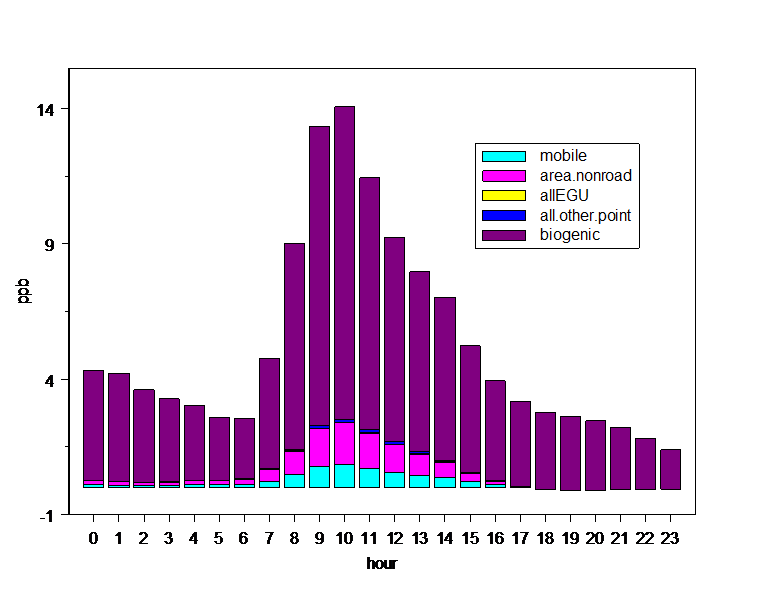
Figure 1b. Hourly average distributions of O3 sensitivity to emissions/regions at the Holtsville site for 10 worst days of daily maximum 8-hour average O3: VOC from the MVNONYC region
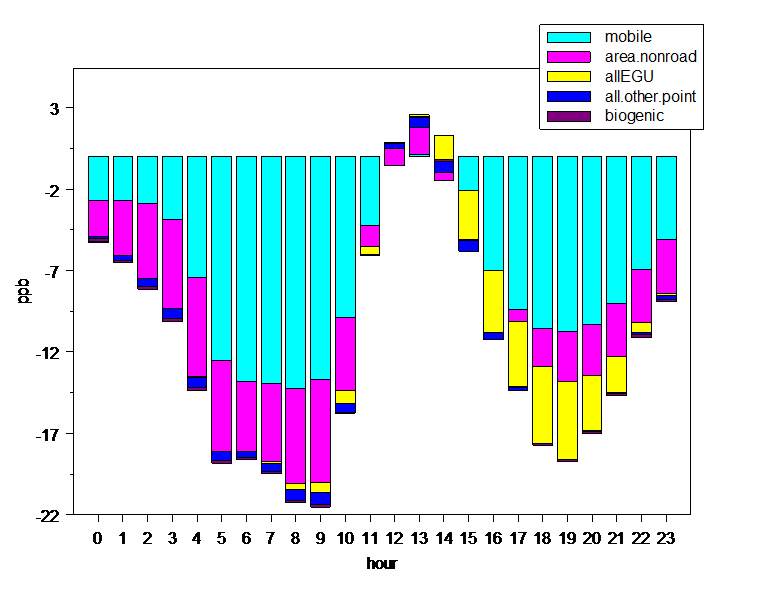
Figure 1c. Hourly average distributions of O3 sensitivity to emissions/regions at the Holtsville site for 10 worst days of daily maximum 8-hour average O3: NOx from the NYCONLY region
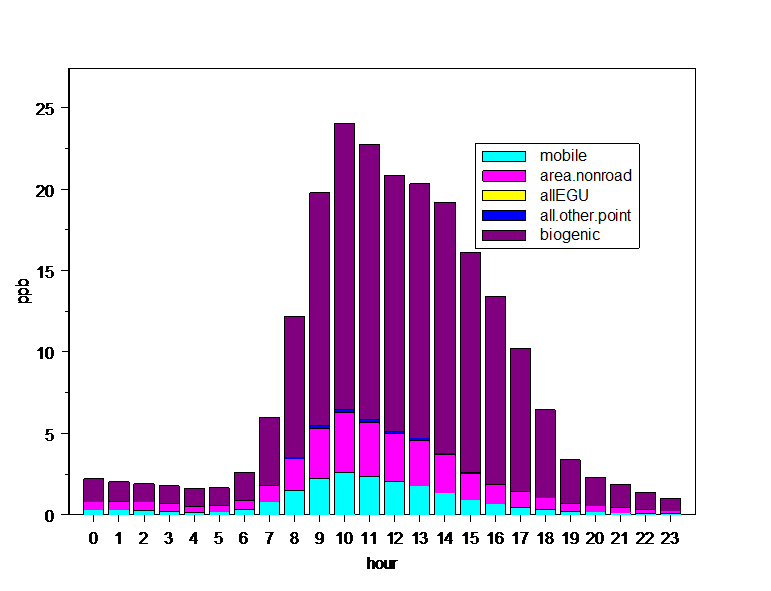
Figure 1d. Hourly average distributions of O3 sensitivity to emissions/regions at the Holtsville site for 10 worst days of daily maximim 8-hour average O3: VOC from the NYCONLY region
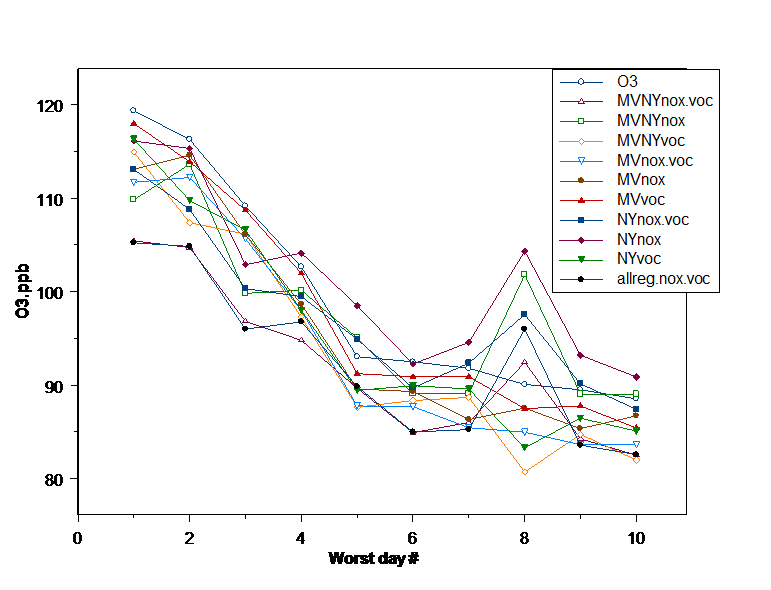
Figure 2. Daily maximim 8-hour average O3 (base) of 10 worst days and new daily maximum 8-hour average O3 for each emission/region (all sources) change scenario at the Holtsville site
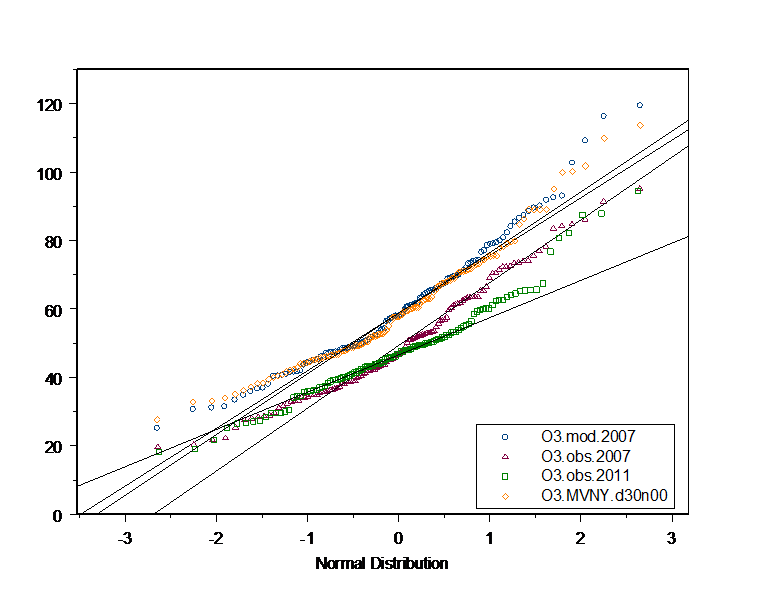
Figure 3. QQ-Plots for daily maximum 8-hour average O3 (5/15–9/15) at the Holtsville site: 2007 modeled O3; 2007 observed O3; 2011 observed O3; and new O3 with 30 percent reduction of NOx from all sources at the MVNONYC+NYCONLY region
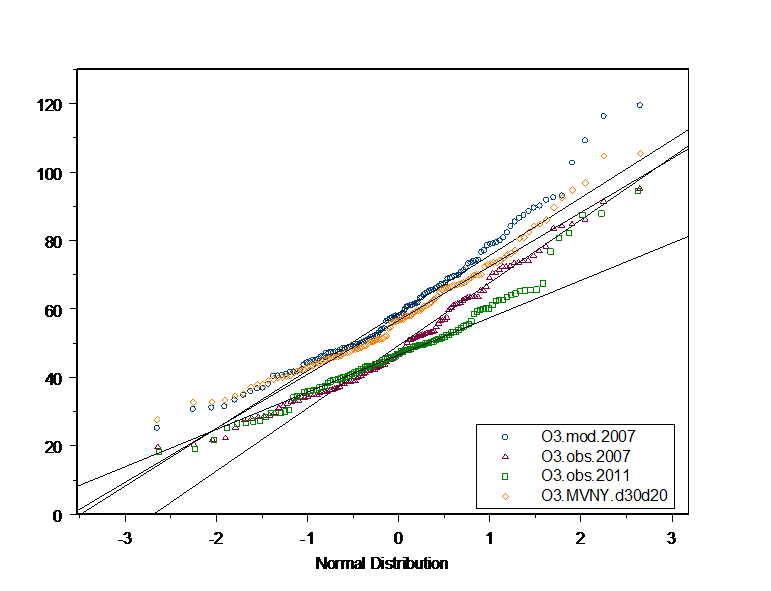
Figure 4. QQ-Plots for daily maximum 8-hour average O3 (5/15–9/15) at the Holtsville site: 2007 modeled O3; 2007 observed O3; 2011 observed O3; and new O3 with 30 percent reduction of NOx and 20 percent reduction of VOC from all sources at the VNONYC+NYCONLY region
New O3 concentrations with 30 percent NOx reduction only are shown in Figure 3, while new O3 with both NOx reduction (30%) and VOC reduction (20%) are shown in Figure 4. When comparing the two scenarios, the combined NOx and VOC reductions from all sources resulted in more O3 reduction.
As shown in Figure 1, VOC contributions to O3 formation are mainly from the biogenic sources. This also is observed with 50 percent biogenic VOC emission reductions at the MVNONYC and NYCONLY regions. Each showing significant O3 concentration decrease, values close to 2007 observed O3 concentrations at the Holtsville site. Fifty percent all source VOC reductions, including biogenic VOC emission resulted in as much decrease in O3 concentrations as biogenic VOC only reductions. Suggesting that overestimates in O3 concentrations at the Holtsville site could be caused by overestimates in biogenic source emissions inventory.
It is clear that significant emission reductions will be needed to meet the revised primary O3 National Ambient Air Quality Standard (NAAQS) of 70 ppb (annual 4th highest daily maximum 8-hour average concentration averaged over 3 years). Calculations of 3-year moving average of the fourth-highest daily maximum 8-hour average O3 concentrations (design values) at select monitor sites in New York and Connecticut show downward trends indicating improved air quality over the past several years. Although 2014 design values at some monitor sites in New York are less than 75 ppb, most design value monitor sites in New York and Connecticut are above 70 ppb. For those monitor sites, control strategies on NOx and VOC emissions will need to be developed. We have demonstrated that the CMAQ-DDM sensitivity results can be applied to evaluate individual emission sector reductions to meet the new primary NAAQS O3 standard for those nonattainment areas based on 2007 base model year and developed control strategies.
The second objective of this project compiled emissions and air quality concentration data resources for selected monitoring sites in the Northeast to track the comparability of emissions and concentration trends. We have conducted analyses of emission tracers and multipollutant relationships, including CO, NOx, NOy, SO2, CO versus O3, NOy versus O3, CO versus NOx, Hg0 versus CO, Hg0 versus SO2, and SO2 versus NOx as well as analyses of their annual trends and factors impacting interannual variability. Analyses of observed trends in multipollutant relationships with DDM sensitivities are being explored and the results shared with air quality planners to identify avenues towards a more adaptive, dynamic air quality planning framework.
Conclusions:
Current Understanding of the Driving Mechanisms for Spatiotemporal Variations of Atmospheric Speciated Mercury: A Review
Spatial and temporal variations of atmospheric speciated mercury are controlled by changing anthropogenic and natural emission sources, as well as chemical, dynamical and physical processes. Understanding of such variations can advance our knowledge of mercury cycling. This review summarized spatiotemporal variations of total gaseous mercury or gaseous elemental mercury (TGM/GEM), gaseous oxidized mercury (GOM) and particulate-bound mercury (PBM) in various environments, including oceans, continents, high elevation, the free troposphere, and low to high latitudes. In the marine boundary layer (MBL), the oxidation of GEM was generally thought to drive the diurnal and seasonal variations of TGM/GEM and GOM in most oceanic regions, leading to lower GEM and higher GOM from noon to afternoon, higher GEM during winter, and higher GOM during spring–summer. At continental sites, the driving mechanisms of TGM/GEM diurnal patterns included surface and local emissions, boundary layer dynamics, GEM oxidation, and for high-elevation sites mountain-valley winds, while oxidation of GEM and entrainment of free tropospheric air appeared to control the diurnal patterns of GOM. No pronounced diurnal variation was found for Tekran measured PBM at MBL and continental sites. Seasonal variations in TGM/GEM at continental sites were attributed to increased winter combustion and summertime surface emissions and monsoons in Asia, while those in GOM were controlled by GEM oxidation, free tropospheric transport, anthropogenic emissions and wet deposition. Increased PBM at continental sites during winter was primarily due to local/regional coal and wood combustion emissions. Long-term TGM measurements from the MBL and continental sites indicated an overall declining trend. Limited measurements suggested TGM/GEM increasing from the southern to northern hemisphere due largely to the vast majority of Hg emissions in the NH, and the latitudinal gradient was insignificant in summer probably as a result of stronger meridional mixing. Aircraft measurements showed no significant vertical variation in GEM over the field campaign regions; however, depletion of GEM was observed in stratospherically influenced air masses. In examining the remaining questions and issues, recommendations for future research needs were provided, and among them is the most imminent need for GOM speciation measurements and fundamental understanding of multiphase redox kinetics.
Regional and Hemispheric Influences on Temporal Variability in Baseline Carbon Monoxide and Ozone over the Northeast United States
Interannual variability in baseline CO and O3, defined as mixing ratios under minimal influence of recent and local emissions, was studied for seven rural sites in the Northeast United States for the period 2001–2010. Annual baseline CO exhibited statistically decreasing trends (-4.3 – -2.3 ppbv yr-1) probably due to global anthropogenic CO emission reductions. The decreasing U.S. CO emissions and increasing Asian emissions perhaps caused the relatively constant wintertime and springtime baseline CO at the two highest sites. No significant trends were found in baseline O3 at any sites in association with the opposite trends in NOx emissions worldwide and relatively constant methane levels in the 2000s. Biomass burning emissions impacted baseline CO with ~38 percent variability from wildfire emissions in Russia and ~22 percent in Canada, and they impacted baseline O3 (~27% variability from wildfires in Russia and Canada, respectively) at high-elevated sites only. The Arctic Oscillation was negatively correlated with summertime baseline O3, while the North Atlantic Oscillation was positively correlated with springtime baseline O3. Anthropogenic NOx emission reductions and meteorology together caused decadal increasing trends (~2.55 ppbv yr-1) in springtime and wintertime baseline O3 in southern New Hampshire. This study suggested that impacts of anthropogenic and biomass burning emissions and meteorological conditions were important factors in determining baseline O3 and CO in the Northeast United States during the 2000s. A manuscript has been under review at Atmospheric Environment, Zhou et al., 2016.
Impacts of Large-Scale Circulation on Regional versus Local Contribution to Ambient Concentrations of Gaseous Elemental Mercury in urban New York
The impact of interannual variation in large-scale circulation on urban ambient concentrations of GEM was examined using 7 years (2008–2015) of GEM data from a monitoring site in the Bronx borough of New York City. Distinct annual cycles of GEM were found in 2009 and 2010 with 10–20 ppqv higher mixing ratios in warm seasons (i.e., spring and summer) than in cool seasons (i.e., fall and winter). This annual cycle pattern was disrupted in winter 2010 by anomalously strong northerly flow and was resumed in 2014 with significantly enhanced amplitude up to nearly 70 ppqv, likely linked to the occurrence of a particularly strong Bermuda High in the warm season. Seasonal median mixing ratios of GEM tracked well both the North American trough axis index (TAI) and the trough intensity index (TII) in winter and tracked TII well in summer. The intensity and position of the subtropical high-pressure system appeared to have a significant impact on Bronx GEM in warm seasons evidenced in strong correlation (r up to 0.96, p < 0.05) of seasonal median mixing ratios with Bermuda High intensity indices in summer. GEM and CO in each season were found to be correlated at r varying over 0.24–0.66 (p ~ 0) from fall 2008 to spring 2013, and r was -0.07–0.09 (p < 0.05 mostly) over winter 2014–spring 2015. GEM was hardly correlated with SO2 and NO2, normally found otherwise in urban airshed in the literature, due possibly to different emissions control strategies, different lifetimes, and more diverse sources for GEM than SO2 and NO2 affecting the Bronx. Significant interannual variation was found in the regional and local anthropogenic contributions, averaged at ~75 percent and 25 percent respectively, to the anthropogenic portion of the New York City ambient level of GEM. The reportedly increasing intensity and spatial extent of the Bermuda High could cast a stronger influence on the Northeastern United States, and its effect on ambient concentrations of Hg via regional build-up and legacy emissions could dominate over the effect of anthropogenic emission control. A manuscript has been submitted to Journal of Atmospheric Science, Mao et al., 2016.
Trends in Background Concentrations of Hg° in the Northeastern United States
An analysis of multiyear data sets suggested a decreasing trend of 3.8 ± 0.9 ppqv yr-1 in background mixing ratios of gaseous elemental mercury (Hg°) at an elevated, rural site, Pack Monadnock, in New Hampshire. It is in close agreement with the declining trends reported from Mace Head (3.1 ± 1.1 ppqv yr-1), Cape Point South Africa (3.8 ± 0.6 ppqv yr-1), and mid-latitude Canadian sites (~2.6–3.9 ppqv yr-1). At a coastal, rural site, Thompson Farm, in southern New Hampshire, It was found that an abrupt increase in fall 2006 seemed to lead to no trends there during the period of 2003–2010. At another rural site, Huntington Wildlife Forest in upstate New York, no trend was observed over February 2006–August 2013 despite the three unusually large values in February, March and December 2007. Further examination suggested a decreasing trend in the anthropogenic component at all three sites, which probably was the mechanism that drove the decline in the background concentrations observed at locations from previous studies. However, near the surface, different from other years, there was abundant precipitation in the senescence months in 2006 followed by a lack of snow in the following winter in the Northeastern United States. An examination of long-term soil moisture data for a northeastern site (Lye Brook, New York) suggested soils to be the driest in the year 2007 during the decade of 2001–2011. Drier soils had been observed to be closely linked to reduced Hg° evasion rates from soils. It was thus hypothesized that near the surface, Hg° evasion from ecosystems in fall 2006 and the year 2007 was significant enough to alter the declining trend in background Hg° in the Northeastern United States that appeared to be controlled primarily by decreasing anthropogenic emissions. These findings are in preparation for publication, Mao, et al., 2016.
Journal Articles on this Report : 5 Displayed | Download in RIS Format
| Other project views: | All 15 publications | 5 publications in selected types | All 5 journal articles |
|---|
| Type | Citation | ||
|---|---|---|---|
|
|
Mao H, Cheng I, Zhang L. Current understanding of the driving mechanisms for spatiotemporal variations of atmospheric speciated mercury: a review. Atmospheric Chemistry and Physics 2016;16(20):12897-12924. |
R835215 (Final) |
Exit Exit |
|
|
Mao H, Ye Z, Driscoll C. Meteorological effects on Hg wet deposition in a forested site in the Adirondack region of New York during 2000–2015. Atmospheric Environment 2017;168:90-100. |
R835215 (Final) |
Exit Exit Exit |
|
|
Mao H, Hall D, Ye Z, Zhou Y, Felton D, Zhang L. Impacts of large-scale circulation on urban ambient concentrations of gaseous elemental mercury in New York, USA. Atmospheric Chemistry & Physics 2017;17(18):11655-11671. |
R835215 (Final) |
Exit Exit |
|
|
Zhou Y, Mao H, Demerjian K, Hogrefe C, Liu J. Baseline carbon monoxide and ozone in the northeast US over 2001–2010. Atmospheric Chemistry and Physics Discussions 2015;15:27253-27309. |
R835215 (2013) R835215 (Final) |
Exit Exit |
|
|
Zhou Y, Mao H, Demerjian K, Hogrefe C, Liu J. Regional and hemispheric influences on temporal variability in baseline carbon monoxide and ozone over the Northeast US. Atmospheric Environment 2017;164:309-324. |
R835215 (Final) |
Exit Exit Exit |
Supplemental Keywords:
air quality trends, atmospheric modeling, emission trends, episodic emission controls, multipollutant analysisProgress and Final Reports:
Original AbstractThe perspectives, information and conclusions conveyed in research project abstracts, progress reports, final reports, journal abstracts and journal publications convey the viewpoints of the principal investigator and may not represent the views and policies of ORD and EPA. Conclusions drawn by the principal investigators have not been reviewed by the Agency.