
Grantee Research Project Results
Final Report: Analytical Strategies for Assessing Cumulative Effects of Chemical and Nonchemical Stressors
EPA Grant Number: R834580Title: Analytical Strategies for Assessing Cumulative Effects of Chemical and Nonchemical Stressors
Investigators: Lai, Dejian , Linder, Stephen H. , Sexton, Ken , Peek, M. Kristin , Cutchin, Malcolm , Stowe, Raymond
Institution: The University of Texas at Houston , The University of Texas at Austin , Microgen LLC , University of Minnesota , University of North Carolina at Chapel Hill , The University of Texas Medical Branch - Galveston
Current Institution: The University of Texas at Houston , Microgen LLC , The University of Texas Medical Branch - Galveston , The University of Texas at Austin , University of Minnesota , University of North Carolina at Chapel Hill
EPA Project Officer: Hahn, Intaek
Project Period: June 1, 2010 through May 31, 2014 (Extended to May 31, 2015)
Project Amount: $555,923
RFA: Understanding the Role of Nonchemical Stressors and Developing Analytic Methods for Cumulative Risk Assessments (2009) RFA Text | Recipients Lists
Research Category: Human Health
Objective:
Our Analytical Strategies for Assessing Cumulative Effects (The Texas City project) adopts an alternative approach to modeling the ways that chemical exposures and non-chemical stressors can act separately, or in combination, to generate adverse health outcomes in community settings. The mechanisms linking chemical and non-chemical stressors to health outcomes remain obscure. For many environmental chemicals, the toxicological pathways from exposure to dose and on to disease response are well documented, but the corresponding pathways between social disadvantage and other non-chemical stressors and disparities in health have been less clear cut (Marmot, 2004). They are generally thought to involve psychosocial and behavioral mediators of system stress which, in turn, are implicated in elevated risk of disease. Our study community was Texas City in Galveston County, south of Houston; it borders Galveston Bay on the Texas Gulf Coast, and is bounded on the south by petrochemical refineries and on the east by heavy barge traffic. The practical advantage of focusing on Texas City was the availability of an existing data set that included blood assays of 12 stress-related biomarkers, a selection of neighborhood and individual characteristics, and a range of psychosocial measures based on self-reports from sampled residents.
Ours is the first community study that models both chemical and non-chemical stressors as a system of joint effects transmitted through specified pathways to direct biologic measures that are predictive of disease. This is a difficult challenge, empirically, because our observable measures in community settings remain crude and prone to error, and our knowledge of how they influence health is fragmentary and uncertain. To counter this, we developed a series of measurement models that combined indicators in systematic ways to strengthen their observable effects and control for error. Each measurement model was associated with one of several latent factors, intended to represent distinctive types of stressors. We then could model the causal pathways that linked these factors and trace their overall effect on physiological measures of adverse health. Each pathway would correspond to a structural equation; and its parameters, once estimated, would indicate the relative importance of this pathway and its corresponding latent factor. Since there are multiple pathways to be tested, the statistical estimation must be done simultaneously, posing special problems when real-world data are drawn from both the neighborhood and individual levels. This approach promised commensurable estimates of relative influence across stressors and exposure metrics to arrive at a simple, composite measure of cumulative risk.
Project activities were organized in phases around three goals: 1) establish valid Measurement Models for the major factors thought to contribute to adverse health outcomes, 2) specify and test Structural Equation Models which mirror the pathways linking these factors to outcomes, and 3) standardize and combine the direct and indirect pathway coefficients to derive relative estimates of overall impact. Here, the sequencing was crucial, since the products of earlier phases were necessary for beginning the later phases. Hence, the tasks for the first goal had to be fully complete before moving on to the second; and likewise, the third was dependent upon fully completing the second. This meant that any delays in accomplishing the first goal would effectively postpone all work on the second and third. Moreover, any shortcomings in the products of the earlier phases that were revealed later, as they were incorporated into subsequent modeling efforts, halted progress until these products could be re-estimated, transformed or re-analyzed. Again, any delays of this sort would affect the entire project.
Summary/Accomplishments (Outputs/Outcomes):
Ultimately, what had been a 3-year timeline went to 5 years, with the addition of two no-cost extensions. The first 2 years were taken up with measurement modeling and validation. Once the first round of structural equations was estimated, new problems with some of the measurement models emerged. Indicators were substituted, re-analyzed, and new models proposed, in an iterative process until estimation was complete. The specification and testing of the structural equation models took the remainder of our time. The software (GLLAMM), adopted to estimate our path coefficients, worked smoothly on small multi-level models but broke down whenever latent factors and intermediate (or indirect) paths were specified. After a year of experimentation, we replaced it with an alternative (Mplus) and began the model estimation phase over. By this December, we had generated a final model with stable, interpretable path estimates. The direct and indirect coefficients for each possible pathway can be compared across paths and combined to yield a new, composite measure of cumulative risk. This final model and the table of coefficients will be presented below. Our subsequent work beyond this project will focus on the significance and interpretation of these risk estimates.
Goal 1: Establish Valid Measurement Models – Completed
Much of the meta-data on the empirical indicators, drawn from the secondary data set on Texas City, needed to be re-documented and recoded. Procedures for scale construction were replicated, and some of the original measures were used to build composites that better suited our needs. We assumed that measures would operate at three levels of analysis: as individual characteristics, as neighborhood features (census block group level), and at the census tract level. Once indicators were well conditioned and better understood, we could proceed with their specification in sets.
A key feature of using latent factors to represent the joint effects of multiple indicators is the explicit specification of how the empirical measurement of factors is best accomplished. In our case, we adopted multiple indicators for each latent variable and assumed that the values taken on by the indicators are determined by the common latent variable and error. This required exploratory and then confirmatory factor analyses of candidate sets of indicators. We began with Measurement Models for 5 latent factors and 20 indicator variables. The final version yielded 3 latent factors—Disadvantage, Place-Based Stressors, and Psychosocial Stressors—and nine indicators. Our measures of ambient chemical exposures could not be effectively treated as a latent factor, nor could our dependent variable, adverse biologic health effects, once we linked the latent variables together in a structural equation model. Details will be presented below.
Goal 2: Specify and Estimate Structural Equation Models – Completed
A Structural Equation Model formalizes a map of direct and indirect pathways into a system of equations, whose solution yields coefficients of relative impact. Accordingly, both chemical and non-chemical stressors can be linked in explicit ways to our measures of adverse health effects. The inherent complexity of the solution algorithms for these systems and their data demands have limited the scope of their application in health disparities and environmental justice research and yet, having a reliable estimate of the relative strengths of different pathways, opens the door to estimating cumulative effect on health outcomes through a different kind of calculus based on relative impact by stressor, regardless of type. It also illuminates the workings of indirect paths which are absent from single equation approaches, such as Logistic or Poisson regression. The difficulty is getting to a stable, meaningful solution.
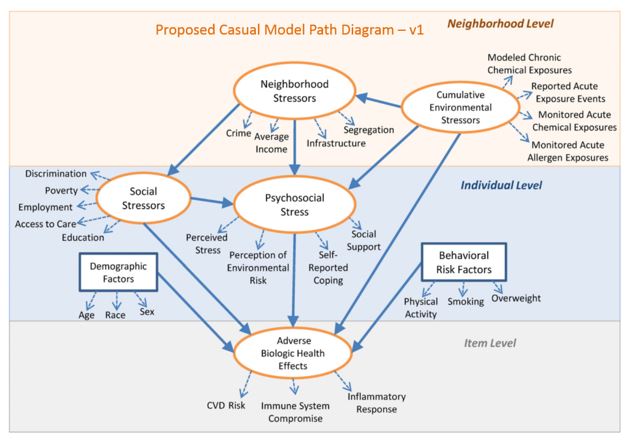
With the use of multiple indicators, the candidate Models are over‐identified (with redundant measures), enabling us to relax conventional assumptions that each of the observed indicators for a given latent factor was uncorrelated with others in its set. We then explored how changes in particular Measurement Models (linking empirical indicators to latent variables) affect the strength of the pathways linking latent variables. For example, in Version 1 of our model specification, we examined whether the effect of Cumulative Environmental Stressors on Psychosocial Stressors works primarily through perceptions of risk, and for neighborhoods at the highest levels of chemical exposure: is the direct path between Cumulative Environmental Stressors and Biologic Effects stronger than the indirect path through Psychosocial Stressors? We first used Generalized Linear and Latent Mixed Model (GLLAMM) software, a covariance decomposition procedure similar to confirmatory factor analysis1. This procedure would not permit the full estimation of Version 1, largely because it could not accommodate the complexity of the posited relationships among our latent factors (i.e., the indirect paths). After extensive but futile changes in our measurement models to adapt to these limitations, we dropped GLLAMM and moved to Mplus2, a widely-used program, better suited to structural equation modeling. Because the full set of model parameters are estimated simultaneously with this approach, each set of path coefficients for a particular model depends on the statistical adequacy of a unique set of Measurement Models. This establishes an iterative fitting process, where each structural equation specification (or version of the model) relies on a distinctive set of Measurement Models. Modifications in one requires revisions in the other. Progress in estimation, then, is a function of movement back-and-forth between Goal 1 and Goal 2. This loop lengthened the time required by several orders of magnitude.
We report below on 5 versions of our Structural Equation Model. We have detailed the changes from model-to-model and show the accompanying alterations in the Measurement Models for our latent factors. Each required multiple rounds of estimation and modification in the iterative loop mentioned above. A major disruption in our progress came with having to change our software and estimation technique in the middle of this process. We reached the operational limits of GLLAMM. Although it was adept at incorporating multi-level data; it could not accommodate the complexity of our models, at least with the data we had available. All of the estimation reported below is drawn from Mplus. We developed a best-fitting Model with stable path coefficients and an optimized set of Measurement Models.
Goal 3: Cumulative Risk Estimates – Incomplete
The final, analytical, phase of the project would have shifted from model testing and estimation on secondary data from Texas City to the task of cumulative risk assessment; here we re-define cumulative risk to correspond to our estimates of total effects on adverse health. Rather than relying on an ad hoc selection of empirical indicators to establish a profile of disparities in community settings, our approach builds on explicit Measurement Models that represent unique and meaningful combinations of indicators, weighted by their relative contribution to latent factors or categories of health determinants. In turn, the connections across these latent factors are also made explicit, as are the different pathways that lead to a cumulative impact on health. We can identify which components of the Model make the largest contribution to these effects and, at the same time, view the relative contribution of different empirical indicators to this result.
This approach builds on a systems view, where complex interconnections among observable indicators are made explicit. Further, it can respond to local conditions by accommodating alternative indicators and missing data with new Measurement Models that will alter the relative contribution of different pathways. The promise is that it will lead to better targeted interventions. The delays and unexpected issues in accomplishing our modelling meant that this final phase could not be undertaken during the project period. Since our modeling results were only recently available, our progress on this portion of the project will be on-going and reported in a subsequent publication.
METHODS
Input Data
Multiple types of data were used for this project, and each type has its own measurement characteristics and potential sources of error. First, there are data collected for the Texas City Stress and Heath Project. These data include categorical measures based on survey responses, demographic data drawn from U.S. Census sources, and biomarker data based on laboratory tests on serum drawn from survey respondents. These data are relatively unique in combining a range of stressors with biologic endpoints from a minority population that lives in close proximity to one of the largest and most hazardous refineries in the U.S. Although the area has certain distinctive features, such as its ethnic makeup and its level of disadvantage, the important point of similarity is the fence‐line character of many of the sampled neighborhoods, having special interest for issues relating disadvantage to disproportionate exposure. The original purpose of the study was to evaluate the relationship among stressors (a large petrochemical complex in particular), health status, and a number of covariates, with a particular focus on residents of Mexican heritage. Texas City, Texas, is located 37 miles from Houston, a gateway city and a port of entry for immigrants from Mexico. Texas City has a large foreign‐born Mexican population as well as a substantial US‐born Mexican American population.
The research design of the original sample (2005‐2006) involved a census of Hispanic households and a simple random sample of non‐Hispanic households. Selection of three ethnic strata was followed selection of Housing units (HUs) in each stratum, within each a randomly adult was selected among Mexican Americans aged 25‐64 and among non‐Hispanics. All Mexican Americans aged 65 and over were selected.
The original survey instrument contains scales and items measuring a wide array of demographic, behavioral, social, and health indicators. Interview rates in the main study were 80%, yielding a sample size of 2706, with age ranges of 25‐91. No differences were found between the characteristics of eligible individuals who refused to take the survey and of those who chose to participate. Item missing responses were also randomly distributed. Values for income and neighborhood perception were imputed with an Expectation Maximization algorithm. Blood samples were received from 54% of the participants (n = 1410). A trained phlebotomist drew blood in a clinic or in the subject’s home. Blood samples were centrifuged to obtain plasma, which was stored at -70°C until testing. Plasma cortisol was measured by enzyme immunoassay. Plasma levels of IL‐6, IL‐10, CRP, and TNF‐alpha were analyzed using standard ELISA methods. Samples were batch analyzed to minimize inter‐assay variation. The institutional review board at University of Texas Medical Branch approved the study protocol, and informed consent was obtained from all participants.
Environmental data sources included the US EPA's National‐scale Air Toxics Assessment 2005 (NATA) and Down Scaler (DS) model. NATA uses census tract level annual chronic exposure concentrations from the HAPEM and relates them to unit risk estimates from US EPA’s Integrated Risk Information System. These risk probabilities can be added for multiple endpoints to estimate cumulative risks from chemical stressors. The EPA’s DS model provided ozone and PM2.5 modeled exposure data at census tract level for years 2004-2006. The model was developed by the EPA and CDC for use in the National Public Health Tracking Network to explore the relation between air pollution exposures and public health outcomes.
The U.S. Census Bureau 2005-2009 American Community Survey was used to obtain various socio-economic indicators for the census tract and census block group areas.
Analytical Approach
Modeling begins with a theory-informed conceptual diagram that represents the latent factors and their pathways of direct and indirect effect on our dependent variable of interest. Each latent factor is accompanied by a corresponding measurement model that specifies a given factor’s connection to a candidate set of empirical indicators. Work on the measurement model proceeds through a series of exploratory and then confirmatory factor analyses that clarify the relationships between the indicators and estimate the statistical variation they share in common. Once this is completed, the next step is to assign Structural Equation Model parameters to each of the specified paths from the conceptual diagram. The statistical algorithm then simultaneously estimates the full set of parameters: path coefficients, the weights assigned to empirical indicators in the measurement models, error terms, and global fit metrics.
Model Transitions
The original conceptual model went through five major transitions. We illustrate the content of these changes in the following series of diagrams, labelled V.1 to V.5. Some of the early changes were driven by the quality or availability of data for the empirical indicators. Later changes were in response to iterative refinements intended to reduce error, improve overall goodness of fit, or insure substantive meaningfulness.
Changes from V.1 to V.2
Based on data availability:
Some of the Environmental Stressors were dropped: Monitored Acute Allergen Exposure, and Reported Acute Exposure Events. Monitored Acute Chemical Exposure was replaced with measures from modeled criteria pollutants.
Linguistic Isolation was introduced as segregation measure proxy and Safety Individual score proposed as a proxy for crime.
Discrimination and Access to Care were dropped due to data not being available. Social stressors were considered to be more influential at the census block group or census tract level. Subscales of Social Support and Self-reported coping were assessed separately as indicators of Psychosocial Stress, an endogenous latent factor. Race construction was changed to include Hispanic ethnicity. Allostatic load was substituted for Adverse Biologic Health Effects and was re-tested under 4 different computations.
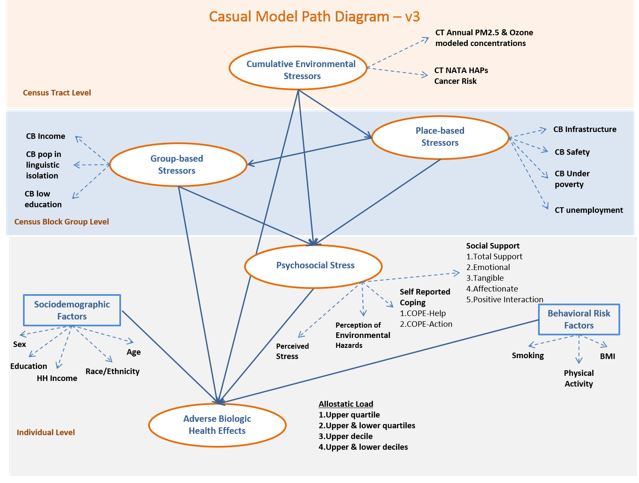
Changes from V.2 to V.3
Reorganized the levels to start with environmental stressor at the census tract level and effects trickling down to census bock group level and subsequently to individual level.
Neighborhood stressors were relabeled "Place-based Stressors" and reorganized to mostly include census block group (CBG) variables. To that effect, the individual scores of infrastructure and safety were transformed into average scores of census block groups; CBG income was replaced with CBG present of people under poverty; CT unemployment (CBG unemployment not available) was added as a new indicator of this latent variable.
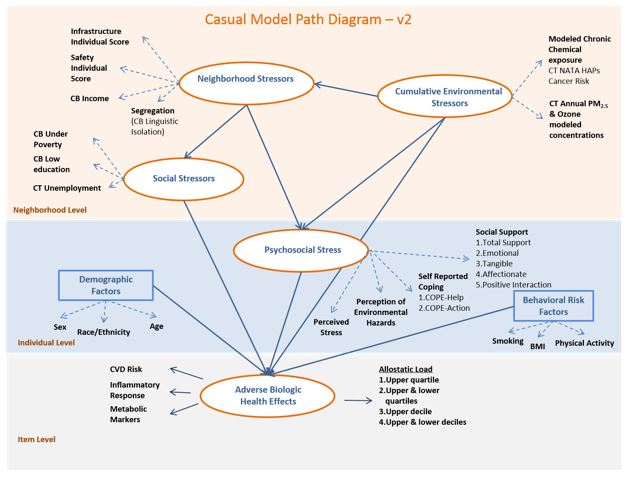
Social Stressors were relabeled “Group-based Stressors” and reorganized to include as observed variables (indicators) census block group-level income, linguistic isolation and low education.
The exogenous latent variable, Sociodemographic Factors, was expanded to include other indicators, such as individual and household income, besides the previous observable variables of sex, race/ethnicity and age. Allostatic load was determined to be the best dependent variable as modeled outcome.
Changes from V.3 to V.4
Based on previous evidence of the effects of environmental stressors on health and biologic indicators, these were decided to be considered as measured variables (PM2.5, ozone and total cancer risk) with a direct effect on the outcome rather than as measures of an exogenous latent variable. New construction of latent factors was re-assessed and tested through exploratory factor analyses. Due to high correlations between the group-based stressors and socio-demographics, the former group was omitted, yielding to creation of a new latent factor named “Disadvantage” that included individual education, household income and race/ethnicity as indicators.
Sociodemographic and behavioral risk factors (smoking, BMI, sex and age) with a known/suspected previous relationship to the outcome were left in the model as measured variables with a direct path to the outcome, thus reducing the number of latent factors in the interest of model convergence, given the current dataset.
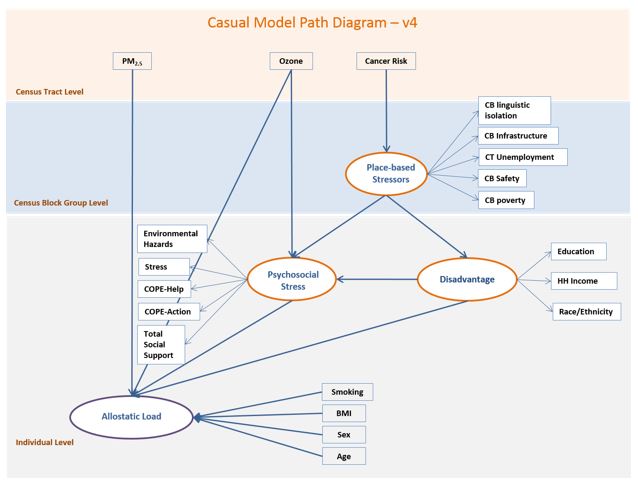
Changes from V.4 to V.5 - Final Model
We simplified the Measurement Models by backward elimination of variables that either presented negative residual variance or showed a lack of association with the outcome of interest, monitoring improvements in overall goodness of fit.
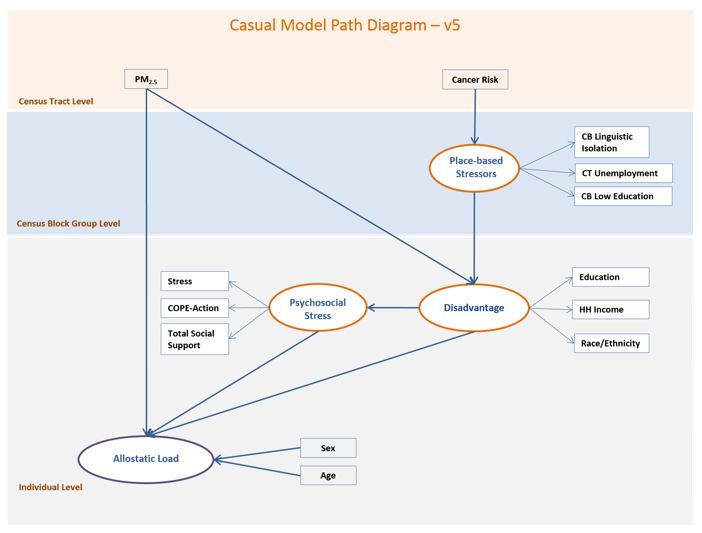
RESULTS
The final model incorporated three latent factors: 1) 'placed-based stressors' (f1), comprised of census block and census-tract-level linguistic isolation, unemployment and low education indicators, 2) 'disadvantage' (f2) composed of individual education, household income and race and ethnicity and 3) 'psychosocial stress' (f3), composed of individual scores on stress, COPE action and total social support scales (model v5). Exogenous and measured variables in the final model were area cancer risk, area PM2.5 concentrations, age, and sex.
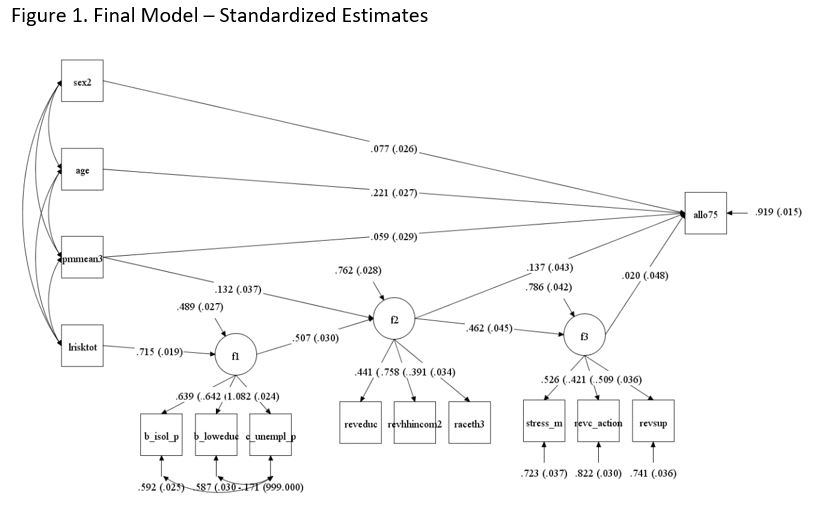
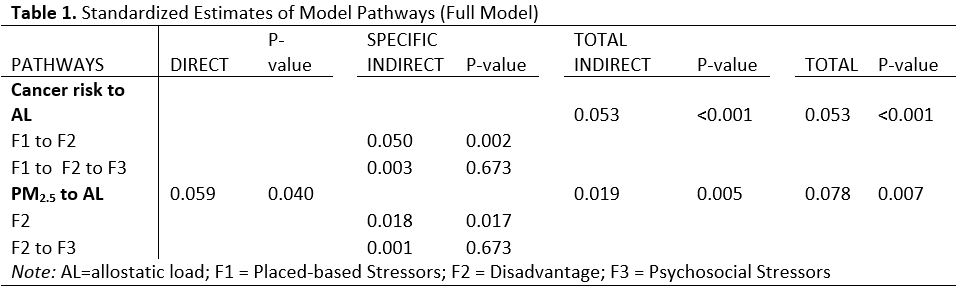
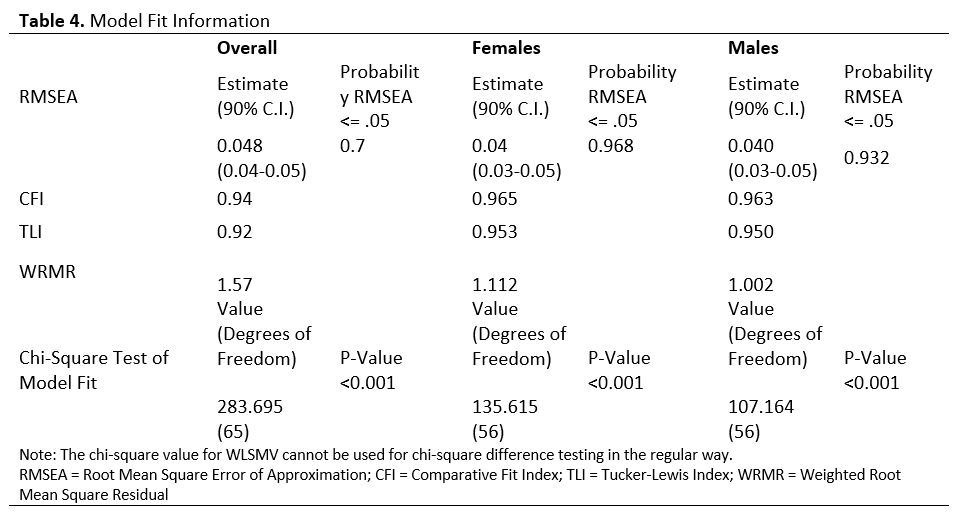
Final model estimation terminated normally and statistical fit tests denoted an adequate model. Root mean square error of approximation (RMSEA) was 0.048, with 90% confidence interval (CI) between 0.042 and 0.054, Comparative Fit Index (CFI)=0.94 and Tucker-Lewis Index (TLI) = 0.92, and Weighted Root Mean Square Residual (WRMR) = 1.57 (Table 3). Table 3 depicts statistical goodness-of-fit test results for our general model and in males and females. Both models in female and male subpopulations were adequate based on various statistical fit results. The unemployment indicator had a negative variance residual, but it was left in the model considering the importance within the latent factor, place-based stressors. All the relationships in the model were statistically significant at a p < 0.05 level, with the exception of the psychosocial stress latent factor directly affecting allostatic load; this was not significant but was kept in the model based on established evidence of their relationship. Detailed parameter coefficients and Y and X standardized estimates in the general model are presented in Table 1. The results for the sub-models that apply to females and males appear in Tables 2 and 3, respectively.
Both environmental exposures investigated in the study had a positive, statistically significant relationship with the individual allostatic load score. Area cancer risk was found to affect allostatic load through two indirect pathways, one through placed-based stressors and disadvantage factors, and the other via placed-based stressors, disadvantage and psychosocial stressors, which acted as modulators of the effect on allostatic load. For one standard deviation increase in area cancer risk, the allostatic load increases 0.05 standard deviations, noting that the most influential path linking cancer risk to allostatic load is through mediating effects of placed-based stressors and disadvantage latent factors (STDYX estimate = 0.05, p < 0.001). No direct effect was found for area cancer risk on allostatic load score.
PM2.5 area concentrations, on the other hand, had direct and indirect effects on allostatic load. The direct effect was statistically significant (p < 0.05), suggesting a 0.06 standard deviation increase in allostatic load for each standard deviation increase in PM2.5 exposure concentration. Indirect effects mediated by disadvantage were statistically significant (STDYX = 0.018, p < 0.05) but smaller in comparison with the direct effect and, as such, contributed less to the total effects (STDYX = 0.078, p < 0.05) which incorporate both direct and indirect effects. The standardized coefficients for the full model are shown in Figure 1 and Table 1. Table 5 shows the goodness of fit metrics.
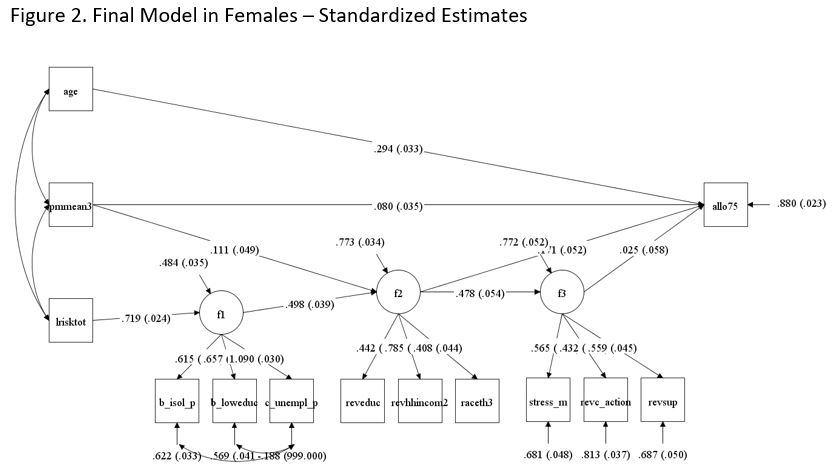
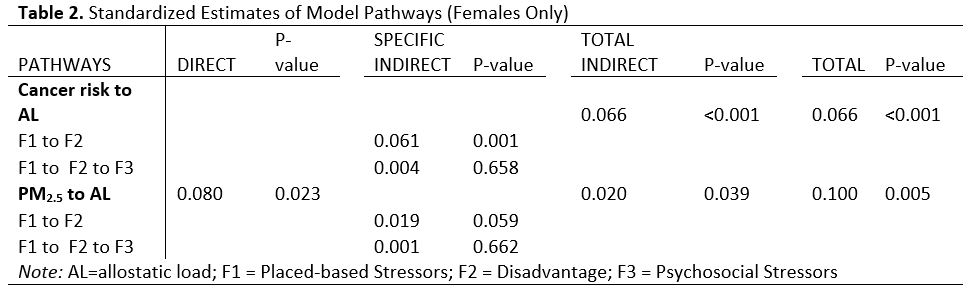
Stratified models by sex depicted a different picture for males and females. The final Model for females showed the same direction of relationships between area air pollutants and individual allostatic load, as well as the same pathways with greater effect and statistical significance that we observed in the overall model. The magnitude of the effects, though, were greater than in the overall model. One standard deviation increase in area cancer risk yielded 0.07 standard deviations increase in allostatic load score through indirect pathways (STDYX = 0.053 in overall model); while one standard deviation increase in area PM2.5 concentrations translated into 0.08 standard deviations increase in allostatic load score through a direct pathway (STDYX = 0.059 in the overall model) and 0.1 through all pathways (STDYX = 0.08 in overall model). These results are shown in Figure 2 and Table 2.
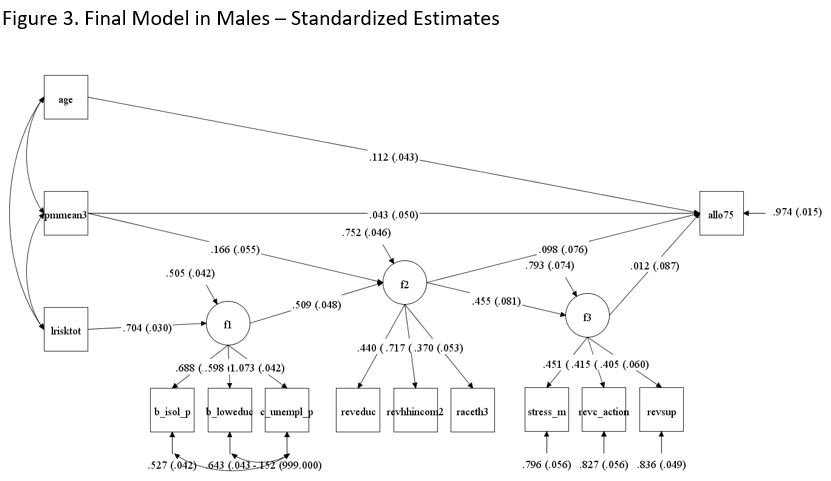
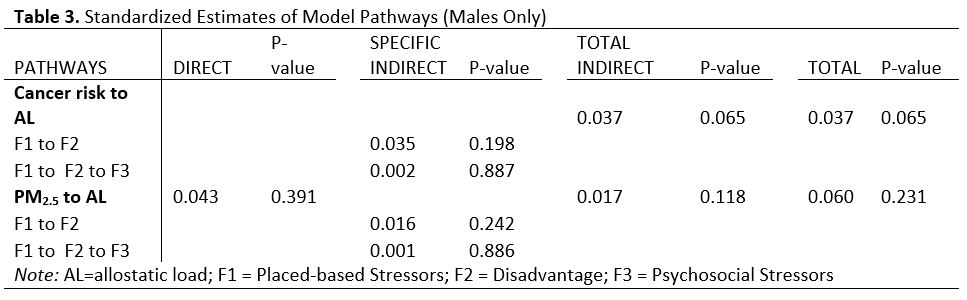
In contrast with the stratified model in females, the model in males showed that nonetheless the directionality of the associations was preserved, the effects magnitude was smaller compared to those in females, and they were not statistically significant at p < 0.05. The standardized estimate of total indirect effects of cancer risk to allostatic load was 0.037 (p = 0.07), which is smaller compared to the overall study population as well as the group of females. Standardized estimates of direct and total effects of PM2.5 were also smaller compared to entire study population and female subgroup, 0.043 (p = 0.34) and 0.6 (p = 0.23) respectively. Figure 3 and Table 3 provide the detailed estimates.
DISCUSSION
Our results suggest that proxies for ambient chemical exposures can show a direct, unmediated effect on physiological indicators of biologic stress. This is consistent with other findings in the literature. However, we were not able to combine these indicators since they did not co-vary, at least in the Texas City case, which contains only six census tracts and as such only six point estimates of air pollutants. This advises against the use of composite pollution measures that combine indicators for robustness. We found that combinations of pollutant indicators actually compounded measurement error. The pattern of variation in our indicators was sensitive to the spatial location of the sampled households and not consistent across different measures, complicating our attempts to treat them jointly. For example, PM2.5 annual concentrations were higher in the northwestern part of Texas City which borders major roads used by heavy-duty vehicles, possibly due to diesel exhaust contributing in PM concentration as well as prevailing Texas Gulf Coast area winds which carry the pollutants across the area. Cancer risk on the other hand was concentrated in census tracts bordering the petrochemical refineries in the southern part of the city. Although notions of cumulative risk, based on the stress-exposure model, suggest that pollutant exposures have a greater overall effect on total stress by compounding psychological stress, our results point away toward the intermediate effect on disadvantage as the key to capturing the underlying contribution of chemical stressors. Nevertheless, the direct effects of our pollutant measures were far more potent than the indirect effects.
Secondly, when considering the joint effect of non-chemical stressors, disadvantage played a larger role than psychosocial stressors, and when combined with individual chemical stressors, the joint effect with disadvantage also outweighed any influence coming through psychosocial factors. This offers a challenge to the conventional models that pose psychosocial factors as a key stress mediator. Our results suggest that the individual’s experience of stress, or relative resilience in its face coupled with social support has far less impact in physiological terms than does the damage done by disadvantage and individual chemical exposures to hazardous air pollutants and fine PM, both acting alone and in concert.
Thirdly, the fact that the overall effects and fit of the model were stronger for females may be a by-product of a different range of allostatic load scores in men than in women, at least for Texas City. Stratifying by sex actually strengthened the relationships we observed for the total population, largely by widening the variation in allostatic load. This points to the importance of having a physiological measure as a proxy for adverse health effects, rather than relying on morbidity rates or self-reported health status.
Finally, the notion of indirect effects offers an opportunity to model impact relations that are neither mediating ones (i.e., showing an interaction effect) nor joint (i.e., a cofactor effect). Instead, the model captures overall effects that are transmitted through a chain of tandem effects, as in a systems model, even though the empirical measures may be cross-sectional. This advantage is costly, however. One needs to estimate a set of equations for each indirect effect rather than relying on only one equation to capture the total effect of all of the independent variables of interest. When considering the magnitude of the effects, our results showed small effects as all the standardized path coefficients were less than 0.1.
The current study covered a relatively small geographic area (about 60 square miles) containing 6 census tracts and 3 air pollution monitors. Having the air pollutants estimates at a census tract level translated in reduced variability in their concentrations which not only could conceal the strength of the associations but also posed difficulties in exploring the multilevel component of the proposed analysis. The initial theoretical model was far more complex than what the data could support, which suggests that a preliminary analysis with the specified model would have highlighted these difficulties beforehand and saved project time. Also the number of individuals with biomarker measurements was not large and the missing values in various measures and indicators further reduced the study sample size.
We were not able to use the upset events (Table 1) data due to lack of modeling capabilities. Although establishing a temporal association between the upset event occurrence and allostatic load would have been challenging, they constitute an acute exposure comparable to those occupational ones that would have improved the accuracy of assessing exposure to the air pollutants. We were not able to include exposure to other criteria pollutants due to lack of the modeled data at the census tract level.
We did not test the correlation between measuring errors of indicators of latent variables as this might affect the structural parameter of relationship between the exogenous latent variable and outcome. Lack of association between the latent variable of psychosocial stress and allostatic load could also be due to how it was defined in our study. Our selection was guided by the data availability which might not reflect other characterizations of psychological stress, something that can be more carefully constructed in the future. The other latent variables of disadvantage and place-based stressors suffer from the same limitations, meaning our construct is not necessarily the most comprehensive. The grouping of social determinants of health under latent factors is a method that deserves further attention, especially in establishing if there are advantages compared to more traditional ways of using them to construct indices.
Conclusions:
The empirical work in health disparities and environmental justice in community settings has favored two kinds of studies. One is the scoping study that can lead to the identification of pollution "hot spots" that appear in areas where other social and economic disadvantages are concentrated. These tend to be observational studies that rely on a wide range of indicators drawn from secondary sources. Typically, levels of pollution are examined by categories of social disadvantage across geographic divisions, and areas of disproportionate burdens are identified for remedial action. The second kind is the modeling study that considers how social factors mediate the connection between pollution exposure and attributable health effects. Disadvantage is expected to magnify the health effects of exposures, all other things being equal. Neither of these study approaches attempt to examine the underlying pathways by which these effects are transmitted. Neither can separate the proxy measures used from the construct being measured. Neither aim for an optimal fit of all of the putative pathways to the empirical data. Our study does all three and generates results that offer a different construction of the mechanisms at work. We are also able to eliminate candidate pathways and poorly fitting measures as part of the process of model refinement. In short, the logic is different and more thoroughly tested, and our estimates present an alternative set of metrics for defining cumulative risks.
To our knowledge, structural equation modeling has not been successfully applied to the task of developing new models and metrics for cumulative risk. From that perspective, the STAR Award permitted us a period of experimentation with this approach. We believe it holds some promise as an alternative modeling strategy but extracts a high cost in time and effort when coupled with local community data. Any success with this approach is supremely sensitive to the quality of available data; this includes its distributional properties as well as its inherent variability. We underestimated this key factor, and it kept us from completing Goal 3 as mentioned above.
The U.S. EPA's efforts to devise tools for community risk assessment that can provide guidance for local remediation efforts have embraced cumulative risk notions but also have outpaced empirical advances in relevant models and metrics. Our research is best viewed as a foray into this less developed and rarely visited territory. The iterative, trial-and-error character of progress in this area takes some fortitude, since the advances are small and costly. Moreover, most of the findings along the way point to error and data limitations rather than to solid, evidentiary claims. Still, there is much to be gained from this methodical approach that places so much emphasis on measurement and opens the door to unconventional tandem effects that tend to be overlooked by other modeling strategies. The practical applications are principally through the more precise estimation of cumulative risks. A successful structural equation model provides the parameters necessary to identify paths across distinct categories of indicators—chemical and non-chemical—weighing their relative contribution, and supporting their aggregation into a single metric based on total effects. We turn to this task now.
References:
-
Rabe-Hesketh S, Skrondal A. Multilevel and Longitudinal Modeling Using Stata, Second Edition. Stata Press, 2005.
-
Muthén LK, Muthén BO. Mplus User's Guide. Sixth Edition. Los Angeles, CA: Muthén & Muthén, 1998-2011.
Journal Articles on this Report : 2 Displayed | Download in RIS Format
| Other project views: | All 17 publications | 17 publications in selected types | All 17 journal articles |
|---|
| Type | Citation | ||
|---|---|---|---|
|
|
Payne-Sturges DC, Korfmacher KS, Cory-Slechta DA, Jimenez M, Symanski E, Carr Shmool JL, Dotson-Newman O, Cloughtery JE, French R, Levy JI, Laumbach R, Rodgers K, Bongiovanni R, Scammell MK. Engaging communities in research on cumulative risk and social stress-environment interactions: lessons learned from EPA's STAR Program. Environmental Justice 2015;8(6):203-212. |
R834580 (Final) R834576 (Final) R834577 (Final) R834578 (Final) R834579 (2014) R834579 (Final) R834581 (Final) R834582 (Final) |
Exit Exit Exit |
|
|
Sexton K. Cumulative health risk assessment: finding new ideas and escaping from the old ones. Human and Ecological Risk Assessment: An International Journal 2015;21(4):934-951. |
R834580 (Final) |
Exit |
Progress and Final Reports:
Original AbstractThe perspectives, information and conclusions conveyed in research project abstracts, progress reports, final reports, journal abstracts and journal publications convey the viewpoints of the principal investigator and may not represent the views and policies of ORD and EPA. Conclusions drawn by the principal investigators have not been reviewed by the Agency.