
Grantee Research Project Results
Final Report: Consequences of Global Climate Change for Stream Biodiversity and Implications for theApplication and Interpretation of Biological Indicators of Aquatic Ecosystem Condition
EPA Grant Number: R834186Title: Consequences of Global Climate Change for Stream Biodiversity and Implications for theApplication and Interpretation of Biological Indicators of Aquatic Ecosystem Condition
Investigators: Hawkins, Charles P. , Tarboton, David G. , Jin, Jiming
Institution: Utah State University
EPA Project Officer: Packard, Benjamin H
Project Period: September 1, 2009 through August 31, 2012 (Extended to July 31, 2013)
Project Amount: $789,532
RFA: Consequences of Global Change for Water Quality (2008) RFA Text | Recipients Lists
Research Category: Aquatic Ecosystems , Ecological Indicators/Assessment/Restoration , Watersheds , Water , Climate Change
Objective:
The main objective of our proposed research is to assess how changes in stream temperature and hydrology associated with global/regional climate change will influence (1) site- and regional-scale biodiversity of stream ecosystems, and (2) the performance and interpretation of biological indicators, which are used to determine if streams are meeting the biological water quality goals of the Clean Water Act.
Summary/Accomplishments (Outputs/Outcomes):
The challenge in assessing how stream biodiversity will respond to climate change involves linking several models that make realistic predictions about future climate change, stream temperature response to climate, stream flow response to climate, and invertebrate response to temperature and flow, respectively. We therefore developed downscaled climate models to predict future climate conditions, stream temperature and stream flow models that use climate conditions as predictors, and species distribution models (SDMs) that predict how the distributions of individual taxa and entire assemblages of taxa vary with stream temperature, flow, and other watershed attributes (Fig. 1). We describe each of these modeling efforts below.
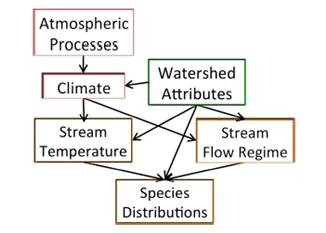
Figure 1. Conceptual diagram showing linkages between
atmospheric processes, climate, stream temperature,
flow regime, and species distribution models. Watershed
attributes are assumed to be time invariant but potentially
interact with climate sensitive processes.
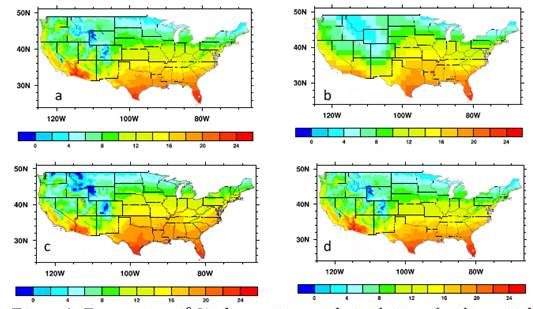
Figure 2. Temperature (°C) observations and simulations for the period of 1969 - 1999.
a) PRISM observations and 4 km resolution; b) the CCSM simulations at 150 km resolution;
c) WRF simulations at 50 km resolution forced with the biased corrected CCSM data; d) the
statistically downscaled WRF simulations at 4 km resolution.
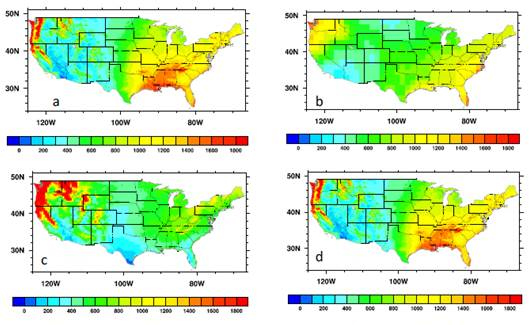
Figure 3. Precipitation (mm/year) observation and simulations for the period 1969 - 1999. a)
PRISM observation at 4-km resolution; b) the CCSM simulations at 150-km resolution. c) WRF
simulations at 50-km resolution forced with the biased corrected CCSM data; d) the statistically
downscaled WRF simulations 4-km resolution.
These simulations showed that we were able to realistically reproduce the historical climate for the CONUS through the combination of the dynamic and statistical downscaling techniques, which provided confidence that we could generate realistic, high-resolution future forecasts. We produced climate forecasts for the CONUS for two 10-year periods (2001-2010 and 2090-2099) based on the original CCSM and the downscaled data and calculated the differences in temperature and precipitation expected to occur between these two periods for both modeling approaches (Fig. 4). Our results indicate that the original CCSM data predicted that the strongest warming would occur in the West and that CONUS-wide mean air temperature would increase by 3.7°C by the end of the century. However, our downscaled forecasts predicted that mean air temperature will increase by 2.5°C across the entire CONUS with the most significant warming occurring in northern and eastern regions of the CONUS. Spatial patterns in predicted changes in precipitation differed from those for temperature. The CCSM predicted that precipitation would increase by the end of the century mostly in the eastern part of the CONUS and would decrease in the western part of the CONUS. Over the entire CONUS, the CCSM predicted mean precipitation to increase by 8 mm/year. Downscaled forecasts showed increased precipitation in most areas of the eastern United States, the central Midwest, and high mountains of the West and decreased precipitation in the other areas of the CONUS such as west coast states, Arizona, and Montana. Downscaling indicated that mean CONUS-wide precipitation is expected to decrease by 66 mm/year by the end of the century.
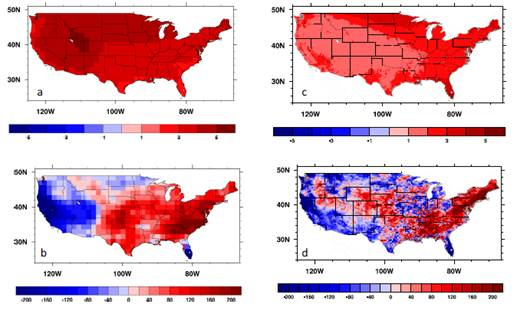
Figure 4. Original (150 km resolution) and downscaled (4 km resolution) CCSM temperature
(°C) and precipitation (mm/year) differences between the period of 2090 - 2099 and 2001 - 2010.
a) original CCSM temperature; v) CCSM precipitation; c) downscaled temperature; d) downscaled
precipitation
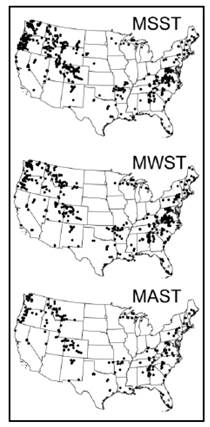
Figure 5. Distribution of mean summer
(MSST), mean winter (MWST), and mean
annual stream temperature sites (MAST).
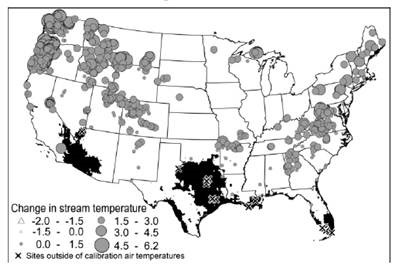
Figure 6. Spacial variability in MSST vulnerability to CC. Black regions
and Xs represent zones outside of the experience of the ST model.
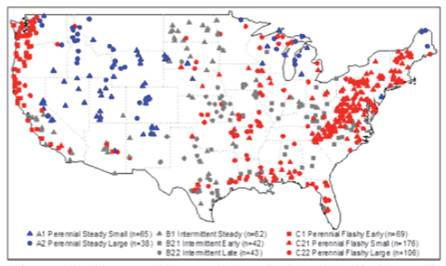
Figure 7. Geographic variation in the distribution of streams assigned to
different stream flow regime classes.
| Predicted | ||||||||||
|---|---|---|---|---|---|---|---|---|---|---|
 | A1 | A2 | B1 | B21 | B22 | C1 | C21 | C22 | Class Error | |
| A1 | 54 | 2 | 1 | 7 | 1 | 17% | ||||
| A2 | 4 | 28 | 6 | 26% | ||||||
| B1 | 3 | 36 | 3 | 8 | 4 | 5 | 3 | 42% | ||
| B21 | 1 | 24 | 3 | 1 | 11 | 2 | 43% | |||
| B22 | 1 | 1 | 33 | 2 | 6 | 23% | ||||
| C1 | 6 | 1 | 54 | 3 | 5 | 22% | ||||
| C21 | 5 | 4 | 1 | 2 | 151 | 13 | 14% | |||
| C22 | 4 | 3 | 5 | 2 | 3 | 5 | 14 | 70 | 34% | |
Table 1. Classification matrix showing class-specific predition errors by the Random Forest
model. The shaded diagonal cells show correct predictions.
| Predicted | ||||||||||
|---|---|---|---|---|---|---|---|---|---|---|
| A1 | A2 | B1 | B21 | B22 | C1 | C21 | C22 | Class Error | |
| A1 | 54 | 2 | 1 | 7 | 1 | 17% | ||||
| A2 | 4 | 28 | 6 | 26% | ||||||
| B1 | 3 | 36 | 3 | 8 | 4 | 5 | 3 | 42% | ||
| B21 | 1 | 24 | 3 | 1 | 11 | 2 | 43% | |||
| B22 | 1 | 1 | 33 | 2 | 6 | 23% | ||||
| C1 | 6 | 1 | 54 | 3 | 5 | 22% | ||||
| C21 | 5 | 4 | 1 | 2 | 151 | 13 | 14% | |||
| C22 | 4 | 3 | 5 | 2 | 3 | 5 | 14 | 70 | 34% | |
model. The shade ddiagonal cells show correct predictions
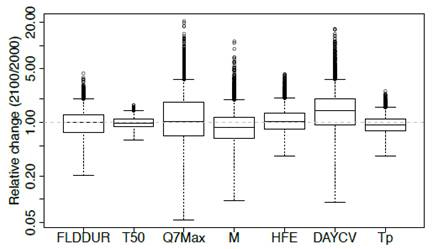
Figure 8. Relative change in 7 flow variables related to invertebrate biodiversity
(FLDDUR - flood duration, T50 = day of water year at which 50% of cumulative
flow occurs, Q7Max = mean 7 day maximum flow, M = contingency, HFE = number
of high-flow events, DAYCV = foefficient of variation in mean daily discharge,
Tp = day of water year at which peak flow occurs).
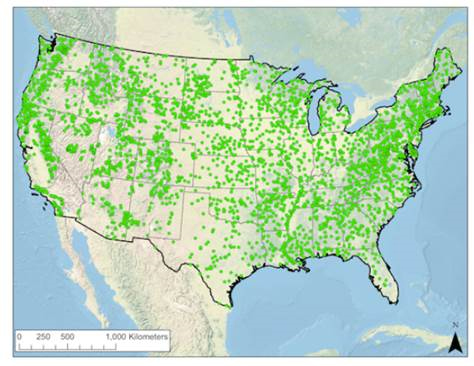
Figure 9. Locations of 3,806 NRSA sites used to project how invertebrate
biodiversity is likely to respond climate change.
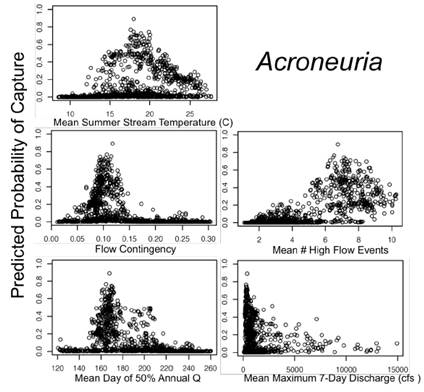
Figure 10. Example of how predicted probabilities of capture of an individual
tax (the stonefly Acroneuria) vary across the 3,806 NRSA sites in relation to
5 climate-sensitive environmental variables.
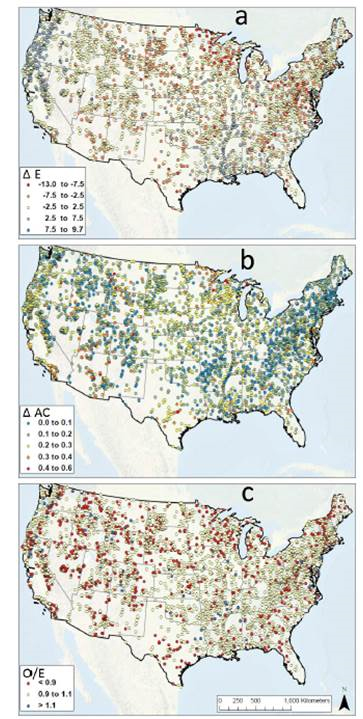
Figure 11. Geographic variation in (a) predicted climate-induced
changes in invertebrate taxonomic riches (E), (b) assemblage
composition (AC) and (c) O/E index values. Predictions are
for 2100.
Conclusions:
Our results indicate that projected climate change by the end of the century (2100) is expected to have substantial effects on the thermal and hydrologic regimes of stream ecosystems and that these thermal and hydrologic changes will affect both local (site) and regional biodiversity. Effects will not be uniform across the CONUS though, and some sites and regions will be much more vulnerable to climate change than other sites and regions. The magnitude and variability of changes in biodiversity will substantially affect the interpretation of currently used indices of biological condition.
Journal Articles on this Report : 11 Displayed | Download in RIS Format
| Other project views: | All 73 publications | 14 publications in selected types | All 12 journal articles |
|---|
| Type | Citation | ||
|---|---|---|---|
|
|
Deng B, Liu S, Xiao W, Wang W, Jin J, Lee X. Evaluation of the CLM4 Lake Model at a large and shallow freshwater lake. Journal of Hydrometeorology 2013;14(2):636-649. |
R834186 (2012) R834186 (Final) |
Exit Exit Exit |
|
|
Gu H, Jin J, Wu Y, Ek MB, Subin ZM. Calibration and validation of lake surface temperature simulations with the coupled WRF-lake model. Climatic Change 2015;129(3-4):471-483. |
R834186 (Final) |
Exit Exit |
|
|
Hill RA, Hawkins CP, Carlisle DM. Predicting thermal reference conditions for USA streams and rivers. Freshwater Science 2013;32(1):39-55. |
R834186 (2011) R834186 (2012) R834186 (Final) |
Exit Exit Exit |
|
|
Hill RA, Hawkins CP, Jin J. Predicting thermal vulnerability of stream and river ecosystems to climate change. Climatic Change 2014;125(3-4):399-412. |
R834186 (Final) |
Exit |
|
|
Hill RA, Hawkins CP. Using modelled stream temperatures to predict macro-spatial patterns of stream invertebrate biodiversity. Freshwater Biology 2014;59(12):2632-2644. |
R834186 (Final) |
Exit Exit |
|
|
Jin J, Miller NL. Improvement of snowpack simulations in a regional climate model. Hydrological Processes 2011;25(14):2202-2210. |
R834186 (2010) R834186 (2011) R834186 (2012) R834186 (Final) |
Exit Exit |
|
|
Jin J, Miller NL. Regional simulations to quantify land use change and irrigation impacts on hydroclimate in the California Central Valley. Theoretical and Applied Climatology 2011;104(3-4):429-442. |
R834186 (2010) R834186 (2011) R834186 (2012) R834186 (Final) |
Exit Exit Exit |
|
|
Jin J, Wen L. Evaluation of snowmelt simulation in the Weather Research and Forecasting model. Journal of Geophysical Research-Atmospheres 2012;117(D10):D10110 (16 pp.). |
R834186 (2011) R834186 (2012) R834186 (Final) |
Exit Exit Exit |
|
|
Li L, Li W, Jin J. Improvements in WRF simulation skills of southeastern United States summer rainfall:physical parameterization and horizontal resolution. Climate Dynamics 2014;43(7-8):2077-2091. |
R834186 (Final) |
Exit |
|
|
Liao X, Liu Z, Wang Y, Jin J. Spatiotemporal variation in the microclimatic edge effect between wetland and farmland. Journal of Geophysical Research-Atmospheres 2013;118(14):7640-7650. |
R834186 (Final) |
Exit Exit Exit |
|
|
Zhao L, Jin J, Wang S-Y, Ek MB. Integration of remote-sensing data with WRF to improve lake-effect precipitation simulations over the Great Lakes region. Journal of Geophysical Research-Atmospheres 2012;117(D9):D09102 (12 pp.). |
R834186 (2011) R834186 (2012) R834186 (Final) |
Exit Exit Exit |
Supplemental Keywords:
EPA Regions 1-10, thermal modification, hydrologic modification, modeling, biological indicators, biological assessment, biological integrity, air, RFA, climate change, air pollution effects, atmosphere, RFA, Air, Atmosphere, Air Pollution Effects, climate changeProgress and Final Reports:
Original AbstractThe perspectives, information and conclusions conveyed in research project abstracts, progress reports, final reports, journal abstracts and journal publications convey the viewpoints of the principal investigator and may not represent the views and policies of ORD and EPA. Conclusions drawn by the principal investigators have not been reviewed by the Agency.