
Grantee Research Project Results
2007 Progress Report: The Impact of Aerosols, Clouds, and Ozone on Surface UV and Photochemistry in Houston, TX
EPA Grant Number: R833225Title: The Impact of Aerosols, Clouds, and Ozone on Surface UV and Photochemistry in Houston, TX
Investigators: Lefer, Barry , Slusser, James
Current Investigators: Lefer, Barry , Slusser, James , Byun, Daewon , Rappenglueck, Bernhard , Chellam, Shankar
Institution: University of Houston , Colorado State University
EPA Project Officer: Chung, Serena
Project Period: March 15, 2007 through March 14, 2009 (Extended to March 14, 2011)
Project Period Covered by this Report: September 1, 2006 through August 31,2007
Project Amount: $292,310
RFA: Implications of Tropospheric Air Pollution for Surface UV Exposures (2005) RFA Text | Recipients Lists
Research Category: Air Quality and Air Toxics , Air , Climate Change
Objective:
To examine how changes in tropospheric pollution affect surface UV levels and ozone photochemistry. In addition we will investigate the impact of clouds surface UV and ozone photochemistry. Finally, we are interested in how changes in surface UV due tropospheric pollution compare to those cause by variations in the total column ozone. Based on our previous measurements in Houston from the TexAQS-2000 experiment, we hypothesize that significant reductions in surface UV levels occur in Houston due to tropospheric pollution, primarily from the absorption of UV radiation by aerosols. And that the combined effect of tropospheric pollution and clouds are to significantly suppress photochemical ozone formation in Houston. We predict that changes in UV levels due to tropospheric pollution are of similar magnitude compared to those from total ozone column changes.
Progress Summary:
Work status:
The UH-Atmospheric Radiation tower facility in Houston has made use a suite of solar instruments to measure total and diffuse solar UV irradiance at multiple wavelengths with a UV multiple filter rotating shadowband radiometers (UV-MFR and MFR). In addition, the direct solar beam irradiance at multiple wavelengths was monitored with a CIMEL sunphotometer and an EPA single pass Brewer spectrometer. The solar UV actinic flux density was measured with an NCAR scanning double actinic flux spectroradiometer (SAFS) during intensive field operations and with a diode array actinic flux spectrograph (Metcon USA) continuously. A Total Sky Imager (YES Inc) and/or a hemispheric field of view Skycam (Metcon USA) were be used to continuously document cloud cover. The data from this suite of instruments was used to calculate aerosol optical depth, aerosol single scattering albedo, overhead ozone column, and 23 different photolysis frequencies. The NCAR TUV radiative transfer model was used to compare the measurements to estimates of the cloud free and background aerosol conditions. The NASA time dependent photochemical box model was used to examine the impact the changes in surface UV on ozone photochemistry, particularly during the intensive monitoring periods.
A 1-year database of surface UV radiation measurements, atmospheric composition, meteorological data, and sky condition has been compiled and will be used to examine the relative importance of aerosols, clouds, and ozone on surface UV levels and ozone photochemistry in Houston.
Work progress: There are a few data gaps for minor problems and instrument calibrations, but overall, we have been fortunate that the measurements have proceeded quite well with only minimal data loss due to instrument failures or malfunctions. The data analysis of the intensive TexAQS II period has resulted in several papers but the analysis and modeling of the entire year of data is still in the early stages. Most of the primary data is archived at one of the following websites:
UH Moody Tower CIMEL Data: http://aeronet.gsfc.nasa.gov/
UH Moody Tower Brewer Data: http://www.esrl.noaa.gov/gmd/grad/neubrew/
UH Moody Tower UV-B and VIS Data: http://uvb.nrel.colostate.edu/UVB/
UH Moody Tower Ozone, Meteorological, and All Sky Images: http://www.hnet.uh.edu/
UH Moody Tower TexAQS II Photochemical Dataset: http://geossun2.geosc.uh.edu/web/blefer/TRAMP/Final%20data/
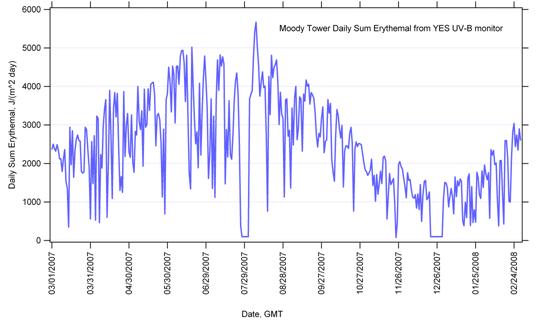
Results to Date: Data for this project includes UV irradiance measurements made by the USDA UVB-1 (YES Inc) and the NOAA EPA Brewer (NEUBrew). Both instruments show a seasonal trend directly correlated with solar zenith angle (Figures 1 and 2). The UVB-1 and Brewer instruments show similar values although the direct intercomparison of these instruments needs further investigation.
Figure 1. NEUBrew Daily UV Index and Sum Daily Erythema (kJ/m^2) for 3/1/2007 to 3/1/2008.
Figure 2. USDA UVB-1 Sum Daily Erythema (kJ/m^2) for 3/1/2007 to 3/1/2008.
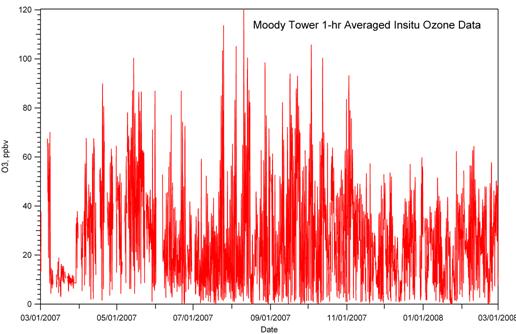
The various solar instruments at UH Moody Tower provide a comprehensive measure of solar radiation including spectrally resolved and integrated solar irradiance, direct solar beam, and actinic flux. This suite of solar UV measurements in combination with insitu (and total column) ozone data provide the information to evaluate the relationship between solar UV and boundary layer ozone mixing ratios (Figure 3).
Figure 3. In situ ozone mixing ratios measured at UH Moody Tower for 3/1/2007 to 3/1/2008.
The primary control on the UV radiation levels measured in Houston during this time period was the annual cycle in the stratospheric ozone layer. This annual cycle can clearly be seen in the UH Brewer total column measurements shown in Figure 4. A topic of future analysis it to examine the variability in the total ozone column and see how much of the relatively large day to day changes can be explained by surface layer ozone events. We can test this analysis by using the two independent measures of the ozone vertical profile, the UH/Valparasio ozonesondes and the vertical profiles of ozone retrieved from the Umkehr measurements performed by the Brewer during sunrise and sunset elevations between 90-70 solar zenith angle. Between March 2007 and March 2008, approximately 43 ozonesondes were launched from UH Campus, this data is available from http://www.ruf.rice.edu/~ozone/ourdata.htm, and http://www.imaqs.uh.edu/ozone/ourdata.htm.
Figure 4. Total column ozone from Brewer 154 and OMI satellite for 3/1/2007 to 3/1/2008.
It is important to note the limitations in the two different ozone profiling measurements. The ozonesonde balloon usually pops at an altitude between 25 and 30 km, usually at or above the peak in the stratospheric ozone layer. This means it does not get a complete measure of the total ozone column, but give excellent data of the ozone profile. Ozonesondes are fairly expensive and labor intensive, so we only have 40 some profiles per year. The Brewer tries to acquire an Umkehr ozone profile each sunrise and sunset. This retrieval is often not successful during cloudy and/or rainy periods. A successful morning and/or afternoon ozone profile was retrieved from Brewer 154 in Houston approximately 30 days in 2007 and 70 days in 2008 (see http://www.esrl.noaa.gov/gmd/grad/neubrew/O3ProfileDataMap.jsp to access the Brewer vertical profiles). An example of the ozone profile retrieved from Brewer 154 for May 17th, 2007 is shown in Figure 5. Note significant differences in the boundary layer and stratospheric ozone layer ozone amounts. Clearly the stratospheric ozone layer did not change that much during this 12 hour period. There was a significant amount of boundary layer ozone on this date which may have complicated the afternoon retrieval.
Figure 5. Retrieved sunrise (AM) and sunset (PM) Brewer ozone profiles from Brewer 154 along with A-Priori profiles in the retrieval algorithm.
To help evaluate the accuracy of the Brewer ozone profile is useful to compare the Brewer and Ozonesonde ozone profiles on the days were we have data from both systems. An example of this comparison is shown in Figure 6. The afternoon ozonesonde agrees fairly well with the afternoon Brewer ozone profile retrieval. There is no way the Brewer Umkehr retrieval can resolve the fine structure in the ozone profile but it the general agreement in the altitudes of the ozone tropopause and stratospheric ozone peak is encouraging (Figure 6).
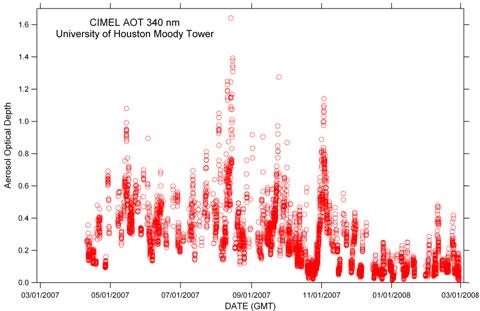
Changes in aerosol optical depth will play a relatively minor role compared to both clouds and the ozone layer in moderating the UV levels at the surface. However given that Houston is a polluted urban environment it is likely a good place to try to determine the relative importance of aerosol absorption and scattering on UV levels. Measurements of aerosol optical depth were retrieved from both the CIMEL and USDA UV and VIS rotating shadowband radiometers. Both datasets are available online at http://aeronet.gsfc.nasa.gov/ and http://uvb.nrel.colostate.edu/UVB/ , respectively. The UV aerosol optical depths calculated from the CIMEL direct solar beam measurements at 340 nm for the period March 2007-March 2008 (Figure 7) reveal significantly lower background aerosol optical depths and fewer and smaller aerosol “events” during winter (January – March 2008) in Houston. The majority of the high aerosol events are late summer and early fall.
Figure 6. Ozone profiles from both Brewer and Ozonesonde instruments for 28 June 2007. The ozonesonde was launched at 1:10 PM balloon popped at 2:51 PM, local daylight time.
Figure 7. UV aerosol optical thickness (AOT) at 340 nm from the UH CIMEL sunphotomter at the Moody Tower for 3/1/2007 to 3/1/2008.
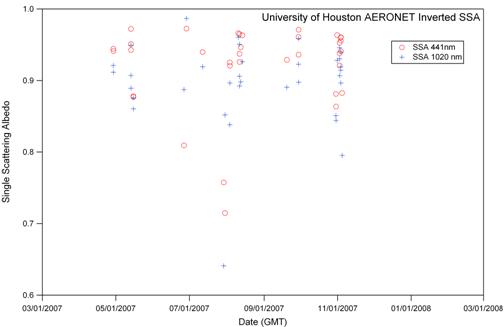
Interestingly, late summer and early fall is when Houston typically has the highest boundary layer ozone values. The total column ozone levels are slightly below median annual levels during this same time period (Figure 4). Both the CIMEL at USDA UV science teams attempt to retrieve single scattering albedo (SSA) from a combination of their direct and/or indirect measurements of solar irradiance. These retrieval methods do not have a high success rate but the reveal that at 441 nm the aerosol in Houston can have a SSA ranging from 0.97 to 0.72 with the majority of the data greater than 0.9 (Figure 8). Future work will compare the SSA measurements from these instruments and examine the wavelength dependence of the SSA.
Figure 8. Aerosol single scattering albedo (SSA) at 441 nm and 1020 nm from the UH CIMEL sunphotomter at the Moody Tower for 3/1/2007 to 3/1/2008.
Comparisons of accomplishments with original goals and objectives: Original goal of collecting spectrally resolved UV and VIS solar radiation measurements at with multiple instruments and chemical measurements of ozone and ozone precursors for a 12-month period has been very successful. One instrument, the scanning actinic flux spectroradiometer has given us some difficulties, please see Section 5: Difficulties Encountered for more information. The analysis of this vast dataset has been quite challenging and is still in the early stages.
Difficulties encountered: The primary data collection difficulty has been to keep the scanning actinic flux spectroradiometer (SAFS) operational for extended periods of time. The SAFS instrument has several moving parts that are not designed for continuously work. Previous deployments of the SAFS instrument have been for 6 to 8 weeks. Recognizing this limitation early in the project, UH purchased a Diode Array Actinic Flux Spectroradiometer (DAFS) with funds from Dr. Lefer’s startup package. The DAFS instrument has the advantage of a solid state detector that is quite stable and no moving parts. The significant drawbacks of a diode array detector are reduced UV sensitivity, larger straylight in the UV-B, and a degradation of the FWHM resolution from 1 nm to 1.8 nm. The reduced UV sensitivity has been addressed by using multiple integration times of 0.25, 1, and 5 seconds. Piecing together these 3 scans results in a full UV-VIS spectrum from 295-700 nm acquired every 10 seconds.
The straylight correction is required because the DAFS instrument is a single monochromator compared to the SAFS double monochromator. The primary method of straylight correction was to compare actinic flux spectra collected by both SAFS and DAFS at the same time. And with some help form the ARIM group at NCAR/ACD the UH group has modified their calibration methods to include calibrations with a cutoff filter. Since the primary use of the actinic flux data is to calculate integrated photolysis frequencies. The additional error associated with the 1.8 nm resolution is small compared to the uncertainty in the molecular absorption cross sections and quantum yields. Using the DAFS fulltime and periodically comparing it the SAFS has allowed us to acquire high quality nearly continuous actinic flux data.
Modification of Aims: No modification of aims required.
Absence of changes of key personnel: No changes in key personnel.
Quality assurance status: Quality of measurements in continually assured by regular calibrations for different instruments all traced back to NIST-traceable calibration standards. Most of the radiation sensors have an annual calibration. The Brewer instrument had an extra calibration by the The Canadian Ozone and Ultraviolet Measurement Program. The actinic flux solar spectra are also compared to standard solar features, typically the fraunhoffer lines, to check for any drift in the wavelength assignment. Ozone and other air quality instruments (NO, NO2, CO, etc) are routinely calibrated on daily to weekly cycles.
Future Activities:
We also hope this research will provide data useful to the air quality forecast community whose models currently do not have adequate cloud and tropospheric pollution feedbacks.
Journal Articles on this Report : 3 Displayed | Download in RIS Format
| Other project views: | All 38 publications | 33 publications in selected types | All 33 journal articles |
|---|
| Type | Citation | ||
|---|---|---|---|
|
|
Corr CA, Krotkov N, Madronich S, Slusser JR, Holben B, Gao W, Flynn J, Lefer B, Kreidenweis SM. Retrieval of aerosol single scattering albedo at ultraviolet wavelengths at the T1 site during MILAGRO. Atmospheric Chemistry and Physics Discussions 2009;9(15):5813-5827. |
R833225 (2007) |
Exit Exit |
|
|
Flynn J, Lefer B, Rappengluck B, Leuchner M, Perna R, Dibb J, Ziemba L, Anderson C, Stutz J, Brune W, Ren X, Mao J, Luke W, Olson J, Chen G, Crawford J. Impact of clouds and aerosols on ozone production in Southeast Texas. Atmospheric Environment 2010;44(33):4126-4133. |
R833225 (2007) R833225 (2008) R833225 (Final) |
Exit Exit |
|
|
Lefer B, Rappenglück B, Flynn J, Haman C. Photochemical and meteorlogical relationships during the Texas-II Radical and Aerosol Measurement Project (TRAMP). Atmospheric Environment 2010;44(33):4005-4013. |
R833225 (2007) R833225 (Final) |
Exit Exit Exit |
Progress and Final Reports:
Original AbstractThe perspectives, information and conclusions conveyed in research project abstracts, progress reports, final reports, journal abstracts and journal publications convey the viewpoints of the principal investigator and may not represent the views and policies of ORD and EPA. Conclusions drawn by the principal investigators have not been reviewed by the Agency.