
Grantee Research Project Results
Final Report: New Technologies for Source Apportionment
EPA Grant Number: R832157Title: New Technologies for Source Apportionment
Investigators: Henry, Ronald C. , Fine, Philip M.
Institution: University of Southern California
EPA Project Officer: Chung, Serena
Project Period: January 20, 2005 through January 19, 2008 (Extended to January 19, 2009)
Project Amount: $450,000
RFA: Source Apportionment of Particulate Matter (2004) RFA Text | Recipients Lists
Research Category: Particulate Matter , Air Quality and Air Toxics , Air
Objective:
The project will develop new receptor-oriented methods of source apportionment based on the source information in wind speed and direction and the periodic variations of concentrations as extracted from the data by nonparametric regression and Fourier analysis. These methods will be applied to airborne particulate and other air quality data sets nationwide. Also, the source apportionment aspects of a particulate health-effects study to be carried out in Long Beach, CA will be strengthened by additional analysis of particulate samples for organic and inorganic species funded by this project.
Summary/Accomplishments (Outputs/Outcomes):
Fine and Ultrafine Airborne Organic Particulate Analysis
One of the objectives of the proposed research was to determine the community-scale spatial variability of (1) the chemical nature of the PM and (2) the origin of the PM. To accomplish this objective, we used archived personal cascade impactor sampler (PCIS) filters that were collected at four locations in Long Beach, CA over 10 weeks during the winter of 2005. The PCIS collects three size ranges of particles: the 0-0.25 mm (quasi-ultrafine, hereafter referred to as ultrafine (UF) for convenience), 0.25-2.5 mm (accumulation (Acc)), and 2.5-10 mm (coarse (C)) size ranges (Singh et al., 2003). These archived PCIS filters were each collected over roughly one week, so in the end we had 120 samples (10 weeks x 4 sites x 3 size ranges). We used previously developed protocols to quantify 70+ organic species from each of these filters (Dutton et al., 2009). Using these speciation results, we employed a chemical mass balance approach similar to that described by Kleeman et al. (2009). Size-resolved source profiles are needed to successfully determine the source contributions. Literature values of sized source profiles do not match the size ranges collected herein. Thus we assumed that the chemical fingerprint for the important sources was not strongly dependent on size. Further, we did not have Long Beach specific motor vehicle fleet data so we used the same fleet information used by Kleeman et al., which had been generated for a broader California fleet. Using this approach, we over apportioned UF and Acc EC, or in other words we commonly accounted for ~ 200% of the EC mass. Our assumptions must be inappropriate, so we decided to dig deeper into the measurement data for source clues and spatial variability information. That analysis is summarized below and in Krudysz et al. (2009).
Several associations between the organic compounds, size fractions, and sites were observed in this data set. Across all sites, correlations were stronger for many compounds between UF and Acc size fractions, and weaker between concentrations in the C fraction and corresponding UF and Acc fractions. These results indicate that the coarse PM organic compounds were emitted by different sources than those emitting small particles, such as combustion sources. Associations between the same compounds in different size fractions, across all sites were performed to gain insight into the types of sources influencing the study sites. Results showed clear differences between size fractions, with stronger correlations within UF and Acc size fractions, compared to the C fraction. Differences between correlations within UF and Acc size fractions, specifically between steranes and n-alkanes, imply that steranes in the UF fraction are emitted from specific sources that may be different from the sources emitting n-alkanes. In the Acc particles, similar sources emit both steranes and n-alkanes or aging and atmospheric transformation of aerosols is responsible for the higher correlations. Organic compounds quantified in this study are more suitable for identification of sources that emit particles in the UF and Acc than C size fractions.
Strong correlations across all sites were observed between steranes in the UF and the ACC size fractions, and they were attributed to motor vehicle emissions. High correlations between some PAHs in the UF and Acc size fractions were indicative of emissions from poor spark-ignition combustion in gasoline-powered vehicles and incomplete combustion of gasoline derived from light duty gasoline vehicles.
Ratio-ratio plots were used to investigate the relative influence of similar sources on the molecular marker concentrations. Compounds in all three size fractions were shown to be impacted by two sources with unique emission rates. Hopanes associated with EC partition preferentially into the Acc fractions, indicating motor oil emissions as the main PM source, while EC not associated with motor oil, perhaps diesel vehicle tailpipe emissions, is found preferentially in the freshly emitted UF particles. This source hypothesis was further corroborated by the much higher EC/OC ratios in the UF compared to the Acc and C size fractions, whereas steranes were shown to be comparable in both the Acc and UF particles.
Spatial variability was assessed by comparing the same compounds from different sites within each size fraction. The coefficient of divergence values for organic species did not differ appreciably between size fractions or between compound classes, but comparatively high spatial divergence was observed for most species. The molecular tracers were more heterogeneous than OC but comparable to EC. Numerous sources contribute to OC concentrations resulting in relatively low spatial divergence, whereas EC, like the molecular tracers, originates mostly from traffic sources, which are more local and thus increase its spatial variability.
Conclusions:
Time Series Analysis
A major goal of this project is the characterization of the periodic variations in air quality and other environmental data since the existence of weekly or monthly periodicities is usually associated with anthropogenic sources. However, because of missing data and irregular sampling, standard methods of harmonic analysis cannot be applied to most air quality or environmental data in general. Building on the previous years work, the Lomb version of the Fourier Transform was used to estimate the power and phase in the major periodicities in the data and the first and second harmonics. This information characterizes, for most environmental time series, the shape and timing of the periodic behavior. A method to automatically classify and group species by the periodic behavior has been developed.
As periodic behavior will vary over a long time series, the sliding window Fourier Transform has been applied for the first time to environmental time series. Previously, application of the Lomb periodogram to a 13 year time series of 24 hour elemental carbon data from Washington DC found a strong 7-day periodicity peaking at midweek and having a minimum on the weekend. Figure 1 below shows the results of applying a sliding window Fourier Transform to this time series. The sliding window is 1 year wide and it slides by 30 days at each step. The figure shows that the power in the 7-day periodicity versus the date of the middle of the sliding window. The power in the 7-day periodicity varies greatly from year to year and completely disappears at times. This implies that major changes in the sources of elemental carbon affecting the monitor have occurred over the years. The presumed cause of this 7-day periodicity is weekly periodicity in heavy-duty diesel vehicle emissions; there are being fewer trucks on the road on weekends. Thus, the results seem to imply a change in the impact of diesel emissions over the years. Although, the changes in the power of 7-day periodicity could be caused by other sources of black carbon affecting the monitor. In any case, the sliding window Fourier Transform results imply major changes in the sources of elemental carbon near the monitor.
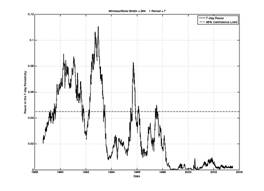
Figure 1. Sliding window Fourier-Lomb Transform of airborne black carbon time series from Washington DC.
Receptor Modeling
The new hybrid model uses back trajectories along with kernel smoothing methods to locate and quantify the sources of emissions on a local scale using short-term data2. This method is referred to as Nonparametric Trajectory Analysis (NTA). Wind speed and wind direction data from 29 monitoring sites throughout the South Coast Air Basin were used to calculate back trajectories. The concentration of the pollutant at the time of arrival at the monitor is associated with the points along the corresponding trajectory. For a suitably spaced grid of points, the expected value of the concentration associated with trajectories passing near the grid points is calculated by a nonparametric regression analysis method or kernel smoothing. The kernel function is usually a Gaussian and the smoothing results from a moving average using weights derived from the kernel. The result is a contour map with the average value of the concentration at the monitor given that the air passes over of near that part of the map. The only adjustable parameter in the analysis is the kernel smoothing parameter. If it is too small the results will be very lumpy and clearly under-smoothed, while if it is too large the result will be very broad regions with little variability and clearly over-smoothed. Generally, an appropriate smoothing parameter is chosen by trial and error, fortunately the results are not sensitive to small changes in the smoothing parameter. Some of the results seen are in Figure 2.
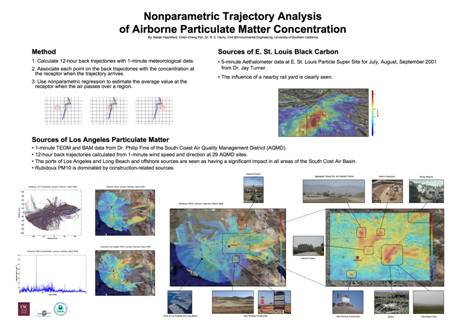
Figure 2. Sources of Los Angeles PM by Nonparametric Trajectory Analysis
References:
Journal Articles on this Report : 6 Displayed | Download in RIS Format
| Other project views: | All 15 publications | 6 publications in selected types | All 6 journal articles |
|---|
| Type | Citation | ||
|---|---|---|---|
|
|
Dilmaghani S, Henry IC, Soonthornnonda P, Christensen ER, Henry RC. Harmonic analysis of environmental time series with missing data or irregular sample spacing. Environmental Science & Technology 2007;41(20):7030-7038. |
R832157 (2005) R832157 (2007) R832157 (Final) |
Exit Exit Exit |
|
|
Henry RC. Locating and quantifying the impact of local sources of air pollution. Atmospheric Environment 2008;42(2):358-363. |
R832157 (2007) R832157 (Final) |
Exit Exit Exit |
|
|
Krudysz MA, Froines JR, Fine PM, Sioutas C. Intra-community spatial variation of size-fractionated PM mass, OC, EC, and trace elements in the Long Beach, CA area. Atmospheric Environment 2008;42(21):5374-5389. |
R832157 (2007) R832157 (Final) R832413 (2007) R832413 (2008) R832413 (Final) R832413C001 (2007) R832413C001 (Final) R832413C003 (2007) |
Exit Exit Exit |
|
|
Krudysz MA, Dutton SJ, Brinkman GL, Hannigan MP, Fine PM, Sioutas C, Froines JR. Intra-community spatial variation of size-fractionated organic compounds in Long Beach, California. Air Quality, Atmosphere & Health 2009;2(2):69-88. |
R832157 (Final) R832413 (2009) R832413 (Final) R832413C001 (2009) R832413C001 (Final) |
Exit Exit |
|
|
Krudysz M, Moore K, Geller M, Sioutas C, Froines J. Intra-community spatial variability of particulate matter size distributions in Southern California/Los Angeles. Atmospheric Chemistry and Physics 2009;9(3):1061-1075. |
R832157 (Final) R832413 (2008) R832413 (2009) R832413 (Final) R832413C001 (2009) R832413C001 (Final) |
Exit Exit |
|
|
Moore K, Krudysz M, Pakbin P, Hudda N, Sioutas C. Intra-community variability in total particle number concentrations in the San Pedro harbor area (Los Angeles, California). Aerosol Science and Technology 2009;43(6):587-603. |
R832157 (Final) R832413 (2009) R832413 (Final) R832413C001 (2009) R832413C001 (Final) |
Exit Exit |
Supplemental Keywords:
Air quality, source apportionment, chemical mass balance, organic aerosol, statistical analysis, nonparametric regression, receptor modeling, RFA, Ecosystem Protection/Environmental Exposure & Risk, Scientific Discipline, Air, particulate matter, Air Quality, Environmental Chemistry, Monitoring/Modeling, Environmental Engineering, Environmental Monitoring, atmospheric dispersion models, air sampling, chemical characteristics, airborne particulate matter, emissions monitoring, atmospheric chemistry, real-time monitoring, speciation, modeling studies, environmental measurement, particulate matter mass, air quality model, particulate organic carbon, aerosol analyzers, source apportionment, chemical speciation sampling, particle size measurement, air quality models, analytical chemistry, atmospheric measurements, model-based analysisProgress and Final Reports:
Original AbstractThe perspectives, information and conclusions conveyed in research project abstracts, progress reports, final reports, journal abstracts and journal publications convey the viewpoints of the principal investigator and may not represent the views and policies of ORD and EPA. Conclusions drawn by the principal investigators have not been reviewed by the Agency.