
Grantee Research Project Results
Final Report: Integrated Measurements and Modeling Using U.S. Smart Homes to Assess Climate Change Impacts on Indoor Air Quality
EPA Grant Number: R835756Title: Integrated Measurements and Modeling Using U.S. Smart Homes to Assess Climate Change Impacts on Indoor Air Quality
Investigators: Lamb, Brian , Pressley, Shelley N. , Jobson, B. Thomas , Cook, Diane , Kirk, W. Max , Walden, Von P.
Institution: Washington State University
EPA Project Officer: Keating, Terry
Project Period: November 1, 2014 through October 31, 2017 (Extended to December 31, 2018)
Project Amount: $996,588
RFA: Indoor Air and Climate Change (2014) RFA Text | Recipients Lists
Research Category: Air Quality and Air Toxics , Air , Climate Change
Objective:
The overall goal is to improve our understanding of the complex intersection between indoor air quality and climate change. Our objectives are to address three specific science questions:
- How do local climate conditions, including extremes in the range of weather conditions, affect indoor air quality factors including ventilation rates, occupant behavior, and indoor pollution levels and are there generalizations that occur across the ensemble of buildings and locations?
- How well does the CONTAM indoor air quality model perform for the range of conditions and buildings in our Smart Home ensemble?
- For future climate conditions what are the projected indoor air quality levels in a set of buildings representative of US housing stocks, and how sensitive are these levels to plausible changes in building properties and human behavior?
In the pursuit of these objectives, we were able to explore a number of more specific issues including the interactions between air exchange rates driven by outdoor temperatures, whole house emission rates due to outgassing from indoor materials affected by indoor temperatures, and pollutant indoor levels as a result of ventilation and emissions. We were also able to characterize summer versus winter indoor air quality conditions, including the effects of wildfire smoke events.
Summary/Accomplishments (Outputs/Outcomes):
Activities
During this project, we collected high time resolution indoor/outdoor pollutant data along with ambient meteorology and automated house air exchange observations for nine occupied homes during one week in summer and one week in winter. Two of the house measurement periods coincided with intense wildfire smoke events. These measurements included use of a Proton Transfer Reaction Mass Spectrometer to measure a range of volatile organic compounds (VOCs). Each house was equipped with Smart Home occupant sensors to track indoor activities, including door and window usage. The houses were selected to represent a range of building types and ages. One of the houses was a net zero energy house, and controlled experiments were conducted in another house to investigate temperature and indoor source outgassing interactions.
To complement the intensive house measurements, we developed an automated simulation package using the CONTAM indoor air quality model ( https://www.nist.gov/el/energy-and-environment-division-73200/nist-multizone-modeling/software-tools/contam ). The CONTAM system was evaluated using data from the test houses, and then the modeling system was applied for current and future decades to investigate climate change impacts on indoor air quality using selected representative housing types located in 19 US cities. For future climate conditions, we employed the multivariate adaptive constructed analogs (MACA) statistically downscaled data set for two Representative Climate Pathways (RCP4.5 and RCP8.5) and eight different global climate models so the CONTAM results represent an ensemble of possible climate projections. Together the measurement and modeling program provide new insights into indoor air quality and the potential impact of climate change upon future housing environments. The approach and results are summarized in the remainder of this report with more detailed descriptions provided in published and draft journal papers attached as appendices to the report.
Methods
Houses were chosen in this study to provide a range of ages and design characteristics that represent typical detached home types listed in the National Institute of Standards and Technology database of 209 representative residential building types in the US (Persily et al., 2006). House properties are summarized in Huangfu et al. (2019). For most of the homes, measurements were performed twice, for a 1-week period in summer and a 1-week period in winter. All the homes, except H5, had attached garages. The homes were built between 1958 and 2011 and had a range of ventilation types and heating appliances. Most homes had a central forced air system (CFA) that could provide heating and air conditioning, sometimes combined with a heat recovery ventilator (HRV) or an auxiliary fresh air intake (FAI) vent that periodically provided fresh air flow. Two homes (H6 and H10) did not have a central air system and relied on electrical baseboard heaters for heating (H6) or radiant ceiling heating (H10).
A suite of instruments was used to measure both indoor and outdoor air pollutant concentrations. Details on the measurement methods are described in Huangfu et al. (2019). From these indoor and outdoor systems, continuous measurements of O3, CO, NOx (Teledyne Inc.), CO2, H2O (LI-840a, LI-COR), and selected VOCs (PTR-MS, Ionicon Analytik) were performed. Outdoor measurements of PM2.5 mass concentration (DustTrak II 8530, TSI) were also made from a separate copper tubing inlet mounted on the roof tripod. Additional equipment was located indoors and mounted in a rack placed in the living room to measure temperature, PM 2.5 mass (DustTrak II 8530, TSI), PM number concentration (DC1100, Dylos), CO2 and H2O (LI-840a, LI-COR). Five wall mounted devices measured CO2 (K30, Senseair), RH, and temperature and these were distributed throughout the home. Sensors for measuring window and door openings and movement of people were also installed (Lin et al., 2017). The air change rate per hour (ACH) was determined from the periodic release of CO2 into the home via the home&'s central forced air system.
Conclusions:
Wildfire smoke penetration ratios for PM, O3, and VOCs (Kirk et al, 2018).
We sampled two houses during intensive wildfire smoke episodes; results are shown in Figure 1 . With outdoor PM levels exceeding several hundred ug/m 3 , indoor levels were much lower with indoor/outdoor ratios of approximately 10 to 20 percent. Ozone levels outdoors in summer during the smoke events were in the 40 to 60 ppb range, but indoor levels never exceeded 10 to 15 ppb (15% of outdoor levels). While the penetration rates for PM (and O3) are relatively low, elevated levels of PM2.5 still occur during these wildfire events due to the extremely high levels outdoors. As such, we can expect the increased occurrence of wildfires projected under global warming will increase indoor exposure levels in the future.
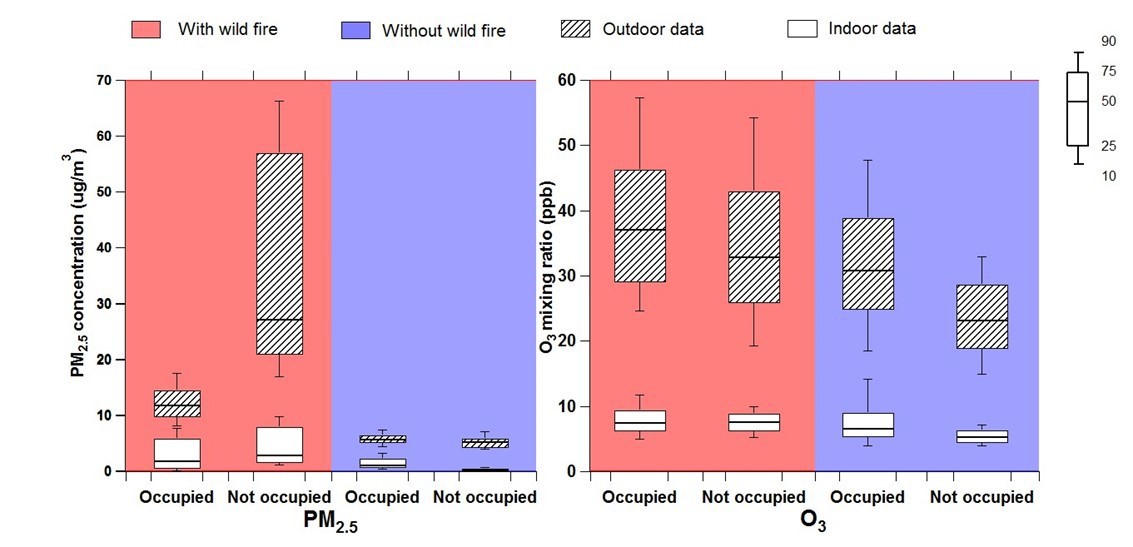
Figure 1. Indoor and outdoor PM2.5 and O3 levels during wildfire events.
Indoor air toxic observations
With the PTR-MS, we were able to collect extensive VOC measurements indoors and outdoors. Among the VOC's we selected several known air toxics including formaldehyde, acetaldehyde, methanol, and benzene for further analysis. The frequency distributions of these compounds are shown in Figure 2 in terms of box and whisker plots (90th, 75th, median and mean levels).
Figure 2. Selected air toxic levels indoors and outdoors in 9 test homes during summer and winter test periods. Shaded line is the average outdoor level, blue dashed line is the reference exposure level. Observations are based on 1 minute averages.
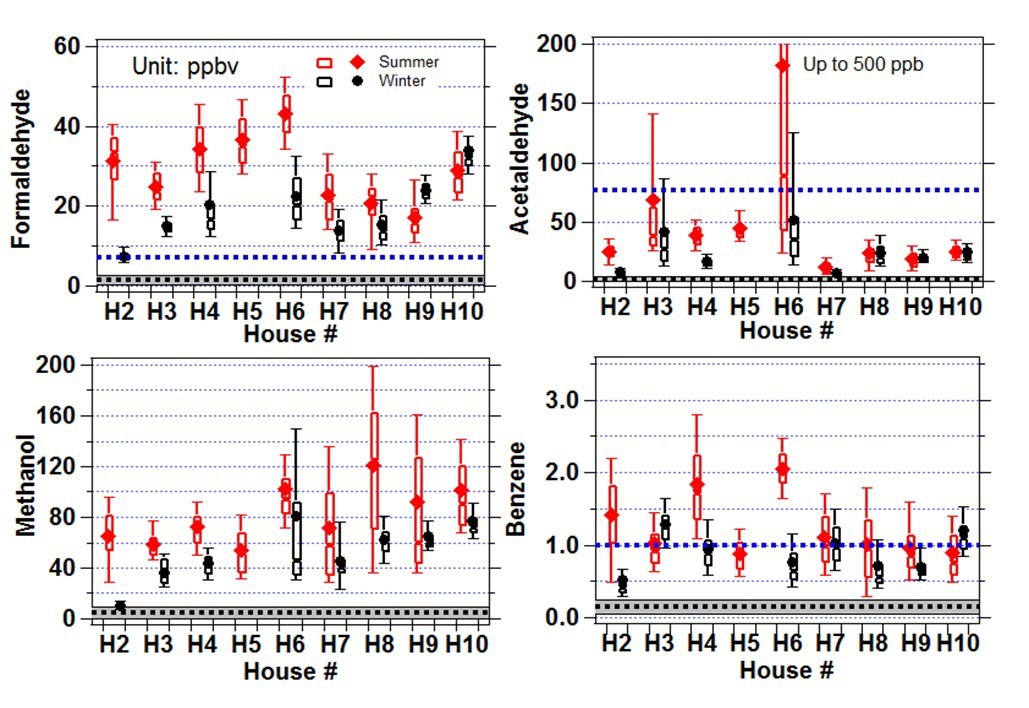
We found elevated levels of formaldehyde in every house well above outdoor ambient levels and also well above the reference exposure level (REL) ( https://oehha.ca.gov/air/general-info/oehha-acute-8-hour-and-chronic-reference-exposure-level-rel-summary ). For acetaldehyde, methanol, and benzene indoor levels were all well above outdoor ambient concentrations, but similar to or less than the RELs. In addition summertime indoor levels were generally much higher than the corresponding winter levels in each house. Histograms for these compounds exhibited a mix of patterns. In some houses, the distribution showed a single mode which we believe reflected outgassing of the species from building and/or furnishing materials. In other cases, the distributions showed two or three modes which as illustrated in Figure 4 corresponded to outgassing sources, occupant activity sources and/or opening of doors and windows.
Benzene levels were also elevated, but in most houses this reflected the infiltration of garage air to the house. Measured levels of benzene in attached garages were higher than observed indoors, and there was a clear relationship of indoor levels with changes in benzene levels in the garage.
For the house with radiant ceiling heating, we discovered that the ceiling outgasses formaldehyde and other air toxics at an elevated rate when the heating elements are on. This was confirmed through laboratory chamber emission tests of a section of ceiling. We also found what appears to be mercury vapor off-gassed via the same mechanism. Further work is needed to confirm and quantify the mercury emissions.
Formaldehyde variations with temperature and air exchange rates
The high time resolution data reveal diel variation of VOC levels driven by infiltration and temperature dependent whole house emission rates and illustrate the dynamic state of the indoor environment in the absence of human activity sources. In unoccupied homes, when the air change rate was driven by infiltration, the pollutant levels displayed an afternoon maxima and an early morning minima driven by diel variation of meteorologically modulated infiltration rates. Pollutant concentrations appear to lag behind the air change rate, resulting in relative poor correlations between pollutant concentration and air change rate. In a home with near constant afternoon infiltration rates over several days of increasing ambient temperatures, we determined the whole house formaldehyde emission rate sensitivity to indoor air temperature to be 4.6 ppbv/ o C. In general, formaldehyde displayed a trend with indoor temperature in winter and summer reflecting combined whole house emission rate sensitivity and infiltration rate sensitivity of 3.0 to 4.5 ppbv per o C, a useful metric for predicting the impact of heat waves and changing regional climate on indoor air quality.
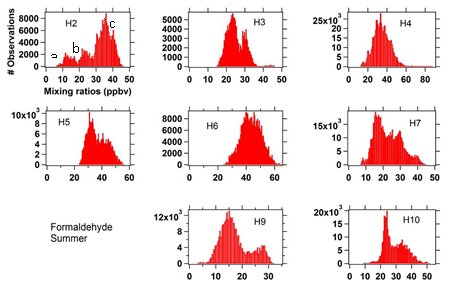
Figure 3. Distribution of formaldehyde concentrations during summer test periods: a) occupied with windows open, b) occupied with windows closed c) unoccupied windows closed.
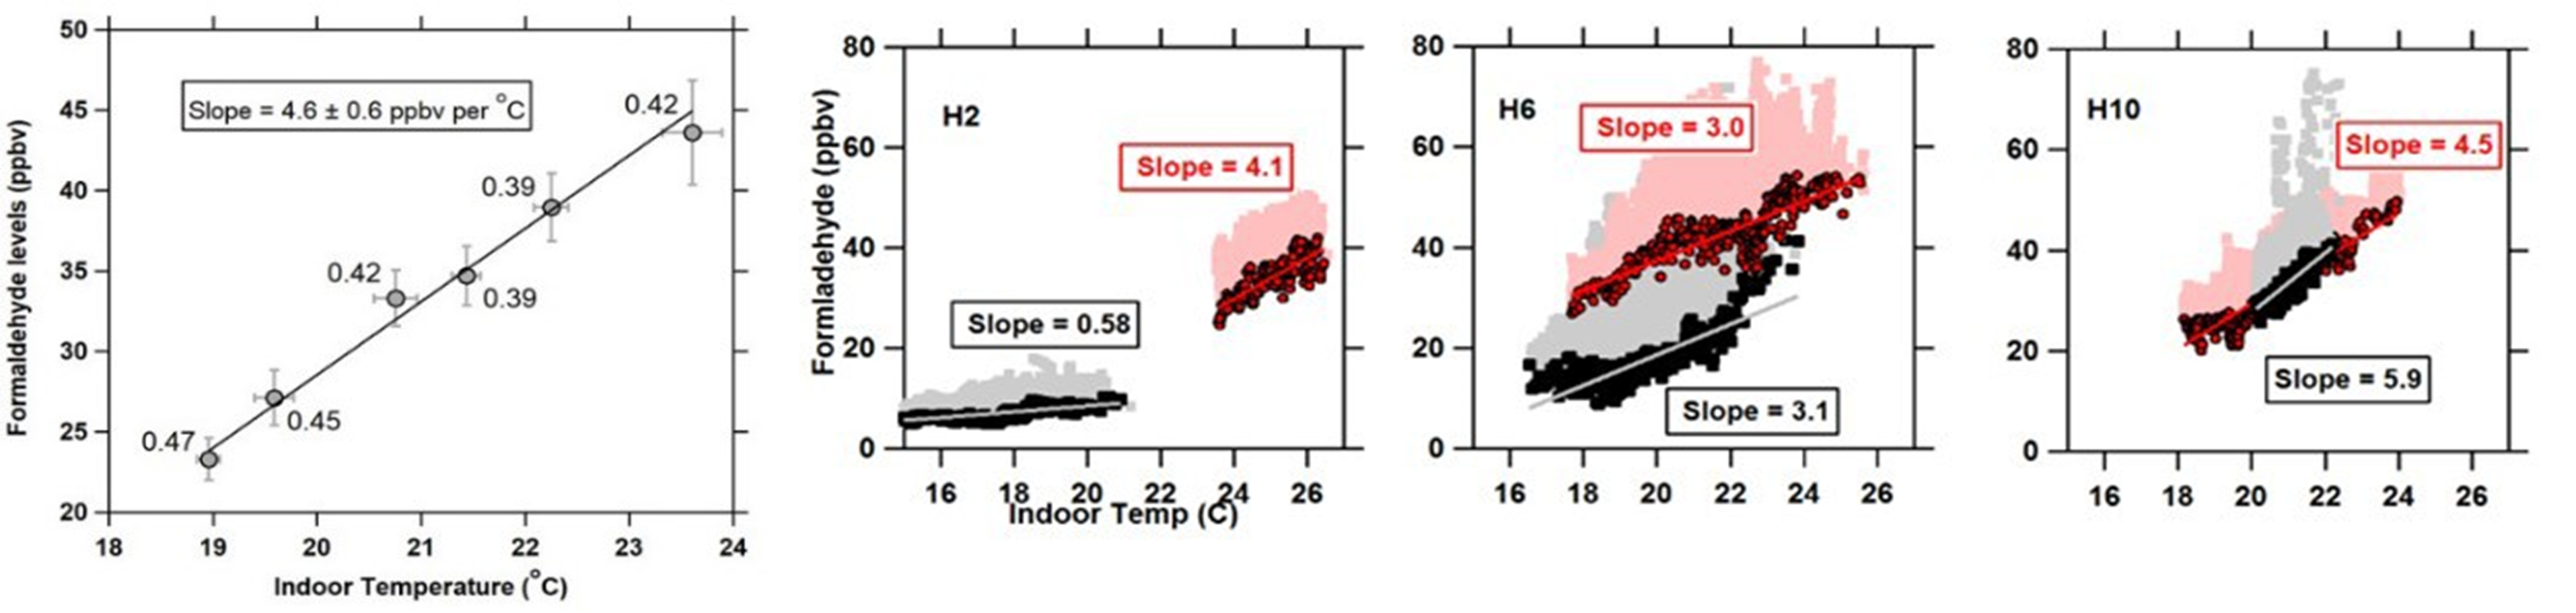
Figure 4. Left) H10 formaldehyde data showing a correlation between indoor and outdoor difference versus indoor air temperature averaged between the hours 18:00 to 24:00 PST when indoor air temperature and formaldehyde levels were highest. Error bars indicate the standard deviation of the averages. Numeric values adjacent to data indicate corresponding ACH average in units of hour-1 . Right) Formaldehyde levels vs indoor temperature winter (black) and summer (red) in three test homes.
Whole house emissions rates derived from controlled ventilation tests
House 5 was a net zero energy house with a controllable ventilation system. In this house we were able to adjust ventilation rates from a large, fixed rate to near zero. By doing this, we were able to observe periods when VOC levels increased exponentially from low values (high infiltration rates) to elevated levels (near zero infiltration rates). By using a simple box model which accounts for infiltration rate and any chemical or depositional loss, we were able to derive whole house emission rates for selected compounds. These are summarized in Table 2.
Table 2. Whole house emission rates in H5 measured at indoor temperatures of approximately 24 o C and an at the natural infiltration rate of 0.05 hour -1 .
| VOCs | C ss (microgram/m 3 ) | n+k (hour -1 ) | S (mg/hour) | E (microgram hour -1 m -2 ) |
| Formaldehyde | 56.2 +/- 0.7 | 0.55 +/- 0.09 | 24 +/- 5 | 81 +/- 16 |
| Acetaldehyde | 137 +/- 2 | 0.088 +/- 0.005 | 9.1 +/- 1.1 | 31 +/- 1.9 |
| Methanol | 141 +/- 2 | 0.078 +/- 0.005 | 8.5 +/- 1.0 | 28 +/- 3 |
| C 2 -Benzene | 25.5 +/- 0.7 | 0.075 +/- 0.007 | 1.5 +/- 0.2 | 5.0 +/- 0.7 |
n = infiltration rate, k = chemical or deposition loss rate.
The experiment demonstrated that formaldehyde has a significant uptake inside the home, presumably due to dry deposition. These emission rate estimates take into account the effects of infiltration rates, chemical loss and the fact that VOCs are never at steady state in a house due to the diurnal changes in infiltration rate and temperature dependent emissions. At the larger air changes rate of 0.49 hour -1 as provided by mechanical flow, the VOC emission were up to a factor of 3 larger (acetaldehyde) than at 0.05 hour -1 . Formaldehyde emission rates were only 10 percent larger at the higher air flow.
Modeling indoor air quality using the CONTAM model
CONTAM is a comprehensive indoor air quality model developed by NIST and based on a multi-zone well-mixed box approach. We installed CONTAM on our linux cluster for automated simulations and used it to assess climate change impacts on indoor air quality in the future.
Results for ozone are shown in Figure 5. In this case, EPA simulations for the 2050s using the CMAQ model were used for outdoor levels. The CONTAM results show the expected low levels indoors compared to outdoors and these results exhibit a range of responses from 2010s to 2090s and across different U.S. cities.
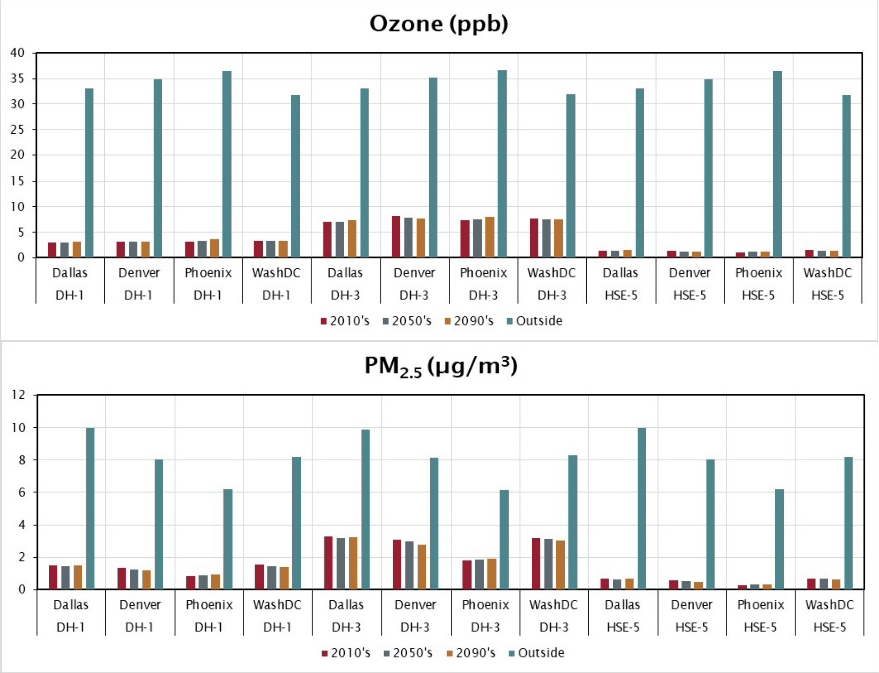
Figure 5. CONTAM results for selected cities for the 2010s, 2050s and 2090s using CMAQ outdoor levels for the 2050s.
Journal Articles on this Report : 3 Displayed | Download in RIS Format
| Other project views: | All 15 publications | 5 publications in selected types | All 5 journal articles |
|---|
| Type | Citation | ||
|---|---|---|---|
|
|
Huangfu Y, Lima NM, O’Keeffe PT, Kirk WM, Lamb BK, Walden VP, Jobson BT. Whole-house emission rates and loss coefficients of formaldehyde and other volatile organic compounds as a function of the air change rate. Environmental Science and Technology 2020; 18;54(4):2143–51. |
R835756 (Final) |
Exit |
|
|
Kirk WM, Fuchs M, Huangfu Y, Lima N, O'Keeffe P, Lin B, Jobson T, Pressley S, Walden V, Cook D, Lamb BK. Indoor air quality and wildfire smoke impacts in the Pacific Northwest. Science and Technology for the Built Environment 2018;24(2):149-159. |
R835756 (2017) R835756 (2018) R835756 (Final) |
Exit Exit |
|
|
Lin B, Huangfu Y, Lima N, Jobson B, Kirk M, O'Keeffe P, Pressley SN, Walden V, Lamb B, Cook DJ. Analyzing the relationship between human behavior and indoor air quality. Journal of Sensor and Actuator Networks 2017;6(3):13 (18 pp.). |
R835756 (2017) R835756 (2018) R835756 (Final) |
Exit Exit Exit |
Supplemental Keywords:
CONTAM, PM2.5, VOCs, ozone, formaldehyde, benzene, wildfiresProgress and Final Reports:
Original AbstractThe perspectives, information and conclusions conveyed in research project abstracts, progress reports, final reports, journal abstracts and journal publications convey the viewpoints of the principal investigator and may not represent the views and policies of ORD and EPA. Conclusions drawn by the principal investigators have not been reviewed by the Agency.