
Grantee Research Project Results
Final Report: Impact of Climate Change and Variability on the Nation's Water Quality andEcosystem State
EPA Grant Number: R834187Title: Impact of Climate Change and Variability on the Nation's Water Quality andEcosystem State
Investigators: Vörösmarty, Charles J. , Clements, William , Poff, N. LeRoy , Wollheim, Wil , Fekete, Balazs , Green, Mark , Gettel, Gretchen M.
Institution: City College of the City University of New York , Colorado State University , University of New Hampshire
EPA Project Officer: Packard, Benjamin H
Project Period: October 1, 2009 through September 30, 2012 (Extended to September 30, 2014)
Project Amount: $799,554
RFA: Consequences of Global Change for Water Quality (2008) RFA Text | Recipients Lists
Research Category: Aquatic Ecosystems , Ecological Indicators/Assessment/Restoration , Watersheds , Water , Climate Change
Objective:
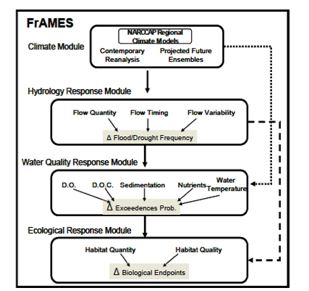
The primary aim of this project is to develop a national-scale, multi-constituent biogeochemistry model by using new and existing modules to compare regional sensitivities of water quality and aquatic ecosystem habitat to climate change and variability forced by regional, downscaled global climate model (GCM) ensemble outputs (North American Regional Climate Change Assessment Program; NARCCAP). The modules will be integrated in FrAMES (Framework for Aquatic Modeling of the Earth System) (Figure 1).
The objectives of this study are three-fold:
- To expand an existing modeling framework to integrate state-of-the-art regional climate projections (NARCCAP) with hydrology and aquatic process models, in order to assess how strongly projected climate change and variability propagate through the Nation's waterways and thus alter the emergence, distribution, severity, and timing of water quality problems.
- To evaluate the extent to which selected attributes of aquatic ecosystem state (flow-mediated habitat, habitat quality, aquatic community structure) are made vulnerable to projected regional climate change across the conterminous United States.
- To present to agency planners a blueprint for systematic monitoring of the Nation's vulnerable and impaired waterways, identifying regions whose habitats are projected to be most at risk from the combined effects of climate and other forcings, and extending sampling strategies from wadeable streams to large rivers.
The overall project approach develops a framework-based modeling system to predict spatially and temporally varying hydrologic and multi-constituent water quality variables. Two major value-added science products that emerged from this project include: 1) incorporation of a new module for aquatic ecosystem state, plus associated indicators and 2) ingestion and use of North American Regional Climate Change Assessment Program (NARCCAP) downscaled, regional ensemble forecasts and AR5-RCP future climate drivers, from which we are performing a systematic set of tests on climate extremes from the contemporary to year 2070. The overall strategy is shown graphically in Figure 1 below.
Figure 1. Modeling strategy for integrating FrAMES
informaiton flow to support assessment of future climate
change and variablity impacts on water quality, habitat
state and ecological response. Regions will have different
vulnerabilities to hydrologic, water quality and biological
change depending on how climate change and other
variables manifest geographically.
Summary/Accomplishments (Outputs/Outcomes):
Existing Framework Development and Application
The primary improvement in FrAMES was accomplished by integrating FrAMES and our data archive. The Global Hydrological Archive and Analysis System (GHAAS) that the CCNY and UNH teams maintained for over a decade provides a series of unique GIS capabilities to manage and manipulate time series (grid or point) along with the gridded networks (Vorosmarty, et al., 2000). The GHAAS infrastructure combined with FrAMES now allows for the facilitated configuration of module integration in modeling exercises using different input forcing data.
The clear separation of process modules and data flow and model execution management in FrAMES allowed us to parallelize our framework to utilize symmetric multiprocessor (SMP) computers using light-weight process and shared memory. The parallel version of FrAMES can make model simulations 2-3 times faster on 8 core machines compared to running on a single CPU. FrAMES also was submitted to the Community Surface Dynamics Modeling System (CSDMS) (an NSF-funded national center), where it is available to registered CSDMS users. The CSDMS computing facilities also mirror the full data archive along with the GHAAS tools supporting FrAMES.
During the period 2010-2013, this modeling framework was continuously refined as part of the core project activity. Because the model infrastructure functions were already in place (by end of Year 1) much of the refinement was essentially debugging and minor code improvements. The biggest change for those who participated in developing new modules within FrAMES was our recent move from its original Subversion version control to Git, which was driven by our need to better communicate code changes between the UNH and the CCNY modeling teams. In particular, as new students joined both the CCNY and UNH teams and needed access to FrAMES to actively modify the various modules implemented within the framework, it was critical to move away from the centralized version control provided by Subversion to a more modern decentralized solution as embodied via Git. Git allows developers to maintain discrete records of their own branches and exchange changes. While Git does not limit the number of repositories individuals can maintain, we choose GitHub as a “meeting ground” for exchanging changes made to FrAMES and to its modules.
Hydrological and other Physical Variables
Improvements to River Network and Corresponding Elevation
We applied the regridding algorithm from Fekete, et al. (2001) to aggregate the ~500 m (15 arc second on longitude × latitude) HydroSHEDS gridded river network (Lehner, et al., 2008) to coarser resolutions (3 and 6 arc minutes). We merged HydroSHEDS with our existing 6-minute gridded river network to expand its coverage beyond the spatial limitations of the HydroSHEDS domain. Additionally, we obtained a new high-resolution digital elevation data set with full global extent derived from stereographic processing of ASTER images from NASA’s Aqua and Terra satellites. While this dataset is less accurate than SRTM, its full coverage allowed us to complete our network at high latitudes where HydroSHEDS is lacking.
Furthermore, we applied a network defragmentation routine, which eliminates sporadic basin fragments (as a result of DEM errors) by identifying endorheic (inland mouth-of-river endpoint) basins and searching for potential "pour points" (digital exits) through presumed endorheic watershed boundaries within a given elevation threshold. We applied DEM corrections based on the gridded networks at aggregated resolutions, which established a consistency between the DEM and the river network by lowering the elevation (essentially cutting valleys) along all potential river courses from headwater to true river mouth.
During Year 2 of the project, we can report the full completion of our regridding of HydroSHEDS (a 15 arc second gridded network) to various coarser resolutions (3, 5, 6, 15 and 30' on longitude latitude grid) with full consistency, applying our regridding algorithm (Fekete, et al., 2001), which aggregates the ~500 m (15 arc second on longitude × latitude) HydroSHEDS gridded river network (Lehner, et al., 2008) to coarser resolutions. This year, we also carried out a comprehensive comparison between HydroSHEDS and the National Hydrography Dataset (NHD) from USGS. This comparison not only confirmed the accuracy of the original HydroSHEDS source data (at 500 m), but allowed us to establish the linkage between basins derived from HydroSHEDS to their NHD equivalent in Hydrological Unit Codes (HUC). The HUC outlets identified on HydroSHEDS enables us to transfer the established linkage to coarser resolution networks that we developed last year. We worked with HUC8, but we will consider redoing our analysis at HUC12, which will offer the evaluation of smaller basins. The ability to work in gridded network space and map it back to HUC basins will allow us to present our results in NHD context that is a preferred means of reporting to federal agencies (EPA and USGS).
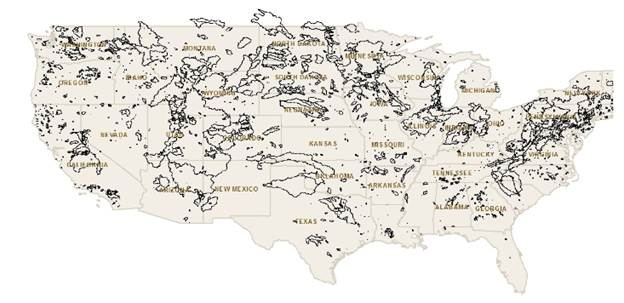
The Vorosmarty lab is in the process of delineating watershed boundaries for each EPA/NAQWA biological site using the now-validated HydroSHEDS digital elevation model to link to the basins associated with the 3,378 ecological test sites identified by the Colorado State University partner team (Figure 2). These ecological sites span a wide range of river types ranging from wadeable small rivers to medium sized rivers, tens of meters wide. The co-registration requires further refinement because some of the captured sites erroneously represent either too large or too small river basins. The correction of these errors will require a largely manual process to identify the river sections that have the closest upstream catchment area to the reported values in the ecological sites catalog.
Figure 2. High resolution watershet delineations associated with ecological test sites.
As part of our network development, we assigned parameterized riverbed geometry to every grid cell at each gridded network resolution (starting from the HydroSHEDS 15" to 3, 5, 6, 15") using established empirical relationships relating mean annual river discharge to mean river width and depth. We assumed that the river channel takes the shape of a power function that was found consistent with empirical formulas relating river discharge to key flow properties (mean depth, width, average flow velocity) (Dingman, 2007). We will use the ecological sites to refine the empirical relationships and replace our a priori riverbed geometry parameterization with more robust estimates.
Wetlands Database
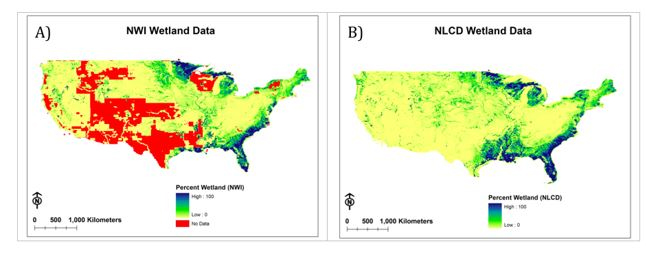
We developed a wetlands data set for the United States that is applicable to continental scale modeling. We obtained the entire National Wetlands Inventory digital archive from Tom Dahl at the U.S. Fish and Wildlife Service. This represents a very high resolution (1:24000) digital data set that covers 58% of the conterminous United States and 25% of Alaska. We also extracted wetland data depicted by the National Land Cover Data (NLCD) set. We aggregated the data to 6-minute spatial resolution, to provide a wetland layer of percent of grid cell as wetlands. The resulting maps for each of the data sets are shown in Figure 3.
Figure 3. Wetland distribution from a) the National Wetland Inventory, and b) the National Land Cover Data set.
Reservoir Operations
Dams and reservoirs are a key characteristic of the modern hydrologic system, with a particular impact on altering the natural streamflow, thermal characteristics, and biogeochemical fluxes of rivers. Depending on dam characteristics (i.e., capacity, height, etc.), watershed characteristics (i.e., upstream catchment area, land use, average precipitation, etc.) and the purpose of building a dam (i.e., for irrigation, hydro electricity, etc.), each reservoir has a specific optimum operating rule. While this is critical for human water security, from an earth sciences perspective, it means that literally 84,000 dams in the National Inventory of Dams potentially follows 84,000 different sets of rules for storing and releasing water, which must somehow be accounted for in our modeling. In reality, there is no comprehensive observational dataset depicting these operating rules that is available. Thus, we will simulate these rules. Our perspective is not to find the optimum operating rule per se but to find composite behaviors that are consistent with the nominal use of each reservoir and their impacts on observed streamgage behaviors. We just began an exploration into the use of Artificial Neural Networks (ANN) in this context. We see as an important advantage of ANN its ability to detect complex nonlinear relations between input and output data, which makes it a valuable tool for time series prediction and fitness approximation. High quality, measured parameters are available throughout the United States (i.e., USGS gauges); thus, we are able to use measured data to train and test our Artificial Neural Networks.
For our purposes, output is monthly discharge from a reservoir or cluster of reservoirs aligned along mainstems and tributaries. For input variables, we are using the prior N (= 2 or 3 initially) months of discharge by dam, past N = 2 or 3 months of inflow to the reservoir (or precipitation upstream). Other possible parameters are upstream catchment area, reservoir maximum capacity, reservoir normal capacity and reservoir height. We are exploring whether it is best to create lumped ANN parameterizations or sub-sets based on reported reservoir purpose (i.e., irrigation, hydro electricity, etc.). It also is possible to divide the United States into a small set of climate and/or precipitation categories (wet, moderate, dry), which may reduce simulation error.
Climate Change and Ensemble Variability
Near Real-time Climate Data Archive
A core element of our data archive is a series of climate products from different sources. We currently are in the process of incorporating the North American Climate Change Assessment Project (NARCCAP) downscaled, regional, ensemble climate change simulations, which will be used as boundary conditions for FrAMES. Access to the data has been granted and we have downloaded the requisite data sets.
The precipitation data sets at different spatial resolutions in conjunction with the regridded river networks discussed previously allowed us to carry out a series of tests assessing the impact of resolution on the riverine flow routing. Our test confirmed the intuitive findings of Fekete, et al. (2001), namely that flow routing at daily or sub-daily temporal resolution requires high resolution river networks, but due to the averaging nature of the horizontal water transport processes the same temporal resolution for computing the vertical water balances is not needed.
During 2010-2011, we continued to maintain our near real-time climate forcing data archive from a variety of sources such as the NCEP Reanalysis products (Kalnay, et al., 1996; Kistler, et al., 2001), precipitation from the Global Precipitation Climate Center, Offenbach, Germany, which provides the basis for a series of water balance model derived products that the CUNY team regularly updates and reports on to the community (Fekete and MacDonald, 2011; Fekete, et al., 2004, 2010). Our near real-time data archive enables us to ultimately operationalize our water quality assessments, poising us to produce a key byproduct of this effort, but admittedly beyond the scope of the current project.
This past year, we also joined the NARCCAP user group, which not only enables direct access to a series of downscaled global circulation model outputs for the United States, but allows us to directly follow the most recent and salient updates and directions of the NARCCAP development. In addition to tests of the NARCCAP archives, we joined the Inter-sectoral Impact Model Intercomparison Project (ISI-MIP) that is testing a series of Global Circulation Model outputs in the context of various land-surface, terrestrial ecosystem and hydrological models (Schiermeier, 2012). Our contribution to this project will be numerical experiments of anticipated impacts of climate change on water quality that will build on the results of this EPA STAR effort.
Land-to-Aquatic Loadings
Development of National Wastewater Treatment Plant Geospatial Database
The spatial distribution of wastewater treatment facilities in the United States in 1984 and 2004 was mapped according to data acquired from the EPA Clean Water Need Surveys (CWNS) database (2011) for the publicly funded treatment plants nationwide (Figure 4). Beside the core characteristics of the wastewater treatment plants (location, treatment levels, capacity, number of people served, etc.) the CWNS database contains information on the water quality and discharge rates of the effluent flow, from which loads are computed.
Figure 4. Spacial distribution of wastewater treatment facilities from the clean Water Needs Surveys, categorized
by level of treatment.
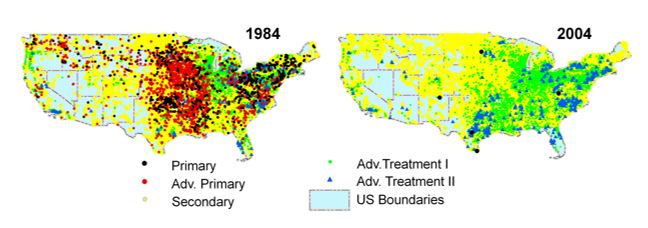
We consolidated the differences between 1984 and 2004, and analyzed the improvement of the wastewater treatment in terms of total nitrogen (TN) release to freshwater. The majority of the treatment plants release their outflow to surface waters. Assigning removal efficiency to all treatment plants allowed us to estimate the TN loading in 1984 and 2004. While significant regional differences exist, our most important finding was that despite the cumulative public and private sector capital expenditure of $202.5 billion (indexed to constant 2004 dollars), the nation-wide TN loading only decreased slightly (5.6%). While the removal efficiency increased from 67% to 78% (due to plant upgrades, most in 2004 at secondary or advanced treatment levels, and with the addition of plants) (Figure 4), the influent flow increased (by 26%), largely offseting the added treatment capacities and improved TN removal efficiency.
Aquatic Processing
The current aquatic ecosystem model takes advantage of hydrologic functionality provided by a new version of our hydrology model --WBMplus-- to route material through continental river systems. WBMplus incorporates water withdrawals (from surface diversions and groundwater) plus reservoir operation modules to treat direct human impacts on streamflow (Fekete, et al., 2010; Wisser, et al., 2008, 2010a, 2010b). We have developed submodels in FrAMES to route water temperature, nitrogen and carbon.
Water Temperature Component
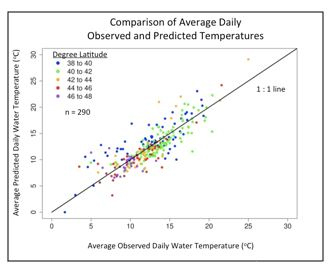
The water temperature model predicts average daily water temperatures based on mixing of terrestrial runoff and re-equilibration during discharge routing. Mean annual temperatures correspond well with observations across all latitudes (Figure 5). Longitudinal profiles along large river transects are consistent with the expectation that re-equilibration with ambient air temperature is a dominant influence on water temperatures. The water temperature component offers the potential to understand climate change impacts on aquatic biogeochemistry.
Figure 5. Predicted mean daily water temperatures
compared with observed mean daily water temperatures
derived from USGS data.
During Year 2 of this grant, simulations were conducted for the continental USA at the 6-minute resolution (latitude, longitude) for the years 1960 through 2000. Comparison of observed and predicted average daily discharges and temperatures at 290 selected USGS gauges indicated good fits at some gauges (i.e., Passaic River, Figure 6) and poor fits at others (i.e., Yellowstone River, Figure 7).
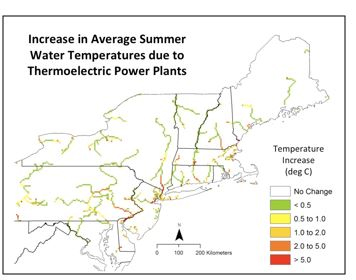
We then tested the model’s capability to simulate thermoelectric power plants and the impact they have on downstream water temperatures with a case study simulation in the northeastern United States at the 3' resolution (latitude, longitude). Power plant data was acquired and assembled from the U.S. Energy Information Administration (EIA) database. Estimates were made regarding water usage and effluent temperature based on power plant type and energy output. Average summer water temperatures increased by as much as 9 degrees as a result of thermoelectric power plants (Figure 8), and impacts were more widespread during drought conditions (data not shown).
Predictions of water temperatures were improved by coupling FrAMES with the Thermoelectric Power and Thermal Pollution Model (Miara and Vorosmarty, in review; Stewart, et al., in review), or TP2M, for dynamic simulation of water withdrawals, water consumption, and return flows of water and thermal pollution at each power plant in the region. The TP2M is driven via an array of data sets including each plant’s maximum capacity, a time series of electricity production (2000-2010), thermal efficiencies, fuel type (biomass, coal, natural gas, nuclear, oil, or other), cooling technology (once-through, re-circulating, combined cycle, or dry-cooling), average daily air and wet bulb temperatures, and simulated average daily river discharge and temperature at the plant intake.
Figure 6. Observed and predicted water temperatures and discharge
at the Passaic River in New Jersey. The Nash-Sutcliffe coefficient
is a statistic for assessing goodness of fit and is bounded by
negative infinity and number 1.
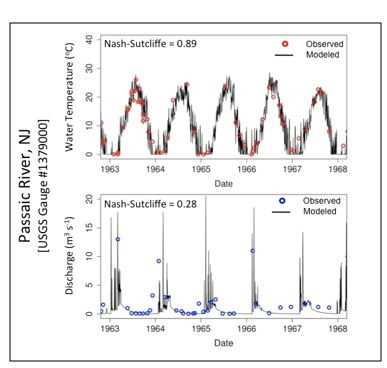
Figure 7. Observed and predicted water temperatures
and discharge at the Yellowstone River in Montana.
The Nash-Sutcliffe coefficient is a statistic for assessing
goodness of fit and is bounded by negative infinity and 1.
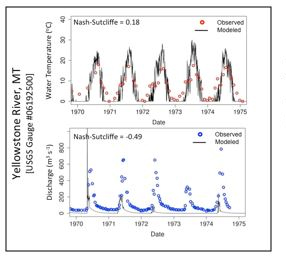
Figure 8. Increase in average summer water temperatures
due to water withdrawls at thermoelectric power plants.
Several model improvements currently are underway. First, despite the relatively robust water temperature results (Figure 5), the predicted river discharge is being modified. To improve performance, we first calibrated the model using observation data at 36 gauge stations listed in the USGS Hydrologic Benchmark Network (HBN) using the Generalized Likelihood Uncertainty Estimate (GLUE) (Beven and Binley, 1992). The HBN is a collection of USGS gauge stations across the United States that provides long-term streamflow measurements in areas where anthropogenic impacts are minimal. We also will be updating our climate drivers with higher resolution MERRA data sets from NASA’s Global Modeling and Assimilation Office (GMAO) for the calibration period of 1979 through 2011.
New sub-routines for irrigation, impervious surfaces, and reservoirs continue to be developed so their impacts on discharge and water temperatures can be assessed. The irrigation function withdraws river water and redistributes it across crop surfaces whereas imperious surfaces will create flashier flows in urban areas. Both irrigation and impervious surfaces extend the exposure of water to atmospheric heat forcings. Reservoirs will adjust the timing of discharge in the river network and will provide a long-term mixture of upstream water temperatures. These functions will be tested and optimized with historical observations of discharge and water temperatures.
Additionally, recent model validation at higher resolution (3' L/L) was carried out, based on regional comparison of predicted and observed mean daily discharge and water temperatures at U.S. Geological Survey (USGS) gauging stations in the Northeast United States with drainage areas of greater than 200 km2 and, for additional water quality applications, more than 10 temperature data points. Locations of USGS gauging stations were reconciled to the simulated river network using a semi-automated protocol provided by the Global Hydrological Archive and Analysis System (GHAAS) to match observed and digitized drainage areas to less than 10% error. Data inventories for temperature (242 stations) are less complete than discharge (694 stations), both spatially and temporally. Median numbers of temperature data points are 55 (instantaneous), and 4018 (daily mean) over the 11-year period for each gauge measure, respectively. Significant spatial gaps in observed water temperature data exist in the northern section of the study domain (i.e. New York, Massachusetts, Vermont, New Hampshire, and Maine).
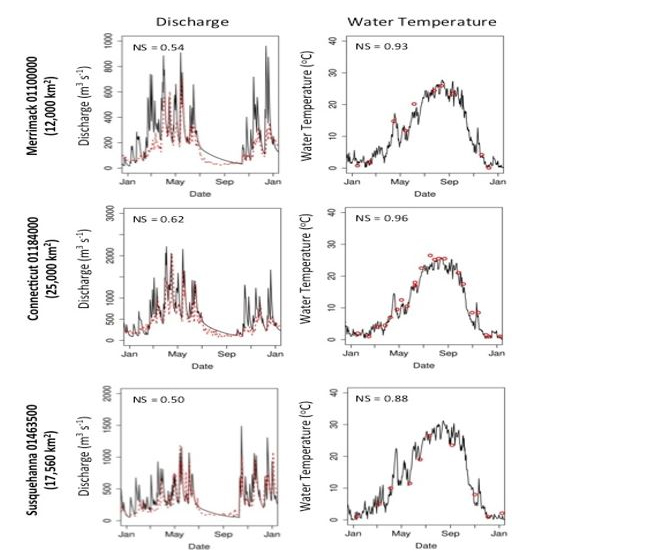
Modeled discharge and water temperatures match observations well throughout the Northeast United States for the years 2000 through 2010. The Nash-Sutcliffe coefficient (NS) was used as a goodness of fit measurement. By definition, NS values below zero indicate the average observed value is a better predictor than modeled output. NS values in this study were found to be greater than zero for 85.7% of discharge stations and 91.7% of water temperature stations (Figures 9 and 10), suggesting good model fit. The 1st, 2nd, and 3rd quartiles for NS coefficients at discharge stations are 0.28, 0.46, and 0.55, and at temperature stations are 0.68, 0.83, and 0.88, respectively. Model performance at USGS stations along river segments impacted by power plants is just as good with NS quartiles of 0.28, 0.45, and 0.52 for discharge and 0.68, 0.83, and 0.90 for temperature. Discharge goodness of fit is slightly better in the northern than the southern part of the study region whereas predicted water temperatures have similar goodness of fit throughout the domain. Time series of modeled and observed discharge and water temperatures show model results capture seasonal and storm event trends in discharge and water temperatures (Figure 11). USGS gauges with both discharge and water temperature data (n = 148) were evaluated to determine whether model performance for the two variables is linked. A moderate positive correlation was found (Spearman’s rho coefficient of 0.49 with a p-value < 0.0001, data not shown), which indicates accurate prediction of water temperatures is more likely at stations where modeled discharge is good. Average daily observed and modeled discharge (Figure 12a) and water temperatures (Figure 12b) further suggest predictions sufficiently capture the relative magnitudes of discharge and temperatures throughout the region. The median MAE value for water temperatures was 2.5oC.
Figure 9. Comparison of modeled water temperature with observations at USGS
gauges (n = 243) with drainage areas greater than 200 km2
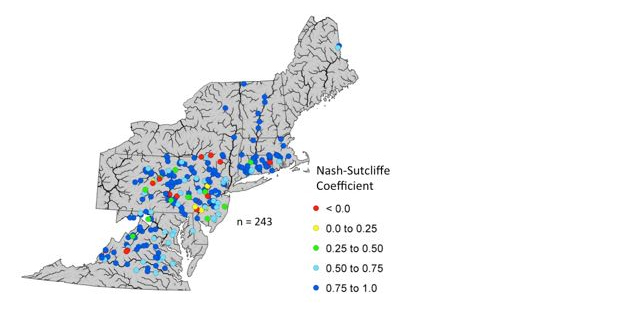
Figure 10. Comparison of average daily modeled discharge with obervations
at USGS guages (n = 694). Black line shows one-to-one relationships.
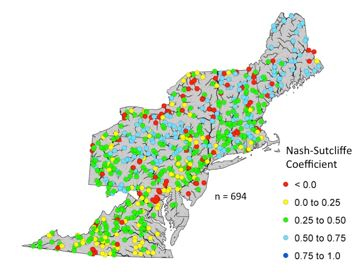
Figure 11. TIme series of modeled discharge and water temperatures for the year 2002
compared with observations at selected USGS guage stations. Model output is in black,
observations are in red.

Figure 12. Comparison at USGS guating stations (n = 243) of (a) average daily modeled
dischanrge (n = 694), and (b) agerage daily modeled temperatures. Black lin shows
one-to-one relationship.
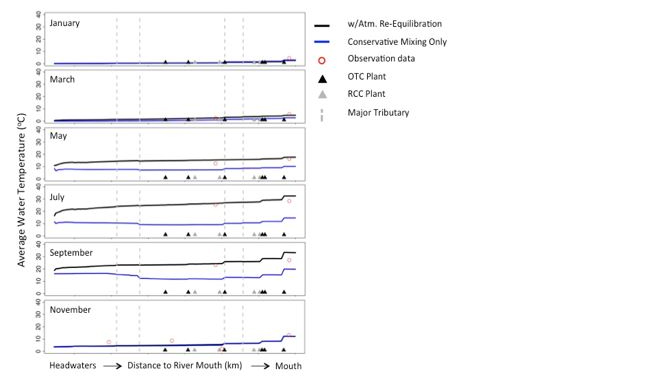
Basin profiles for the Susquehanna River (Figure 13) show the effect that re-equilibration of water temperatures with atmospheric conditions (Dingman, 1972) has on average monthly temperatures. Simulation of conservative mixing of point and non-point thermal loadings (i.e., modeling river networks as non-conductive pipes) results in water temperature predictions that are too low for most of the year, particularly in the summer (Figure 13). This suggests that inputs and dilution alone cannot fully explain observed river temperatures and that atmospheric re-equilibration is an important dynamic in driving water temperatures. Temperature profiles also indicate that despite this re-equilibration, thermoelectric power plants can have significant impacts on average water temperatures throughout the year.
Figure 13. Susquehanna basin profiles for average monthly water temperatures
in 2008. Two scenarios are shown; the black line represents the full model with
atmospheric re-equilibration, the blue line represents a model with conservative
mixing of thermal inputs only. Hollow red dots represent averaged instantaneous
obervations collected during the month.
The model was used to demonstrate the contemporary (2000-2010) dependence of the electricity sector on riverine ecosystem services and associated aquatic impacts in the Northeastern United States (Stewart, et al., in review). Results indicate 28.2% of the total thermoelectric heat production in the Northeast is transferred directly to rivers, whereas 26.0% is directed to vertical cooling towers. Due to the distribution of power plants within the river system, only 10.4% of heat transferred to rivers is dissipated to the atmosphere, and the rest delivered to coasts, though basins with power plants further upstream dissipate greater proportions (Stewart, et al., in review).
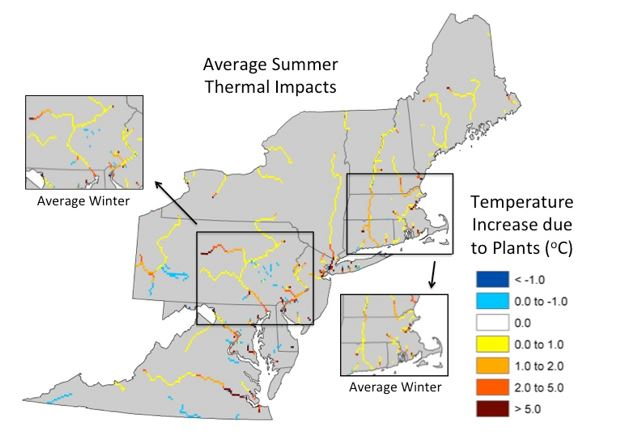
The environmental costs associated with utilizing river networks to dissipate heat from thermoelectric power plants are reduced flow and increased freshwater river temperatures. Model results suggest impacts to the hydrological regime are minimal as average summer water consumption equates to 0.47% of average summer discharge. Impacts to the thermal regime of rivers are more widespread (Figure 14) with increases in average summer and winter water temperatures by at least one degree in 26.9%, and 18.3% of potentially impacted river length (segments downstream of plants) in the Northeast (Stewart, et al., in review). These temperature increase results in increased annual unsuitable habitats for representative cold, cool, and warm water fish in segments downstream of plants by 8.9% km, 38.5% km, and 83.0%, respectively (Stewart, et al., in review).
Several additional improvements have been made to FrAMES to accurately represent the hydrological impacts of land cover change. First, the model has been updated to incorporate the effects of impervious surfaces on the vertical water balance of each grid cell. The proportion of impervious surfaces in each grid cell that are assumed to be hydrologically connected to the river network is calculated based on work done in a suburban watershed near Boston, Massachusetts (Pellerin, et al., 2007). Values for impervious surfaces across the continental United States were acquired from the National Land Cover Data (NLCD, 2006) and were aggregated to the 3-minute latitude by 3-minute longitude resolution. The presence of impervious surfaces in the model not only increases the instantaneous runoff added to the river network, but also decreases the surface area available for evapotranspiration of soil water in each grid cell. This new model feature allows us to partition grid cell runoff into three distinct sources: 1) groundwater, 2) surface water, and 3) stormwater (Figure 15). The addition of stormwater runoff to the model impacts river flows the most during the summer when soils normally are dry and retain precipitation. Impervious surfaces do not significantly alter modeled river discharges during the spring and winter because soils are already saturated during these periods and grid cells were already positioned to convert new depths of precipitation into instantaneous runoff.
Figure 14. Increase in average summer water temperatures (2000-2010) due to thermal pollution from
power plants. Callout boxes show results for average winter conditions in selected regions. Temperature
increases due to plants are more widespread in the summer months because waste heat inputs are
dissipated more quickly in the winter.
Second, updates to the soil available water capacity in each grid cell is underway to account for the average rooting depths of various crop types throughout the model domain (Siebert and Doll, 2010). This will provide a better estimate of evapotranspiration from each grid cell that has active agriculture. NLCD (2006) is being used to classify the distribution of pastures and cultivated crops.
These model advancements enable FrAMES to more accurately quantify the hydrological impacts that result from land use change from pristine to contemporary conditions. Such hydrological impacts can directly influence river temperatures by adjusting the timing in which new volumes of runoff mix with routed river discharge. Changes to the hydrological and temperature regimes of rivers can have severe implications on habitats for fish and other aquatic species.
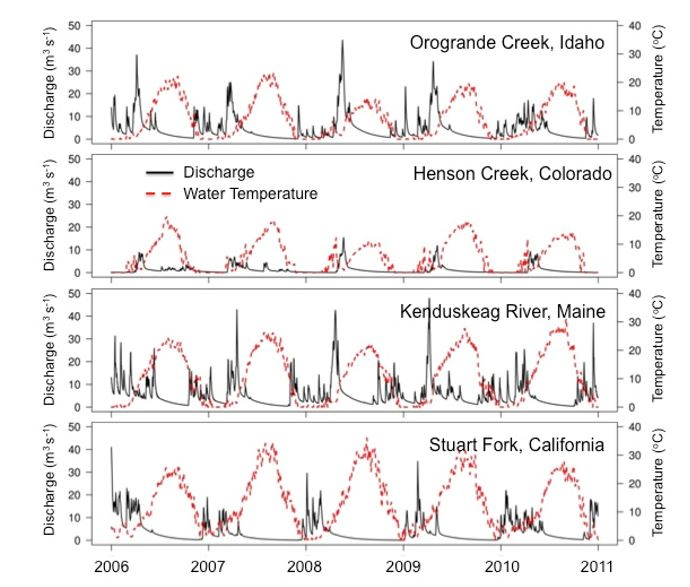
Time-series of modeled river discharge and water temperatures have been sampled at 3,225 selected National Water Quality Assessment (NAWQA) observation sites (Figure 16). Model results are being sampled at these locations for scenarios that combine land cover and climate change and will be analyzed to identify the footprint humans are having on aquatic habitats across the contiguous United States.
Figure 15. Runoff partitioned into three distinct sources for a grid cell with 50% impervious. Model results
are for the year 2000.
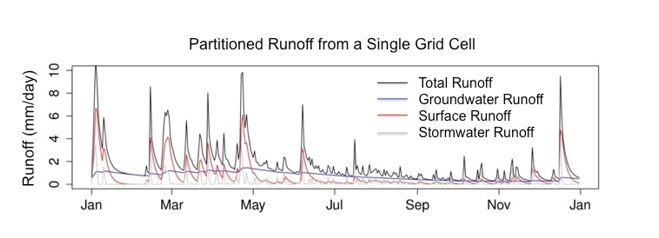
Figure 16. Modeled river discharge (black lines) and water temperatures (red lines) at four of the 3.225 NAWQA sites
for pristine land cover conditions. The model captures the seasonal variability at each site based on local climate and
soil characteristics.
Finally, future IPCC climate scenario data are being used as input to our models in order to depict future climate sensitivities. The model has been used to test the relative impact of climate change and direct hydraulic engineering operations (i.e., reservoirs, irrigation, and impervious surfaces) on river discharge and water temperatures. These relative impacts are being evaluated across various flow conditions ranging from drought to high flow periods.
To execute this goal, in 2011-2012, the CUNY Environmental CrossRoads Initiative team was invited to participate in the Inter-Sectorial Impact Model Inter-comparison Project (ISI-MIP) initiated by the Potsdam Institute for Climate Impact Research (PIK), which represented an opportunity to test our modeling infrastructure in order to assess future changes in the hydrologic cycle and aquatic ecosystems arising from climate change. ISI-MIP provided us with state-of-the-art GCM climate forcings from the latest CMIP5 model runs developed for the upcoming 5th IPCC Assessment Report (AR5). ISI-MIP selected five GCMs (HadGEM2-ES, IPSL-CM5A-LR, MIROC-ESM-CHEM, GFDL-ESM2M) considering historical and four future climate change scenarios (RCP2.6, RCP4.5, RCP6.0 and RCP 8.5) following different representative concentration pathways (RCP) (Moss, et al., 2010) and developed a suite of bias corrected (Hempel, et al., 2013) forcings to enable assessment of uncertainties in the GCM climate simulations and the impacts of climate change under different carbon emission trajectories. The ISI-MIP data were made available to us at 30' (longitude × latitude) spatial and daily temporal resolution covering the 1950-2005 period as historical and 2006-2099 as future simulations. The spatial resolution from ISI-MIP without further downscaling is comparable to the NARCCAP data at 50 km grid spacing.
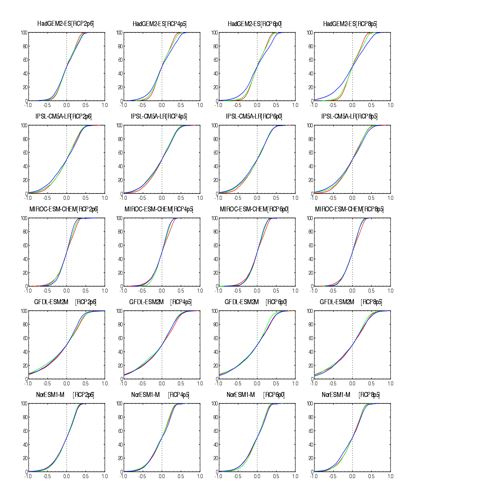
WBMplus simulations (Figure 17) were carried out globally on 30' resolution gridded network (DDM30) (Doll and Lehner, 2002), on which the ISI-MIP project standardized. Our initial results demonstrate that uncertainties due to differences among the GCM data forcings (even after bias correction) are more pronounced than the changing runoff responses to the contrasting climate change scenarios. Interannual variations in particular appear to be depicted vastly differently by the different climate models. We see that the GFDL-ESM2M model stands out with likely unrealistic year-to-year changes. Figure 18 shows the exceedence probability of normalized daily river discharges (expressed as log10 of the instantaneous flow and the median flow ratio) near the mouth of the Mississippi river for different periods (1950-1999, 2000-2049, and 2050-2099) using different GCM forcings under different RCP climate scenarios.
Figure 17. Water Balance Model (WBMplus) runoff estimates for North America using ISI-MIP climate forcing data.
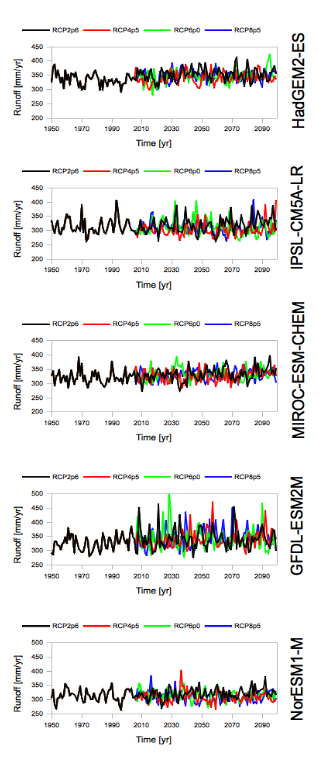
Similarly to the interannual runoff variations depicted in Figure 17, the inter-model differences vastly exceed the changes in the exceedence probability distributions for the different time periods (Figure 18). The GFDL model-forced discharge estimates once again stand out, with far more flow fluctuation than most of the other models.
We intend to further explore these ISI-MIP forcing data during our requested no-cost extension by utilizing the high resolution (3' longitude × latitude grid) that we derived from HydroSHEDS under project funding last year. The high resolution flow routing will enable us to represent flow accumulation processes through river channels more realistically and depict the discharge regimes for smaller basins.
While we intend to base our climate change impact assessments on the more up-to-date ISI-MIP climate forcings, we did not abandon our original plans for testing the NARCCAP data. We already carried out model simulations at 3' spatial resolution for the 1980-1999 period over the conterminous United States using based on NARCCAP forcings incorporating NCEP reanalysis (Kalnay, et al., 1996; Kistler, et al., 2001) as a constraint on the WRF regional climate mode (see below).
Figure 18. Exceedence probabilities for the 1950-1999 (red), 2000-2049
(green) and 2050-2099 (blue) periods for the simulated, normalized discharge
reported near the mouth of the Mississippi River.
We also continued carrying out near real-time model simulations with observed climate forcings as a combination of NCEP reanalysis and monthly precipitation products from the Global Runoff Data Centre, Koblenz GERMANY. As part of our no-cost extension, we are planning to compare NARCCAP/NCEP/WRF driven simulations with the observed climate-based runoff and discharge estimates. This will allow us to evaluate the regional climate models as robust (or not) drivers for impact assessment studies.
Denitrification/Respiration Component
For nitrogen, we are using simple removal parameters that are based on concentration and water temperature (Mulholland, 2008; Wollheim, et al., 2008a; Wollheim, et al., 2008b). The empirical studies indicate that denitrification is a non-linear function of concentration (Mulholland, 2008). On average, each order of magnitude increase in loading to a watershed results in a 24% decline in the proportion of aquatic loading that is removed. However, the construction of reservoirs can offset some, though not all, of this decline. Our analysis indicates that efficiency loss contributes 25% of the increase in nutrient exports to the coastal zone in the contemporary era due to anthropogenic activities (Wollheim, et al., in prep).
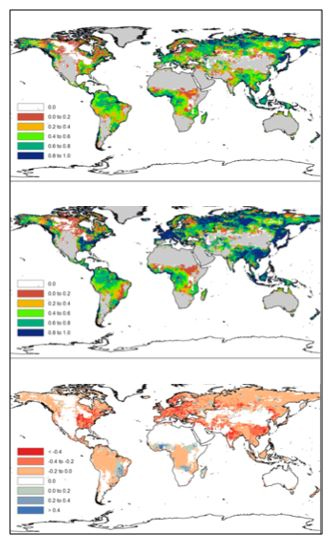
Using these model results we constructed maps of the proportion of local DIN loadings to aquatic systems that are exported to the coastal ocean (Figure 19). These maps indicate regions where aquatic control has weakened considerably, but also indicates regions where aquatic regulation of exports remains high, despite increased loading. Such maps may be useful for identifying where continued or intensified agricultural activity may be possible with minimal impact to the coastal ocean. The model also has been used to estimate N2O emissions from aquatic systems globally. These findings suggest that freshwater systems account for 10% of global anthropogenic N2O emissions (Beaulieu, et al., 2011).
Figure 19. Proportion of local DIN loading to aquatic systems
that reaches the coastal ocean in A) preindustrial B)
contemporary period and C) change in proportion reaching
the coastal ocean due to efficiency loss of aquatic removal
in areas of at leat 5x increase in N loading between preindustrial
and contemporary periods, including the effects of dams.
(Wollheim et.al., 20120; Wollheim et.al., in preparation)
DOC Fluxes
This modeling component seeks to provide predictions of discharge, water temperature, and DOC daily time series by accounting for spatial and temporal variability in loading from land and transformations in river systems. We are using the Framework for Aquatic Modeling of the Earth System (FrAMES) as the modeling environment, which is optimized for horizontal transfer of water and materials through river systems and developed by the study team (Wisser, et al., 2010a,b; Wollheim, et al., 2008a,b; Wollheim, in preparation). The discharge component in FrAMES is based on recent updates to the UNH Water Balance Model, WBMplus (Vorosmarty, et al., 1998; Wisser, et al., 2010a,b).
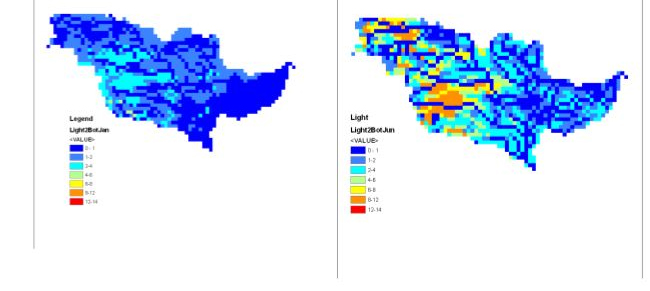
This past year we have developed a river light model (based on Julian, et al., 2008) that predicts the spatial and seasonal variability of light reaching the water surface and attenuation through depth. Together, these factors will be used to drive both microbial and photodegradation of colored DOC. Water temperature predictions are needed in order to model the fate of aquatic DOC, because transformation rates are temperature dependent. The light model takes into account variation in solar radiation, canopy height, reflectance, and attenuation through the water column, which is a function of DOC and turbidity. Examples of light predicted to reach the stream bottom in January and June are shown in Figure 20.
Figure 20. Model predicting light reaching the stream bottom on rivers throughout the Mississippi River basin for
January and June. Spacial variation accounts for the role of vegetation variability throughout the network, as well
as variation in water depth.
We continue to develop our DOC model within FrAMES to predict DOC fluxes throughout the continental United States. In the model, we apply either empirically based land use specific loading relationships of DOC as a function of runoff (e.g., Raymond and Saiers, 2010), or incorporate model predicted DOC loadings from terrestrial ecosystem models. We have run the model in both modes, including using predictions of monthly DOC loading from the Terrestrial Ecosystem Model developed by Jerry Melillo and Dave Kicklighter at the Marine Biological Laboratory. TEM predicts DOC runoff from a variety of land uses as a function of runoff and terrestrial ecosystem processes, which accounts for variability due to seasonality, precipitation, and land use. However, the role of wetlands, an important source, is not currently included in these approaches. In the coming year, we expect to modify the loading approaches to account for wetlands using empirical relationships derived from the USGS database.
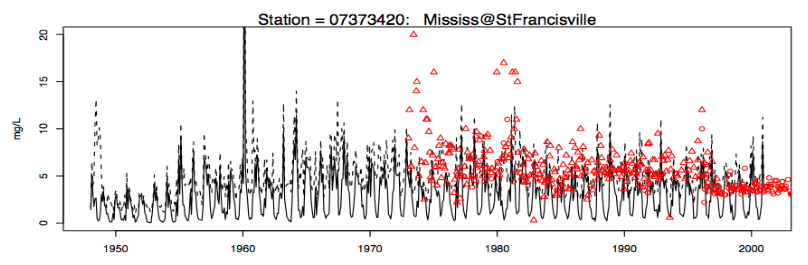
For both loading approaches, we predict spatially and temporally varying DOC inputs from land to water throughout drainage basins. Figure 21 shows the distribution of mean annual DOC inputs for the year 2000 in the Mississippi River basin currently predicted by the model. These inputs then are routed downstream and undergo transformation in the aquatic system, allowing prediction of fluxes throughout river systems. Preliminary results using this approach are promising (Figure 22) but discrepancies remain, likely because wetlands and aquatic DOC production currently are not accounted for. Enhancements this coming year will account for differential loading from wetlands, and more realistic parameterization of aquatic transformation, including photodegradation.
Figure 21. Spatially Distributed, annual DOC leachate predicted by the Terrestrial Ecosystem Model (TEM) for the year 2000 in the Mississippi basin.
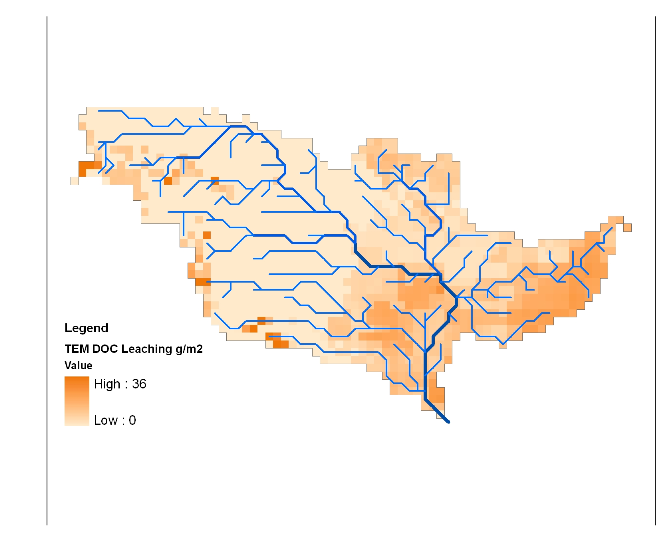
Figure 22. Time Series of predicted and observed DOC concentrations near the basin mouth of the Mississippi River basin, based on TEM model predictions of DOC transfer from land to water. Dashed line represents mixing of inputs from land without aquatic processing, while solid line represents prediction with processing. Observations are from teh USGS database. The full model predictions (solid line) are flashier than the observations (i.e. predicted is too low during summers), suggesting that aquatic processing in the model is either too high, or that there are additional organic matter sources during summer (e.. wetlands, aquatic production).
Stream/River Habitat Assessment
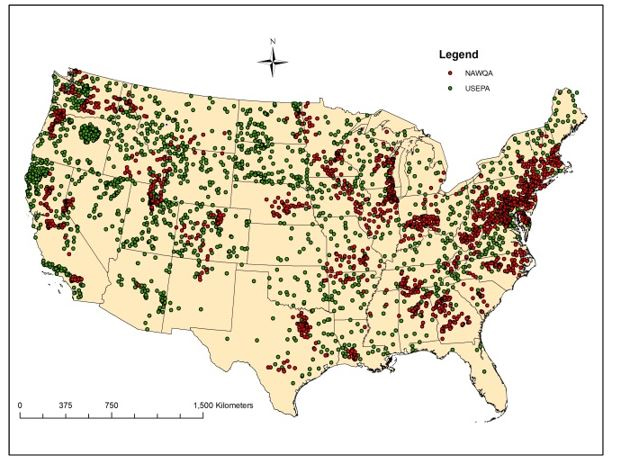
We have combined 1639 sites from the EPA Wadeable Stream Assessment and 1536 sites from the USGS National Water Quality Assessment Program (NAQWA) that contain macroinvertebrate benthos samples (Figure 23). The EPA data were collected in 2000-2005 and NAQWA data collected in 1993-2004. The benthos samples consist of abundance and richness values for each taxon collected and identified. We are using these biological data to derive multiple community-based indices and metrics that reflect stream condition. These metrics include taxonomic metrics (e.g., EPT, richness), tolerance metrics (e.g., % tolerant taxa, IBIs), and trait-based metrics (e.g., functional feeding group, thermal tolerance), the latter being derived from the trait database in Poff, et al. (2006). These various metrics are being used to predict community responses to flow and stream temperature metrics derived from different climactic and disturbance scenarios (Figure 24).
Figure 23. EPA and NAQWA biological sampling sites which contain macroinvertebrate benthos counts
and abundance for current habitat assessment studies. High resolution watershed boundaries (Figure 2)
and water balances are being merged with the biological information.
We are using the daily discharge and temperature data generated by the hydrology sub-team to derive flow and temperature metrics that we hypothesize to be predictive of the taxonomic and functional characteristics of stream macroinvertebrate communities. We are deriving flow metrics such as mean daily or monthly flows to reflect the availability of fresh water to the stream ecosystem. Other metrics reflect the stability and extreme conditions in the stream system, such as the coefficient of variation in daily flows, 7-day maxima, 7-day minima, and count and duration of high and low flow pulses. Extreme flow conditions can have a strong influence on stream fauna. For example, a preliminary analysis of 256 EPA sites reveals that streams with more unstable flow regimes (reflected in CV of flow) have more species with fast development times, greater generations per year, very short life spans, high dispersal, higher propensity to drift, and small size, all traits of organisms adapted to extreme conditions in streams. The Poff lab also will derive metrics from temperature data, particularly annual mean temperature, mean temperature for each month, and minimum and maximum temperatures. Air temperature is strongly correlated with stream temperature, which in turn has very strong influence on stream fauna. We expect to see a greater proportion of thermally tolerant species in communities in streams with warmer temperatures.
Nationally, there are 464 USGS stream gauges that are located within the same stream network of a biological sampling site, within 8 linear km of the sampling site, and have both flow and stream temperature data (Figure 25). These sites will be used to verify predicted stream temperature and discharge from the aquatic ecosystem models.
The CUNY team (B. Fekete, C. Vörösmarty) derived watershed boundaries (pixel sizes of ~24 km2) for our combined dataset of western EMAP and NAQWA. The large resolution of derived watersheds creates the potential problem of accurately delineating the boundaries of small watersheds.
Figure 24. Structure of the habitat analysis currently underway thorugh this EPA-STAR grant. Types of biological and
environmental metrics derived are shown.
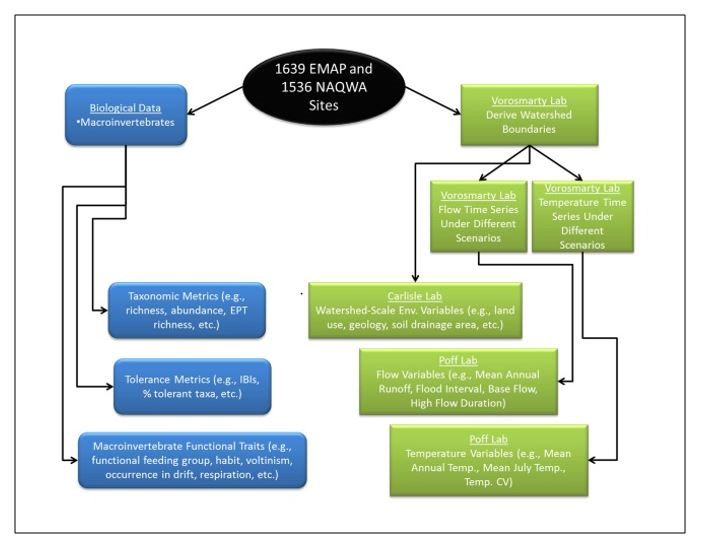
Figure 25. USGS stream gauges with flow and temperature data, in sufficient proximity a
biological stampling site to permit habitat assessment.
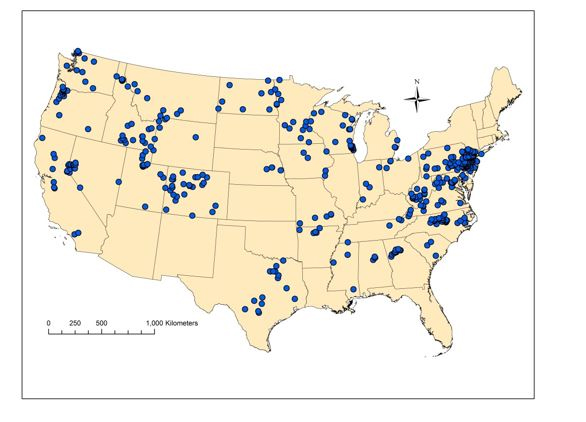
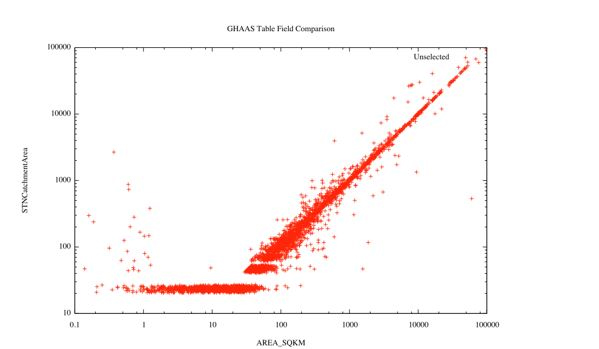
Figure 26 shows the relationship between derived and actual watershed areas. This figure indicates no predictive ability for watershed delineation when actual watershed area is smaller than pixel size (24 km2). It also shows increasing accuracy as actual watershed size increases. This relationship allows us to exclude smaller watersheds from our analysis.
Figure 26. Relationship between actual watershed size (x-axis) and derived watershed
size (y-axis).
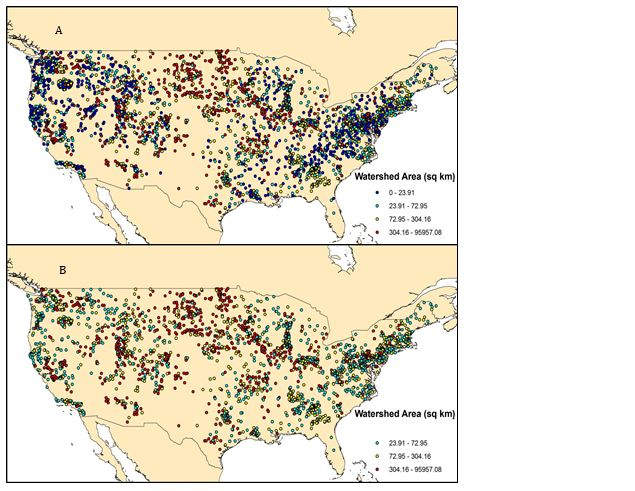
All NAQWA and W-EMAP sites are shown in the figures below. Sites with watershed areas smaller than 24 km2 appear to be concentrated in the mountainous areas of the eastern and western United States. Figure 27 shows the distribution of watersheds with estimated area greater than 24 km2. There will still be adequate coverage of sites across the United States.
Figure 27. Location of W-EMAP and NAQWA sites before (A) and after (B)
sites with watershed areas smaller than 24 km2 are removed.
For each watershed, the UNH group (R. Stewart, W. Wollheim) has provided projected daily flow and temperature data from 2000-2010 for each watershed and currently is developing projected flow and temperature estimates due to climate change. The CSU team will use the daily discharge and temperature data to derive flow and temperature metrics, which reflect the community and functional characteristics of stream macroinvertebrate communities. We will derive flow metrics such as Mean Annual Flow, mean flow for each month. These metrics reflect the availability of water to the stream ecosystem. Other metrics will reflect the stability and extreme conditions in the stream system, such as the coefficient of variation in daily flows, 7-day maxima, 7-day minima, and count and duration of high and low flow pulses. Extreme flow conditions can have a strong influence on stream fauna. For example, a preliminary analysis of 256 EPA sites reveals that streams with more unstable flow regimes (reflected in CV of flow) have more species with fast development times, greater generations per year, very short life spans, high dispersal, higher propensity to drift, and small size, all traits of organisms adapted to extreme conditions in streams.
CSU also plans to derive metrics from temperature data, particularly annual mean temperature, mean temperature for each month, and minimum and maximum temperatures. Air temperature is strongly correlated with stream temperature, which in turn has very strong influence on stream fauna. Warmer streams have more thermally tolerant species with longer lives, but still able to produce multiple generations per year. We will be able to modify these metrics according to current climate change and anthropogenic disturbance scenarios and make predictions of shifts in community composition according to each scenario.
References:
Beaulieu, J.; Hamilton, S.; Wollheim, W.; Hall, R.; Mulholland, P. J.; Ashkenas, L. R.; Cooper, L. W.; Dahm, C. N.; Dodds, W.; Grimm, N. B.; Johnson, S. L.; McDowell, W. H.; Poole, G. C.; Valett, H. M.; Arango, C. P.; Bernot, M. J.; Burgin, A. J.; Crenshaw, C. L.; Helton, A. M.; Johnson, L. T.; O'Brien, J. M.; Potter, J. D.; Sheibley, R. W.; Sobota, D. J.; Thomas, S. M. Nitrous oxide emission from denitrification in stream and river networks. Proceedings of the National Academy of Sciences 2011;108: 214-219.
Beven K.J., Binley A.M. The future of distributed models: model calibration and uncertainty prediction. Hydrological Processes 1992;6:279-298.
Dingman, S. L. Analytical derivation of at-a-station hydraulic geometry relations. Journal of Hydrology 2007;334:17-27.
Döll, P. E., B. Lehner. Validation of a new 30-min drainage direction map. Journal of Hydrology 2002;258:214-231.
Fekete, B. M.; Vörösmarty, C. J.; Lammers, R. B. Scaling gridded river networks for macro-scale hydrology: Development and analysis and control of error. Water Resources Research 2001;37:1955-1968.
Fekete, B. M.; Vörösmarty, C. J.; Roads, J.; Willmott, C. Uncertainties in precipitation and their impacts on runoff estimates. Journal of Climatology 2004;17:294-303.
Fekete, B. M.; Wisser, D.; Kroeze, C.; Mayorga, E.; Bouwman, L.; Wollheim, W. M.; Vörösmarty, C. J. Millennium Ecosystem Assessment scenario drivers (1970-2050): climate and hydrological alterations. Global Biochemical Cycles 2010:24.
Fekete, B. M., R. B. Lammers, A. M. MacDonald, L. C. Bowling; R. Lawford. River discharge [State of the Climate in 2009]. Bulletin of the American Meteorological Society 2010:91:S35.
Fekete, B. M., A. M. MacDonald. River discharge [State of the Climate in 2010]. Bulletin of the American Meteorological Society 2011;92:S46-S48.
Hempel, S., K. Frieler, L. Warszawski, J. Schewe, and F. Piontek. A trendpreserving bias correction – the ISI-MIP approach. Earth System Dynamics Discussions 2013;4(1):49–92, doi:10.5194/esdd-4-49-2013. [online] Available from: http://www.earth-syst-dynam-discuss.net/4/49/2013/ Exit (Accessed 15 February 2013.)
Julian, J.P., Doyle, M.W., Stanley, E.H. Empirical modeling of light availability in rivers. Journal of Geophysical Research – Biogeosciences 2008;113:G03022, doi:10.1029/2007JG000601.
Kalnay, E. et al. The NCEP/NCAR 40-year reanalysis project. Bulletin of the American Meteorological Society 1996;77:437-471, doi:10.1175/1520-0477(1996)077.
Kistler, R. et al. The NCEP/NCAR 50-year reanalysis: Monthly means CD-ROM and Documentation. Bulletin of the American Meteorological Society 2001;82:247-267, doi:10.1175/1520-0477(2001)082.
Lehner, B.; Verdin, K.; Jarvis, A. New global hydrography derived from spaceborne elevation data. AGU EOS Transactions 2008;89:93-94.
Moss, R. H. et al. The next generation of scenarios for climate change research and assessment. Nature 2010;463(7282):747-756, doi:10.1038/nature08823.
Pellerin, B. A., W. M. Wollheim, X. H. Feng, C. J. Vorosmarty. The application of electrical conductivity as a tracer for hydrograph separation in urban catchments. Hydrol. Processes 2007;22(12):1810-1818.
Raymond, P. A.; J. E. Saiers. Event controlled DOC export from forested watersheds. Biogeochemistry 2010; DOI: 10.1007/s10533-010-9416-7.
Rychtecka, M. Spatio-temporal impact of wastewater point sources on nitrogen pollution in U.S. watersheds. M.S. Thesis, The City College of New York, 2011.
Mulholland, P. J.; Helton, A. M.; Poole, G. C.; Hall, R. O.; Hamilton, S. K.; Peterson, B. J.; Tank, J. L.; Ashkenas, R. L.; Cooper, L. W.; Dahm, C. N.; Dodds, W. K.; Findlay, S. E. G.; Gregory, S. V.; Grimm, N. B.; Johnson, S. L.; McDowell, W. H.; Meyer, J. L.; Valett, H. M.; Webster, J. R.; Arango, C. P.; Beaulieu, J. J.; Bernot, M. J.; Burgin, A. J.; Crenshaw, C. L.; Johnson, L. T.; Niederlehner, B. R.; O'Brien, J. M.; Potter, J. D.; Sheibley, R. W.; Sobota, D. J.; Thomas, S. M. Stream denitrification across biomes and its response to anthropogenic nitrate loading. Nature 2008;452:202-205.
Poff, N. L., J. D. Olden, N. K. M. Vieira, D. S. Finn, M. P. Simmons, B. C. Kondratieff. Functional trait niches of North American lotic insects: traits-based ecological applications in light of phylogenetic relationships. Journal of the North American Benthological Society 2006;25:730-755.
Schiermeier, Q. Models hone picture of climate impacts. Nature 2012;482:286, doi:10.1038/482286a.
Siebert, S.; Doll, P. Quantifying blue and green virtual water contents in global crop production as well as potential production losses without irrigation. Journal of Hydrology 2010;384:198-217.
Vörösmarty, C. J.; Federer, C. A.; Schloss, A. L. Potential evaporation functions compared on US watersheds: Possible implications for global-scale water balance and terrestrial ecosystem modeling. Journal of Hydrology 1998;207:147-169.
Vörösmarty, C. J.; Fekete, B. M.; Meybeck, M.; Lammers, R. B. Global system of rivers: Its role in organizing continental land mass and defining land-to-ocean linkages. Global Biochemical Cycles 2000;14:599-621.
Wisser, D.; Frolking, S.; Douglas, E. M.; Fekete, B. M.; Vörösmarty, C. J.; Schumann, A. H. Global irrigation water demand: Variability and uncertainties arising rom agricultural and climate data sets. Geophysical Research Letters 2008;35, doi:10.1029/2008GL035296.
Wisser, D.; Fekete, B. M.; Vörösmarty, C. J.; Schumann, A. H. Reconstructing 20th century global hydrography: A contribution to the Global Terrestrial Network- Hydrology (GTN-H). Hydrology and Earth System Sciences 2010a;14:1-24.
Wisser, D.; Frolking, S.; Douglas, E.; Fekete, B. M.; Schuman, A. H.; Vörösmarty, C. J. The significance of local water resources captured in small reservoirs for crop production - a global-scale analysis. Journal of Hydrology 2010b;384:264-275.
Wollheim, W. M.; Peterson, B. J.; Vörösmarty, C. J.; Hopkinson, C. S.; Thomas, S. A. Dynamics of N removal over annual time scales in a suburban river network. Biogeosciences 2008a;G03038, doi:10.1029/2007JG000660.
Wollheim, W. M.; Vörösmarty, C. J.; Bouwman, A. F.; Green, P. A.; Harrison, J.; Linder, E.; Peterson, B. J.; Seitzinger, S.; Syvitski, J. P. M. Global N removal by freshwater aquatic systems: a spatially distributed, within-basin approach. Global Biochemical Cycles 2008b;GB2026, doi:10.1029/2007GB002963.
Journal Articles on this Report : 12 Displayed | Download in RIS Format
| Other project views: | All 69 publications | 13 publications in selected types | All 12 journal articles |
|---|
| Type | Citation | ||
|---|---|---|---|
|
|
Alexander RB, Bohlke JK, Boyer EW, David MB, Harvey JW, Mulholland PJ, Seitzinger SP, Tobias CR, Tonitto C, Wollheim WM. Dynamic modeling of nitrogen losses in river networks unravels the coupled effects of hydrological and biogeochemical processes. Biogeochemistry 2009;93(1-2):91-116. |
R834187 (2010) R834187 (2011) R834187 (2012) R834187 (2013) R834187 (Final) R833261 (2008) R833261 (2009) R833261 (2010) R833261 (Final) |
Exit Exit Exit |
|
|
Bain DJ, Hale RL, Wollheim WM. Hotbeds of biogeochemical diversity:insights from urban long-term ecological research sites. Elements 2012;8(6):435-438. |
R834187 (2013) R834187 (Final) |
Exit Exit |
|
|
Beaulieu JJ, Tank JL, Hamilton SK, Wollheim WM, Hall Jr. RO, Mulholland PJ, Peterson BJ, Ashkenas LR, Cooper LW, Dahm CN, Dodds WK, Grimm NB, Johnson SL, McDowell WH, Poole GC, Valett HM, Arango CP, Bernot MJ, Burgin AJ, Crenshaw CL, Helton AM, Johnson LT, O'Brien JM, Potter JD, Sheibley RW, Sobota DJ, Thomas SM. Nitrous oxide emission from denitrification in stream and river networks. Proceedings of the National Academy of Sciences of the United States of America 2011;108(1):214-219. |
R834187 (2010) R834187 (2011) R834187 (2012) R834187 (2013) R834187 (Final) R833261 (2010) R833261 (Final) |
Exit Exit Exit |
|
|
Green MB, Wollheim WM, Basu NB, Gettel G, Rao PS, Morse N, Stewart R. Effective denitrification scales predictably with water residence time across diverse systems. Nature Precedings 2009;3520.1. |
R834187 (2010) R834187 (2011) R834187 (2012) R834187 (2013) R834187 (Final) R833261 (2009) R833261 (2010) R833261 (Final) |
Exit Exit Exit |
|
|
Hale RL, Hoover JH, Wollheim WM, Vorosmarty CJ. History of nutrient inputs to the northeastern United States, 1930–2000. Global Biogeochemical Cycles 2013;27(2):578-591. |
R834187 (2012) R834187 (2013) R834187 (Final) |
Exit Exit Exit |
|
|
Hanley KW, Wollheim WM, Salisbury J, Huntington T, Aiken G. Controls on dissolved organic carbon quantity and chemical character in temperate rivers of North America. Global Biogeochemical Cycles 2013;27(2):492-504. |
R834187 (2012) R834187 (Final) |
Exit Exit Exit |
|
|
Harrison JA, Maranger RJ, Alexander RB, Giblin AE, Jacinthe P-A, Mayorga E, Seitzinger SP, Sobota DJ, Wollheim WM. The regional and global significance of nitrogen removal in lakes and reservoirs. Biogeochemistry 2009;93(1-2):143-157. |
R834187 (2010) R834187 (2011) R834187 (2012) R834187 (2013) R834187 (Final) R833261 (2008) R833261 (2009) R833261 (2010) R833261 (Final) |
Exit |
|
|
Helton AM, Poole GC, Meyer JL, Wollheim WM, Peterson BJ, Mulholland PJ, Bernhardt ES, Stanford JA, Arango C, Ashkenas LR, Cooper LW, Dodds WK, Gregory SV, Hall Jr. RO, Hamilton SK, Johnson SL, McDowell WH, Potter JD, Tank JL, Thomas SM, Valett HM, Webster JR, Zeglin L. Thinking outside the channel: modeling nitrogen cycling in networked river ecosystems. Frontiers in Ecology and the Environment 2011;9(4):229-238. |
R834187 (2010) R834187 (2011) R834187 (2012) R834187 (2013) R834187 (Final) R833261 (2010) R833261 (Final) |
Exit Exit Exit |
|
|
Miara A, Vorosmarty CJ. A dynamic model to assess tradeoffs in power production and riverine ecosystem protection. Environmental Science: Processes & Impacts 2013;15(6):1113-1126. |
R834187 (2012) R834187 (2013) R834187 (Final) |
Exit Exit |
|
|
Miara A, Vorosmarty CJ, Stewart RJ, Wollheim WM, Rosenzweig B. Riverine ecosystem services and the thermoelectric sector:strategic issues facing the Northeastern United States. Environmental Research Letters 2013;8(2):025017 (11 pp.). |
R834187 (2012) R834187 (2013) R834187 (Final) |
Exit Exit Exit |
|
|
Stewart RJ, Wollheim WM, Miara A, Vorosmarty CJ, Fekete B, Lammers RB, Rosenzweig B. Horizontal cooling towers: riverine ecosystem services and the fate of thermoelectric heat in the contemporary Northeast US. Environmental Research Letters 2013;8(2):025010. |
R834187 (2012) R834187 (2013) R834187 (Final) |
Exit Exit Exit |
|
|
Wollheim WM, Green MB, Pellerin BA, Morse NB, Hopkinson CS. Causes and consequences of ecosystem service regionalization in a coastal suburban watershed. Estuaries and Coasts 2015;38(Suppl 1):19-34. |
R834187 (2013) R834187 (Final) |
Exit Exit Exit |
Supplemental Keywords:
regionalization, climate change, climate variability, hydrology, aquatic habitat, indicators, water quality, risk assessment, climate models;, RFA, Air, climate change, water quality, environmental monitoring, modeling, water resourcesProgress and Final Reports:
Original AbstractThe perspectives, information and conclusions conveyed in research project abstracts, progress reports, final reports, journal abstracts and journal publications convey the viewpoints of the principal investigator and may not represent the views and policies of ORD and EPA. Conclusions drawn by the principal investigators have not been reviewed by the Agency.