
Grantee Research Project Results
Final Report: Drinking Water Quality and Emergency Visits for Gastroenteritis in Atlanta
EPA Grant Number: R831629Title: Drinking Water Quality and Emergency Visits for Gastroenteritis in Atlanta
Investigators: Tolbert, Paige , Singer, Philip C. , Moe, Christine L. , Amirtharajah, A. , Flanders, Dana , Uber, Jim , Klein, Mitchel , Tinker, Sarah , Hooper, Stuart
Institution: Emory University , University of Cincinnati , University of North Carolina at Chapel Hill , Georgia Institute of Technology
Current Institution: Emory University , Georgia Institute of Technology , University of Cincinnati , University of North Carolina at Chapel Hill
EPA Project Officer: Page, Angela
Project Period: September 1, 2004 through August 31, 2007 (Extended to August 31, 2008)
Project Amount: $1,223,366
RFA: Microbial Risk in Drinking Water (2003) RFA Text | Recipients Lists
Research Category: Drinking Water , Human Health , Water
Objective:
The objective of this research was to assess the relationship between drinking water quality and the incidence of gastrointestinal (GI) illness and in particular to focus on the role of the distribution system in the degradation of water quality.
Summary/Accomplishments (Outputs/Outcomes):
Overall objectives and aims
We addressed the objectives of our project through three primary analyses, the purposes of which were to:
- Assess the association between rates of ED visits for GI illness and estimated residence times of drinking water serving the study area;
- Assess heterogeneity in the rates of ED visits for GI illness among the service areas of different drinking water treatment plants; and
- Assess the temporal association between daily counts of ED visits for GI illness and drinking water turbidity.
Within the context of these primary analyses, we were also able to address our other research aims, which were to:
- Assess whether changes in drinking water treatment practices over time were reflected in changes in drinking water quality or the incidence of GI illness;
- Assess the association between drinking water quality and GI illness among susceptible subgroups; and
- Estimate the population attributable fraction of ED visits for GI illness due to microbial contamination of drinking water.
Aim 1
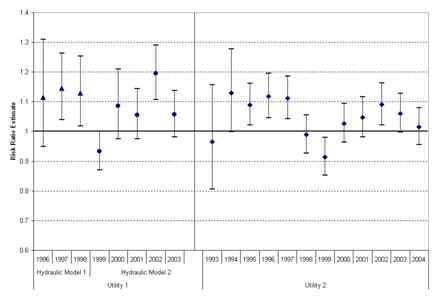
In the analysis in which we addressed the first of the above-listed research aims, we examined whether the average water residence time for a Zip Code was related to the proportion of ED visits for GI illness among residents of that Zip Code. ED data were collected from all hospitals located in the five-county Atlanta-metro area Crom 1993 to 2004. Two of the largest drinking water utilities in the city, together serving 1.7 million people, were considered. People served by these utilities had almost 3 million total ED visits, 164,937 of them for GI illness. For one utility, two hydraulic models were used to estimate water residence time; one covered 1996 to 1998 and another covered 1999 to 2003. A single hydraulic model was used to estimate water residence times from 1993 to 2004 for the other utility. The relationship between water residence time and GI illness risk was assessed using unconditional logistic regression, controlling for potential confounding factors, including age, year, hospital, distance from Zip Code to hospital, and markers of SES. Analyses were stratified by the hydraulic model used to derive the residence time estimates. The odds ratios comparing GI illness risk among residents of Zip Codes with short average water residence time (10th percentile or less) to risk among those in Zip Codes with intermediate average water travel time (11th to 89th percentile) suggested little or no association. However, odds ratios for residents of Zip Codes in the top decile of average water residence times compared to residents of Zip Codes with intermediate average residence times suggested modestly increased risk for GI illness (odds ratio (OR) for Utility 1 = 1.07, 95% confidence interval (CI) = 1.03, 1.10; OR for Utility 2 = 1.05, 95% CI = 1.02, 1.08). Effect measure modification by year was suggested for both utilities and by season and age group for Utility 2. The results suggest that drinking water contamination in the distribution system may contribute to the burden of endemic GI illness.
Table 1: Descriptive statistics of estimated drinking water residence time by year, in hours, summarized over Zip Codes, Atlantaa
|
Short water residence time exposure categoryb Mean (Min – Max) |
Intermediate water residence time categoryb Mean (Min – Max) |
Long residence water time categoryb Mean (Min – Max) |
|
|
Utility 1, Hydraulic Model 1c |
6.83 (4.54 – 8.28) | 21.96 (8.34 – 36.37) | 47.40 (37.61 – 68.46) |
|
Utility 1, Hydraulic Model 2d |
10.12 (9.14 – 11.18) | 33.43 (11.19 – 51.78) | 74.41 (52.20 – 88.36) |
| Utility 2e | 5.85 (4.74 – 8.57) | 18.45 (8.62 – 40.29) | 60.39 (40.31 – 144.06) |
a Two utilities considered
b Short water residence time defined as ≤ 10th percentile of all water residence time estimates, stratified by hydraulic
model; intermediate = 11th to 89th percentile; long = ≥ 90th percentile
c 1996 – 1998
d 1999 – 2003
e 1993 – 2004
Figure 1: Risk ratio estimates for gastrointestinal illness emergency department visits among people living in Zip Codes with short* drinking water residence times and long* drinking water residence times compared to intermediate* drinking water residence times, metro Atlanta†, stratified by utility

* Short water residence time defined as ≤ 10th percentile of all water residence time estimates, stratified by
hydraulic model; intermediate = 11th to 89th percentile (referent category); long = ≥ 90th percentile
† Two utilities considered
Figure 2: Risk ratio estimates for gastrointestinal illness emergency department visits among people living in Zip Codes with long* drinking water residence times compared to intermediate* drinking water residence times, metro Atlanta†, stratified by year
* Intermediate water residence time defined as 11th to 89th percentile of all water residence time estimates,
stratified by hydraulic model (referent category); long = ≥ 90th percentile
† Two utilities considered
Figure 3: Risk ratio estimates for gastrointestinal illness emergency department visits
among people living in Zip Codes with short* drinking water residence times and long*
drinking water residence times compared to intermediate* drinking water residence times,
metro Atlanta†, stratified by season, Utility 2 only

* Short water residence time defined as ≤ 10th percentile of all water residence time estimates, stratified by
hydraulic model; intermediate = 11th to 89th percentile (referent category); long = > 90th percentile
† Results for one utility presented here.
Figure 4: Risk ratio estimates for gastrointestinal illness emergency department visits among people living in Zip Codes with short* drinking water residence times and long* drinking water residence times compared to intermediate* drinking water residence times, metro Atlanta†, stratified by age group, Utility 2 only

* Short water residence time defined as ≤ 10th percentile of all water residence time estimates, stratified by
hydraulic model; intermediate = 11th to 89th percentile (referent category); long = > 90th percentile
† Results for one utility presented here.
Aim 2
To address the second study aim, we compared rates of ED visits for GI illness among people served by different drinking water treatment plants. Using Poisson regression, we analyzed data on almost 4 million ED visits from 27 hospitals. We also examined treatment plant attributes and changes in treatment methods over time that could plausibly contribute to differences in finished water quality and risk of GI illness. We observed modest differences in the rates of ED visits for GI illness among those served by different treatment plants. People living in the service area of one plant had a small but statistically significant elevation in the rate of ED visits for GI illness relative to people living in the service areas of the other plants (Rate Ratio (RR) = 1.05, 95% CI = 1.03, 1.08). We identified several operational conditions that may have contributed to poorer water quality at this plant during certain parts of the study period. Over time, several improvements were made to the plant and its operation, and these changes may be reflected in the reduced relative rates we observed for this plant during the later parts of our study period. These results suggest that heterogeneity of rates for GI illness among people served by different treatment plants in Atlanta may be partially explained by differences in treatment plant operation and resulting water quality.
Table 2. Adjusted rate ratio estimates for emergency department visits for gastrointestinal illness among people served by any one drinking water treatment plant compared to all other treatment plants, and attributes of the drinking water treatment plants in the five-county metro-Atlanta area, 1993-2004.
|
Treatment Plant |
Total Non-Injury ED Visits |
ED Visits for GI Illness (% of Total) |
Rate Ratio*,†,‡ |
Production Capacity (MGD§) |
Source Water Type |
Treatment Method|| |
Disinfectant |
Coagulant |
Watershed Susceptibility# |
Mean Daily Maximum Raw Water Turbidity** (NTU††) |
Mean Daily Average Filtered Water Turbidity‡‡ (NTU) |
| A | 193,186 | 18,192 (9.4) | 0.98 (0.96, 1.00§§) | 90 | River | Conventional | Chlorine | Alum | Medium | 6.5 | 0.03 |
| B | 755,806 | 68,040 (9.0) | 0.99 (0.98, 1.01) | 128 | River | Conventional | Chlorine | Alum | Medium | 13.5 | 0.06 |
| C|| || | 45,745 | 3,301 (7.2) | 1.03 (0.99, 1.07) | 65 | River | Conventional | Chlorine | Alum | High | 55.0 | 0.07 |
| D## | 27,306 | 2,172 (8.0) | 1.00 (0.94, 1.10) | Plant 1 = 20 Plant 2 = 10 | Creek-fed reservoir; LAS *** | Conventional | Chlorine, UV | Alum | Medium | 4.2 | 0.08 |
| E|| || | 505,951 | 36,561 (7.2) | 0.98 (0.96, 1.00§§) | 137 | River | Conventional | Chlorine | Alum | High | 11.9 | 0.10 |
| F | 580,703 | 53,266 (9.2) | 1.05 (1.03, 1.08) | 150 | Lake | Direct filtration | Chlorine, ozone | Polymer, ferric chloride††† | Low - medium | 1.5 | 0.17 |
| G§§ | 418,674 | 33,969 (8.1) | 1.00 (0.99, 1.02) | 86 | River | Conventional | Chlorine | Alum | High | 22.0 | 0.06 |
| H§§ | 187,451 | 15,461 (8.2) | 1.02 (0.99, 1.04) | 72 | Lake | Conventional | Chlorine | Alum | Medium | 10.3 | 0.08 |
* Adjusted for age group, year, season, hospital, distance from Zip Code to treatment plant, distance from Zip Code to hospital, Zip Code median income, Zip Code percent minority, Medicaid payment status.
† Comparing that plant to all other plants.
‡ 95% confidence interval given in parentheses.
§ Million gallons per day.
|| Conventional treatment: Coagulation, flocculation, sedimentation, filtration, disinfection.
# Standardized assessments conducted by the Atlanta Regional Commission and Georgia Mountains Regional Development Center; based on number of point sources of pollution and measures of non-point source pollution. ** Mean daily maximum raw water turbidity values from hourly measurements taken from 1/1/2002 to 12/31/2004, except for Plant D, for which measurements were only available beginning 3/1/2002.
†† Nephelometric Turbidity Units.
‡‡ Mean daily average filtered water turbidity values from hourly measurements taken from 7/1/1993 to 12/31/2004, except for Plant D, which did not begin operation until late 10/1999, Plant C, for which measurements were available from 1/1/1993 to 12/31/2004, and Plant F, for which measurements were available from 7/1/1993 to 12/31/1999 and 1/1/2002 to 12/31/2004.
§§ Although the 95% confidence intervals include 1.00, the rate ratio estimates for Plants A and E are statistically significant at the traditional alpha value of 0.05. The p-value for these estimates are less than 0.05; the upper 95% confidence intervals equal 1.00 due to rounding.
|| || Plants C and E are operated by the same utility; Plants G and H are operated by the same utility.
## Two plants considered together because their water was mixed prior to distribution.
*** Land application system.
††† Plant used polymer only until 1998, when ferric chloride was added as additional coagulant.
Figure 5: Rate ratioa,b estimates for emergency department visits for gastrointestinal illness among people served by Plant F compared to all other treatment plants, 1993 – 2004
|
|

|

|
|
Journal Articles on this Report : 2 Displayed | Download in RIS Format
| Other project views: | All 13 publications | 2 publications in selected types | All 2 journal articles |
|---|
| Type | Citation | ||
|---|---|---|---|
|
|
Tinker SC, Moe CL, Klein M, Flanders WD, Uber J, Amirtharajah A, Singer P, Tolbert PE. Drinking water residence time in distribution networks and emergency department visits for gastrointestinal illness in Metro Atlanta, Georgia. Journal of Water and Health 2009;7(2):332-343. |
R831629 (Final) |
Exit |
|
|
Tinker SC, Moe CL, Klein M, Flanders WD, Uber J, Amirtharajah A, Singer P, Tolbert PE. Drinking water turbidity and emergency department visits for gastrointestinal illness in Atlanta, 1993-2004. Journal of Exposure Science & Environmental Epidemiology 2010;20(1):19-28. |
R831629 (2007) R831629 (Final) R829213 (Final) R830376 (2006) |
Exit Exit Exit |
Supplemental Keywords:
water, drinking water, exposure, risk, health effects, human health, population, sensitive populations, children, elderly, pathogens, dose-response, public policy, socioeconomic, epidemiology, modeling, Georgia, GA,, Health, RFA, Scientific Discipline, INTERNATIONAL COOPERATION, Water, POLLUTANTS/TOXICS, Health Risk Assessment, Risk Assessments, Environmental Chemistry, Epidemiology, Microorganisms, Drinking Water, health effects, human health, microbial contamination, treatment, gastrointestinal health, water quality, groundwater contamination, human exposure, Atlanta, microbial risk, dietary ingestion exposures, groundwater disinfection, microbial effects, drinking water contaminants, drinking water treatment, groundwater, gastrointestinal health effects, other - risk assessment, waterborne disease, human health effects, human health risk, bacteriaProgress and Final Reports:
Original AbstractThe perspectives, information and conclusions conveyed in research project abstracts, progress reports, final reports, journal abstracts and journal publications convey the viewpoints of the principal investigator and may not represent the views and policies of ORD and EPA. Conclusions drawn by the principal investigators have not been reviewed by the Agency.