


Step 2: Characterize Your Watershed (cont.)
Data Analysis
Once you have filled your data gaps and compiled the most complete data set available, it’s time to analyze what you have. Data analysis is the process by which raw data collected in a monitoring program are turned into information to help meet project objectives. Because data analysis techniques are used to support a variety of goals and involve multiple types of data, a combination of techniques is usually used. Less-detailed analyses, such as evaluating summary statistics, might be conducted for certain pollutants, whereas more detailed analyses might be conducted for others, depending on the goals of the plan and the pollutants of concern. Data analysis is typically an iterative process that is adapted as results are interpreted and additional information is gathered.
Although 305(b) and 303(d) reports provide the necessary information to identify the types of water quality problems occurring in your watershed, it is likely that you will have to analyze available monitoring data yourself to fully characterize and understand the problems. This analysis typically involves comparing available monitoring data to water quality standards but in a way that goes beyond the assessment already completed by the state for section 303(d) and 305(b) assessments. When identifying impaired waterbodies for the 303(d) list, states usually compare available monitoring data to applicable water quality criteria and, on the basis of their listing guidelines and criteria (e.g., percentage of samples above the criteria), determine which waters don’t meet the criteria. In evaluating impairments in your watershed, you don’t want to simply duplicate the state’s efforts. Instead, use the 305(b) and 303(d) information to target your analyses—to identify which waterbodies are impaired or threatened—and begin your analysis there. (You should also include in your analysis those waterbodies identified by stakeholders as degraded but not included in the state assessments.)
A process common to all data analysis is Exploratory Data Analysis (EDA). EDA is an open-ended exploration of a data set, where the analyst summarizes characteristics of the variables and looks for patterns and relationships. Basic tools of EDA include summarizing univariate statistics like mean, median, variance, and standard deviation. Data should be evaluated to determine if they meet requirements for analysis using parametric statistical tools (i.e., normal distribution, independence, and constant variance); the need for data transformation (e.g., log10) should be assessed. Relationships between two variables can be explored by examining scatterplots and calculating correlation coefficients. The overall goal of EDA is to understand the structure and patterns of your data set and to formulate hypotheses that can then be tested by statistical techniques such as t-Test, Analysis of Variance (ANOVA), and regression analysis.
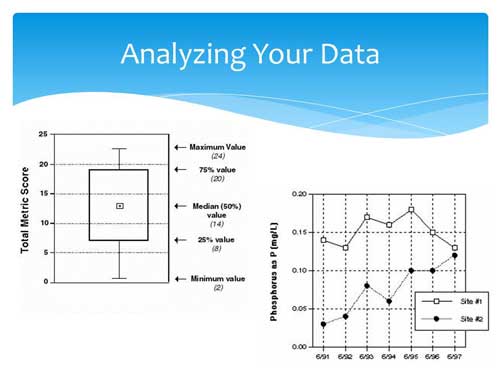
One key element of EDA is graphing. Data plots and graphs are not only critical to identifying patterns in your data, but are also necessary for presenting and reporting on monitoring results. Regardless of what kind of graphs best suit your data—pie charts, histograms, box plots, time series line plots, scatterplots, or regression plots—data should always be plotted.
Together with the input from stakeholders and your local knowledge of the watershed, analyzing your data should lead you to an understanding of where and when problems occur in your watershed and what could be causing the problems. Ideally the data analysis phase will progress in such a manner that each analysis leads to a greater understanding of the problems, causes, and sources—each analysis identifies another piece of the puzzle. This step satisfies element a of the section 319 guidelines—identification of the causes and sources that need to be controlled.