How Is the Global Climate Changing?
Global Temperature Change Scenarios
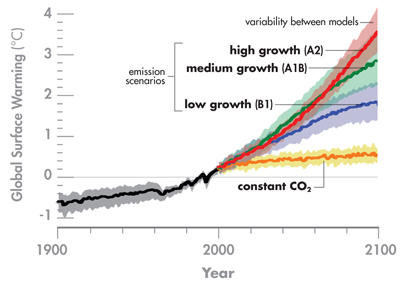
Over the next 100 years, temperature changes are expected to be in the range of 3 °F to 7 °F, but where in this range temperatures actually occur will depend on the actual changes in CO2 concentrations in the atmosphere, and these concentrations will depend on human activities and the success in efforts to control releases of CO2 and other greenhouse gases.
The line graph provides temperature projections to the year 2100, based on a range of emission scenarios and global climate models. Several factors, such as population growth and the implementation of new, cleaner technology, will influence whether temperature increases follow the blue, green or red lines in the graph. Scenarios that assume the highest emission rates of greenhouse gases provide the estimates in the top end of the temperature range. The orange line (constant CO2) projects global temperatures with greenhouse gas concentrations stabilized at year 2000 levels (IPCC, 2007c).
References:
IPCC. 2007c. Climate Change 2007: The Physical Science Basis. Contribution of Working Group I to the Fourth Assessment Report of the Intergovernmental Panel on Climate Change. [Solomon, S., D. Qin, M. Manning, Z. Chen, M. Marquis, K.B. Averyt, M. Tignor, and H.L. Miller (eds.)]. Cambridge University Press, Cambridge, United Kingdom and New York, NY, USA, 996 pp. accessed August 31, 2009.![]()
NASA Earth Observatory, based on IPCC Fourth Assessment Report (2007), accessed August 31, 2009.
Graphic Reference:
NASA Earth Observatory, based on IPCC Fourth Assessment Report (2007) , accessed August 31, 2009.