
Grantee Research Project Results
Final Report: Center for Integrated Multi-scale Nutrient Pollution Solutions
EPA Grant Number: R835568Center: Center for Integrated Multi‐scale Nutrient Pollution Solutions
Center Director: Shortle, James S.
Title: Center for Integrated Multi-scale Nutrient Pollution Solutions
Investigators: Shortle, James S. , Brooks, Robert P. , Boyer, Elizabeth W. , Ready, Richard C , Royer, Matthew B , Bills, Brian , Kemanian, Armen
Institution: Pennsylvania State University , University of Maryland - Eastern Shore , USDA
EPA Project Officer: Packard, Benjamin H
Project Period: September 1, 2013 through August 31, 2018
Project Amount: $2,220,649
RFA: Centers for Water Research on National Priorities Related to a Systems View of Nutrient Management (2012) RFA Text | Recipients Lists
Research Category: Watersheds , Water
Objective:
Objective(s) of the Research: The Center for Integrated Multi-scale Nutrient Pollution Solutions (CNS) is a collaboration of scientists and community partners engaged in a ‘shared discovery’ process to develop an integrated systems approach to enhance the decision making capacity of key water and nutrient management institutional agents. We seek to provide connections between policy directives and on-the-ground actions by moving beyond the old paradigm or ‘BMP fix’ to discover optimal solutions that reduce nutrient pollution through understanding 1) the sources and flow paths of nutrients as they impact water quality and ecosystem function, 2) how individual management practices integrate and aggregate from field to watershed scales and beyond, 3) the importance of including socioeconomic and other local watershed issues, and 4) how this information is translated at different management levels to produce effective action and successful results. Our main objective is to use an integrated decision support process involving modeling, empirical data, and lessons learned to develop community-based, spatially-explicit, nutrient intervention scenarios that engage and inform stakeholders for high impact water management decisions. These intervention scenarios are alternative sets of tactics and strategies for meeting the 2025 nutrient and sediment reduction goals in the Chesapeake Bay (Table 1).
Table 1. Description of CNS scenarios for meeting the 2025 pollution reduction goals in the Chesapeake Bay.
| TYPE | DESCRIPTION |
|---|---|
| Scenario A | Current condition |
| Scenario B | Chesapeake Bay TMDL directives (i.e. WIPs) |
| Scenario C | Multiple candidate “solution sets” designed to (a) identify strategies (e.g., spatial targeting, BMP selection) that achieve regional water quality objectives at low cost; (b) develop heuristics that can enable communities to plan effectively without complex models; and (c) provide data and tests for inter-model comparison. |
| Scenario D | Expand goals of Scenario C to include local water quality and other community objectives |
| Scenario E | Explore the costs and benefits of major economic drivers by transforming nutrient sources across the landscape. |
This process involves several steps, which are carried out via seven team projects: Team1—Drivers and Interventions; Team 2—Harmonizing Models; Team 3—Ecological Assessment; Team 4—Best Management Practices; Team 5—Informatics; Team 6—Economics and Ecosystem Services; and Team 7—Engagement, Education, and Outreach.
Summary/Accomplishments (Outputs/Outcomes):
Summary of Findings:
Major Activities.
Center-wide activities in the first year (2014) consisted of:
- Three all-hands meetings (PSU campus—December 2013 & May 2014; SERC—September 2014) to discuss Center goals and objectives, foster integration within and across research teams, review progress and plan next steps, start scenario building, etc.. The SERC meeting included engagement with the members of the Community Partners Council (CPC) and EPA Project Officer.
- Two meetings, excluding the SERC meeting, with the CPC to 1) introduce the project and discuss CPC engagement and expectations, 2) to report progress and solicit feedback and advice, and 3) introduce scenario concepts and train the CPC to participate in thethird all-hands meeting to develop scenarios.
- Detailed characterizations of the 4 target watersheds: Manokin River, Mahantango Creek, Spring Creek, and Conewago Creek. Watersheds were consistently mapped using 2011 NLCD to visualize landscape condition and patterns in order to compare watershed size (i.e. magnitude of treated land to address for each watershed), dominant land uses, stream networks (including impaired segments), and county/municipal boundaries.
- Research team workshops to foster interdisciplinary discovery and to develop genuine interest across teams. The workshops presented various modeling and ecological methods (e.g., SWAT, SWR, and PIHM/Cycles modeling workshops), nutrient cascades and mass balances, and watershed scenario concepts and development methods.
- Watershed tours to familiarize project members with the 4 target watersheds.
- Developed a CNS website to foster communication and disseminate information to team members, CPC members, stakeholders, and other interested parties. The website will also serve as the respository for all tools and resources developed by the project.
- Launched seminar series titled ‘Science for Solutions: Combating the Wicked Nutrient Problem’. Each seminar was conducted in webinar format with recordings available on the CNS website. Online audiences included stakeholders from academia, government agencies, consulting firms, and nonprofits.
The second year of the project was primarily centered on the following activities:
- Meetings with CNS (all-hands) personnel (September 2014, May 2015), CPC (September 2014, May 2015), watershed stakeholders (March 2015), Science Advisory Committee (March 2015), and other NCER centers (January 2015) to improve integration within and across research teams, review progress and plan next steps, refine scenario building, and foster communication, identify barriers and improve connections between people working at all levels from farm to mid-level management to regional policy.
- Building and running scenarios in the four focal watersheds: Mahantango Creek, Spring Creek, Conewago Creek, and Manokin River. Using feedback obtained from our all-hands meeting with the Community Partners Council (CPC) in September 2014, we finalized our multiple scenario approach for each watershed, which consists of the following 5 scenarios:Scenario A (Baseline analysis), Scenario B ( Implementation of the Chesapeake Bay WIPs), Scenario C (Smart WIP implementation emphasizing low-cost, efficient tactics and strategies), Scenario D (Implement tactics and strategies to meet multi-objective local watershed goals), and Scenario E (Transformational strategies). We first tested the scenario building process by initially applying scenarios A, B, and C on a small sub-watershed of Mahantango Creek (WE38—the USDA ARS’ intensive study watershed). The main purpose of this step was to confirm the specific steps necessary to complete a scenario, including flows between teams.
- Chesapeake Bay Program (CBP) model land use and management translations: In order to make more informed, strategic watershed management decisions, we need tools that operate on more precise spatial scales than the CBP model (i.e., SWAT and PIHM/Cycles models). Working with modelers at the CBP, who provided both current (2012) and projected (2025) WIP BMP implementation data, we first translated the CBP model land use and management regimes that lack spatial reference into options that could be placed on the ground by CNS models. We then translated the CNS model results back to the CBP model and TMDL progress.
- Final selection and communication with the Scientific Advisory Committee (SAC). CNS leaders met with the SAC to introduce the CNS, discuss SAC roles in the project, and determine next steps for interaction between SAC and CNS members.
- Initiation of watershed stakeholder meetings, which provided additional detail on current management and agricultural operations in each watershed. They also helped to identify priority BMPs or strategies and target locations, as well as identify local priorities and objectives for use in Scenario D (implementation of local watershed objectives). Meetings were held in the Manokin River and Conewago Creek watersheds. Refer to Team 7 progress for more details.
- Continuation of CNS seminar series titled ‘Science for Solutions: Combating the Wicked Nutrient Problem’. Each seminar was conducted in webinar format with recordings available on the CNS website. Online audiences included stakeholders from academia, government agencies, consulting firms, and nonprofits.
During the third year (2016) of the project, the Center focused primarily on (1) wrapping up Scenarios A and B, and (2) finalizing the approaches and steps for running Scenario C (smart WIP implementation emphasizing low-cost, efficient tactics and strategies), Scenario D (implement tactics and strategies to meet multi-objective local watershed goals), and Scenario E (transformational strategies) in our focal watersheds. Local watershed concerns and suggestions for the overall project were obtained from our watershed stakeholders (Spring Creek meeting on November 4th, 2015 and Mahantango Creek meeting on April 26, 2016) and our CPC and SAC members (all-hands meeting held December 4-5th, 2015 in Harrisburg, Pennsylvania). This information formed the basis for the final revisions made to the latter scenario runs. As each team worked on their individual tasks through the winter, spring and summer of 2016, internal project meetings were held regularly to go over each team’s results and discuss how those results could be used by other teams and integrated to form the major findings, messages, and lessons learned from the project.
During the final year of the project we re-connected with each of our watershed stakeholder groups to present and discuss scenario results and other watershed issues and held a workshop in June 2018 to disseminate these results to the public.
Significant Findings:
Key outcomes and achievements are summarized by project and combined to reveal the following:
- Nutrient accounting helps to raise awareness of the sources of nutrients and the problems caused by nutrient pollution, while nutrient budgets provide a framework for benchmarking the current situation and for assessing future progress. Quantifying the fluxes remains challenging and highlights the need for long term monitoring & data availability.
- Inputs of nutrients to the mid-Atlantic region have been increasing, largely due to human activities associated with agricultural food production and, to a lesser extent, fossil fuel combustion.
- Multiple modeling and ecosystem approaches indicate that space, place, and time of stressor and management-related activities matter greatly.
- The economic returns from local nutrient interventions reflect a cascade of accumulating benefits as water quality is improved through downstream stream systems and the Chesapeake Bay.
- Stakeholder meetings indicate that local communities are not being effectively informed and engaged in state and regional level planning.
Conclusions:
Subproject Summaries:
Project 1: Drivers and Interventions
Subproject: this is subproject number 001, established and managed by the Center Director under grant RD83556801
Investigators: Elizabeth Boyer, Jeff Grimm, Dan Liptzin
Institution(s) of PI(s): Pennsylvania State University
Objective(s) of the Research:
Nutrient discharges into surface waters derive from many different sources, land-uses, and locations across the watersheds. Team 1 contributed to the CNS with a regional-scale, systematic account of the sources and sinks of nutrients (primarily nitrogen) that impact watersheds in the Mid-Atlantic region. This approach provides a scientific perspective from which to understand drivers of the nutrient pollution problems and to explore potential intervention strategies and tactics to mitigate nutrient pollution problems. Specific objectives were to: (1) develop nutrient input budgets, using a systematic nutrient accounting approach, at multiple spatial scales; and (2) use the nutrient budgets to explore fundamental drivers of nutrient pollution, and to evaluate the effects of potential interventions to mitigate nutrient pollution problems.
Summary of Findings:
Major Activities. We developed a contemporary account of nitrogen in the Mid-Atlantic region. We have completed calculations for 2002, and for 2012. Nitrogen inputs include deposition, fertilizer, fixation, and tranfers in food & feed (including information on human consumption, crop and animal production, animal manure, human waste (septic and sewer). Results are reported by state, and by hydrologic unit code. Toward quantifying atmospheric inputs to the budgets, we developed high resolution models of wet nitrogen deposition to the Chesapeake Bay, for nitrate and ammonium, from 1983-2014. We compared our estimates to lower resolution simulations from EPA models (CMAQ, TDEP). We quantified differences in the wet deposition simulations using high-spatial-resolution synoptic precipitation data (from radar) to lower-spatial-resolution synoptic precipitation data (from NLADS-2) that is used in the Chesapeake Bay model. We estimated dry atmospheric nitrogen deposition. The Chesapeake Bay Program is using our data in their model (high resolution simulations forced by NLDAS-2), and results were delivered to Bay Program staff. In a separate, but related project, we quantified inputs of organic matter (including N) to watersheds; to fill in missing information; where total N inputs must include wet+dry; and inorganic+organic species. To explore processes the control of nutrients in stream and river corridors, we considered relationships between nitrogen inputs to watersheds (from all sources) and nitrogen exports (to rivers at the watershed outlets) at multiple spatial and temporal scales; and by land use (agricultural, forested, urban). Further, we quantified factors affecting riverine N loads in the LTAR focal catchments.
Key Outcomes and Achievements. (1) Nutrient accounting helps to raise awareness of the sources of nutrients and the problems caused by nutrient pollution. (2) Nutrient budgets provide a framework for benchmarking the current situation and for assessing future progress. (3) Quantifying the fluxes remains challenging and highlights the need for long term monitoring & data availability. (4) Space and place matters: a targeted approach may be beneficial toward solving nitrogen pollution problems. (5) Inputs of nutrients to the mid-Atlantic region have been increasing, largely due to human activities associated with agricultural food production and, to a lesser extent, fossil fuel combustion. (6) Despite the obvious benefits of a plentiful supply of food & energy, the adverse consequences associated with the accumulation of reactive nitrogen in the environment are large, with implications for human health and the environment. (7) The greater the inputs of nutrients the landscape, the greater the potential for negative effects, including greenhouse gas production, ground level ozone, acid rain, degradation of soils and vegetation, acidification of river, lakes & streams, and coastal hypoxia & eutrophication. (8) Substantial efforts are needed in order to mitigate or reverse the effects of nutrient pollution in the Chesapeake Bay and its watershed. Conservation of natural resources in their native state, watershed management with BMPs, engineering approaches to treat and recover livestock waste, improved motor vehicle efficiencies, improved use of fertilizers, better landscapes, creation of wetlands, reductions in airborne emissions, and advances in wastewater treatment may all be beneficial.
Project 2: Harmonizing Data and Decision Support Systems
Subproject: This is subproject number 002, established and managed by the Center Director under grant RD83556801.
Investigators: Armen Kemanian, Chris Duffy, Felipe Montes, Lorne Leonard, Elizabeth Boyer, Tom Richard, Yuning Shi, and Amanda Ramcharan
Institution(s) of PI(s): Pennsylvania State University
Summary
Objective(s) of the Research: In the United States many fresh and estuarine waters remain polluted because efforts and technologies to reduce nutrient leakage have not kept pace with the growth of nutrient inputs in the landscape. Nutrient average loadings to a watershed and exports via stream leaving a watershed provide a big picture of the magnitude of the excesses and the fraction of nutrient exported, but cannot provide spatially-explicity information on the nutrient pathways from application to loss to surface or ground water. Current advances in modeling nutrient fate and transport coupled with ongoing advances in big data management are opening new and promising opportunities for assessing and visualizing the impact of land use practices on water quality and overall ecosystem health. Team 2’s main objective were to:
1)or develop new models for spatially-explicit modeling of agricultural practices and nutrient fate in agroecosystem. We proposed to couple a distributed database (Hydroterre) with a fully distributed hydrological model (Penn State Integrated Hydrologic Model or PIHM) and an agro-ecosystem model (Cycles), with applications in the watersheds that are the target of CNS activities (Spring Creek, Mahantango Creek, and Conewago Creek watersheds). These watersheds cover a wide range of agroecological conditions in the Mid-Atlantic Region (MAR), and will constitute our first step towards developing a model available for the whole nation. Our conceptual proposition is that in the long-term, the tools of choice for analyzing such watersheds will be fully distributed biophysical models that are able to integrate multiple data sources along with dynamic simulations at stable, continuous, and scalable spatial and temporal scales. To get modeling applications to the townhall meeting requires substantial cyberinfrastructure as well as clean workflows for both data flow and model operation.
2) Advance multi-model comparisons to provide practical assessments of the expected changes in water quality associated to changes in land use and management practices. There are multiple models to assess changes in water quality. Due to differences in design and application scale, there is no method to compatibilize outputs form different models. A user can easily find conflicting results. In addition, the level expertise to both run models and interpret results vary among individuals. We propose to compare the outputs of different models when applied at similar scales. Candidate models for the inter-comparison are the EPA Chesapeake Bay Model (CBM), the USDA Soil and Water Assessment Tool (SWAT), the USGS Sparrow model, and the PSU PIHM model. The comparison will include water, carbon, nitrogen, and phosphorous dynamics depending on the characteristics of the scenarios and the models and being compared. The model inter-comparison can help characterize the uncertainty around modeled results, but it remains a challenging task.
Summary of Findings:
Major Activities.
- Objective 1: database and model fusion. We expanded the Hydroterre webservice, adding the Gridded Soil Survey Geographic Database (GSSURGO) in PIHM- compatible format and added an algorithm to read and update the NLDAS climate database to feed models. We fused the PIHM and Cycles models to create a fused version (C-PIHM). Through this processes, we also develop algorithms to make stream segments and grids for distributed simulations that are compatible with time and spatial scales needed for distributed modeling.
- Objective 2. Multi-model comparison and applications. We completed model calibration of WE38, a small sub-watershed of Mahantango Creek containing very detailed historic data measurements), generated grids with varying resolution for the Mahantango Creek Watershed (a within-model comparison), and advanced grid development for the other three watersheds. Developing a simulation model in PIHM for the Manokin, a relatively flat landscape in the Coastal Plain, has been difficult, requiring utilization of the drainage ditch network. We also extracted SPARROW data from the online tool.
Key Outcomes and Achievements.
Hydroterre (PSU’s in-house webservice for national data) was adapted and delivered for use in model simulations and accessible to any user (http://www.hydroterre.psu.edu). We completed fusion of the Penn State Integrated Hydrologic Model (PIHM) and Cycles to form C-PIHM, a functioning object-oriented, spatially-distributed hydrologic, nutrient cycling and watershed model designed to compute infiltration, groundwater recharge, lateral transport, evaporation and transpiration to simulate nutrient leaching under various land management/BMP scenarios. GitHub, a private portal, was set up to store and track software code changes and distribute updated versions of Cycles, PIHM, and C-PIHM. These models are now part of the the Multi-Modular Penn State Integrated Hydrologic Model (MM-PIHM), an open-source software under the MIT license, that can be downloaded at https://github.com/PSUmodeling/MM-PIHM. The model Cycles releases are available at https://github.com/PSUmodeling/Cycles. These models combine decades of multi-million dollars investments in model development and break new ground in distributed modeling.
This modeling system requires high performance computing and produces large amounts of data that can be challenging to digest for a user. A typical output is shown in Figure 1.
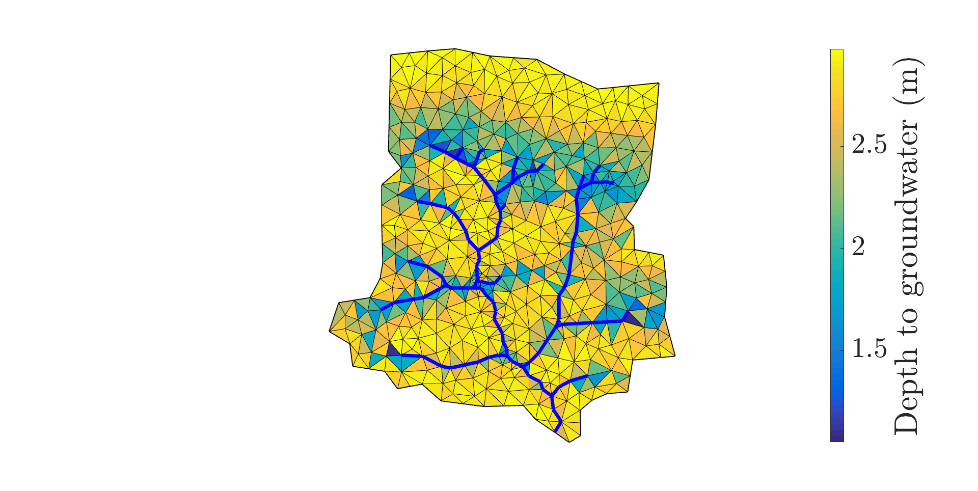
| Figure 1. Depth to groundwater in W38, a 7.3 km2 sub-watershed of the Mahantango Creek watershed. The model domain has 883 triangular model grids, averaging 0.84 ha. The smallest grid is 500 m2, or 0.12 ac. |
The depth to the water table is showing the areas, mostly in headwater, were the water table is higher and therefore interacts intensily with surface processes. Clearly, these are areas prone to denitrification and sensitive to management. The sensitivity can be tested by running different scenarios. The unresolved challenge is to accomplish this on the fly due to the length of the simulations (it takes hours to run a few years in a domain with 8,000 grid points).
Scale differences among models make model intercomparison challenging. Although different models can start from the same inputs, data post-processing to feed different models make the inputs different. Furthermore, outputs can vary when the same model is run at different scale. For example, as a result of this project, we are evaluation the sensitivity of C-PIHM to changes in the grid resolution; this is a within-model intercomparison that is as releant as multi-model comparisions.
One of the outcomes of the model intercomparison was the unexpected fusion of outputs form different models. We used point-simulations with Cycles and watershed level regression results from SPARROW to calculate the reduction in nitrogen to the Chesapeake Bay resulting from replacing row crops with perennial bioenergy crops. We estimated that after subtracting the potential reduction in nitrogen loading due to improved nitrogen fertilizer practices for maize, a further 21.8 Gg reduction (over a target of 26.9 Gg) is required. Replacing maize with fertilized switchgrass could reduce nitrogen loading to the CB by 23 kg ha-1 y-1, meeting 41% of the N reduction target. We also estimated that the break-even price of fertilized switchgrass to provide the same profit as maize in the CB is 111 $ Mg-1 (oven-dry basis throughout and based on 2010 – 2015 budgets). We also estimated that growers replacing maize with switchgrass could receive an ecosystem service payment of 148 $ ha-1 based on the price paid in Maryland for planting a rye cover crop: this equates to 25 $ Mg-1 of switchgrass. An annual cost of this ecosystem service payment to induce switchgrass planting is 10.72 $ kg N-1. We further combined this result with the POLYSYS general equilibrium model to account for competition among food, feed, and biomass markets, and we found that with the ecosystem service payment for switchgrass of 25 $ Mg-1 added to a farm-gate price of 111 $ Mg-1, 18% of the N loading reduction target could be met while also producing 1.3 Tg of switchgrass, potentially yielding 420 million L y-1 of ethanol. Thus, while our original goal was to provide model intercomparisons, one of our most important outcomes was the value of combining the strength of different models, as well as the full integration with economic models. These results have been reported in Woodbury et al 2018 Biomass and Bioenergy, 114, pp.132-142.
Project 3: Maintaining Ecological Integrity and Provisioning of Ecosystem Services
Subproject: this is subproject number 003, established and managed by the Center Director under grant RD83556801
Investigators: Robert Brooks, Susan Yetter, Hannah Ingram, Michael Nassry, Corina Fernandez, Joseph Bishop, Claire Regan
Institution(s) of PI(s): Pennsylvania State University
Objective(s) of the Research: The purpose of this project was to aid the CNS in its integrated decision support process by validating model expectations and outcomes with ecological condition data followed by estimating ecological condition changes and resultant ecosystem services for a give set of interventions (scenarios). The main objectives for Team 3 were to: (1) establish baseline condition at 3 assessment levels (landscape, rapid, and intensive), (2) relate spatially-targeted model estimates of nutrients and sediment yields to site condition, (3) estimate changes in ecological condition under different scenarios, and (4) translate this information into changes related to ecosystem services.
Summary of Findings:
Major Activities. Baseline ecological condition was determined at three assessment levels (coarse landscape, rapid stream/wetland/riparian, and intensive macroinvertebrate Index of Biotic Integrity) for multiple sub-basins within the Mahantango Creek, Conewago Creek, and Spring Creek watersheds. Restricted access and the estuarine conditions of the lower watershed limited assessments of the Manokin River to the stream habitat condition assessments using the SWR Index in the upper reaches. We compared results between assessment levels to ascertain if coarser assessments could be used in place of more intensive assessments.
To compare SWAT model estimates of nutrient and sediment to ecological condition, sub-basins were delineated in SWAT for each monitoring point. We then evaluated 1) the best spatial extent to model SWAT for water quality, 2) the effect of season on the SWAT model/ecological condition relationship, and 3) if results differed across and within watersheds. SWAT subbasins were delineated for each monitoring point using two spatial extents: 1) Local Contributing Area—loads from the immediate surrounding upland; and 2) Total Contributing Area—the total contribution of loads potentially entering the stream from the entire upstream area, including the stream reach. We then compared results from each spatial extent among seasons (annual, winter, spring, summer, fall), across all watersheds (i.e., all freestone streams in Mahantango, Conewago, and Spring Creeks), within each watershed (e.g., Mahantango Creek), and within a small sub-watershed (WE38 of Mahantango Creek). Our methods included a combination of correlation and regression analyses and multivariate analyses (ordination, cluster analysis, and Random Forest).
To translate ecological condition to ecosystem services, we evaluated carbon sequestration (amounts of carbon stored and sequestered in different types of carbon pools), flood storage and desynchronization (measures and scaling of flooding and floodplains in temperate riparian buffers), biodiversity (ranking biological assessments of aquatic macroinvertebrates), water purification (association of assessment levels with water quality), and water-based recreation (association of selected stressors with degraded recreational experience).
Key Outcomes and Achievements.
Baseline Ecological Condition: Baseline information on biological and ecological condition and onsite stressors, determined for approximately the same year as the modeling efforts (circa 2012), spanned the range of condition levels across all watersheds from severely impaired to excellent condition. In the Mahantango Creek watershed the majority of headwaters within the upper portions of Mahantango Creek were in poorer condition than the upper portions of Deep Creek and Pine Creek. Grazing pressures, eroded stream banks and evidence of fine sediment deposition suggest stream bank fencing of pastures in headwaters of Upper Mahantango, including the WE38 subwatershed, along with stream bank restoration along the larger stream channels (lower Deep Creek and Mahantango mainstem) are most likely needed if ecological condition is to improve. In the Conewago Creek watershed sites in best condition were located along small headwaters with intact forest buffers. Like Mahantango Creek, streams in the Conewago, especially along the mainstem and non-buffered headwaters had incised and eroded stream banks coupled with excesses of fine sediment in the channels. Ecological condition typically ranged from marginal to poor condition indicting marginal to severe impairment. The majority of streams in the Spring Creek watershed were clearly limestone streams requiring a different IBI assessment protocol. Although SWR results indicated Spring Creek streams were in better condition than those in Mahantango and Conewago Creeks, the limestone IBI results suggested many of the streams in Spring Creek were moderately impaired, while several were supporting their Aquatic Life Use (ALU) designation and one site was considered to be in reference standard condition.
When comparing condition results between assessment levels, landscape, field, and biological assessment results demonstrated positive relationships; however, landscape assessments typically scored sites in poorer condition, SWR assessments normally rated sites in suboptimal or marginal condition, while the intensive assessments ranked sites across a greater range of condition categories. Comparisons of assessment results for the subshed WE38 with results from the rest of the Mahantango Creek watershed revealed apparent differences in stressors and community responses, which are most likely due to stream size.
Relating SWAT to ecological condition:
BEST INDICATORS AND EXTENTS—stronger statistical relationships between SWAT modeled results and ecological condition were found at the sub-watershed scale (i.e., WE38) than across watersheds or within watersheds. This is especially true at the local contributing scale. The most likely reasons for this are: 1) the increased strength of the model when using field-level and long-term data for calibration; and 2) the strength of the biological assessment (i.e., higher level of effort per watershed size). Results from analyses conducted within an entire watershed or across multiple watersheds showed weak relationships between nutrients and ecological condition at the total contributing scale. Seasons highly correlated with one another for all parameters and scales. No watershed-wide relationships were found at the local and total contributing scales for sediment parameters.
Random Forest, ordination, and univariate results at larger spatial scales (across watersheds and within watersheds) suggested that the best predictors of IBI scores, metrics, and community composition changes are physical habitat variables (e.g., bank vegetative protection) and water chemistry (e.g., specific conductivity). Of the IBI metrics, Beck’s Index and % nutrient intolerant and tolerant, were most associated with nutrients, specifically TN, TP, NO3, and Mineral P. No relationships were found at larger scales between sediment and biological condition.
Significant Findings from Comparing SWAT modeling to Ecological Assessments: Although additional work is needed, our main conclusions are that space, place, and time matter. This applies to modeling decisions (e.g., entire basin vs local contributing area, overland vs. instream, spring vs. summer) and monitoring decisions (e.g., small streams vs. large streams), any of which can affect the resulting data and relationships. Overall, however, SWAT modeling at finer spatial scales combined with targeting sub-basins (i.e., matching models to monitoring locations) appears to improve our ability to identify connections between model outputs of nutrients and sediment and ecological condition, but not to the level of certainty needed to create statistical models to predict likely outcomes from BMP scenarios. A more realistic and robust method of prediction may be to evaluate physical habitat condition and other site-level information across sites and conduct a ‘space for time’ substitution to estimate the range of ecological improvements possible from a BMP scenario.
Estimating Changes in Ecological Condition from a Riparian Forest Buffer Scenario:
We described the likely outcomes from a particular scenario by contrasting different areas of the watersheds that represent the conditions we might expect to see when a future scenario is implemented. Baseline condition results indicated that the percentage of forest, especially in the riparian zone may play a major factor in maintaining higher IBI scores and overall ecological integrity. Buffer scores were typically much higher in attaining sites than in impaired sites. Considering this and the overriding influence of riparian and instream conditions on aquatic communities, we selected a scenario of forest buffer implementation (Scenario D), rather than the cost-effective BMPs implemented in Scenarios B and C (e.g., no-till and manure timing).
We compared IBI scores and SWAT-modeled nutrient and sediment parameters across the following buffer classes: 1) no buffer; 2) perennial grass buffer; 3) mixed shrub/sapling buffer; 4) mature forest buffer. Using the buffer information collected in the SWR assessment, we selected freestone stream reaches from all watersheds that had the same buffer type on both sides of the stream. We defined perennial grass buffers as those with a dominance of perennial vegetation with no visible evidence of annual mowing (e.g., mowed grass was classified as ‘no buffer’). This analysis was only conducted on headwater streams (0-3rd order), since only a few mainstem sites met the criteria. A final distinction we wanted to make was between sites with mature forest that had always had a forest buffer vs. sites that had prior land uses (e.g., crops or pasture) that presently had a re-established forest buffer. This latter exercise was completed by comparing historical aerial photos from each site across three time periods: era 1940, era 1960, and 2016.
RESULTS—IBI scores between all buffer types varied considerably, although mean IBI scores for mature forest buffers were clearly higher than scores for sites with no buffer. Mean sediment and nutrient concentrations did not change significantly between buffer classes, although Total Nitrogen and Total Phosphorus concentrations tended to be lower in reaches with mature forest buffers.
Comparison of historical photos from different eras (roughly late 1930s, late 1950s, and 2016) revealed the vast majority of sites with mature forest buffer had that buffer intact through each of the time periods (i.e., since at least 1938). The only exceptions were two sites in Conewago Creek, which had the lowest IBI scores. This suggests that the higher IBI scores may reflect stream reaches with long-term intact mature forest buffers, while the lower IBI scores are more indicative of what one may expect from a planted forest buffer. However, the inclusion of at least one impaired site with an intact mature forest buffer, also suggests that upstream sources of sediment and/or nutrients can affect condition downstream, or that buffer penetrations that circumvent the buffer may be present on site.
These results imply that improving biological condition from impaired to attainment of its ALU designation will likely require two main things: 1) addressing upstream sources of impairment; plus 2) time to allow a mature forest buffer along with related factors (e.g., complex and substantial organic soil layer) to become established. Given the difficulty in replacing natural ecosystems that have taken decades to centuries to evolve, realistic expectations for biological condition improvements from forest buffer establishment are likely to reflect the lower quartiles and may take at least a half century or more to attain. However, results are promising and suggest aquatic life use attainment is probable. It is also important to stress the need for additional data, as these conclusions are based on a limited number of sites (n=29).
Translation to Ecosystem Services: Expected changes in ecosystem services were evaluated for carbon storage, flood storage and desynchronization, and water-based recreation.
CARBON STORAGE—Findings from exploring the carbon storage ecosystem service show that three pools hold the majority of carbon – soil, above-ground woody, below-ground (roots). We aligned carbon values with expected vegetation (successional stage) and soil (degree of wetness) conditions found at sample sites throughout each watershed based on variables obtained from Level 1 Landscape Analysis and Level 2 SWR Index. It is important to keep in mind that riparian forest buffers planted as seedling stock, will take 15 years or longer to begin to develop some characteristics of maturing natural forests, including storing significant amounts of carbon.
FLOOD WATER STORAGE—Floodwater storage occurs either when there is overbank flooding that inundates the floodplain (flood pulse) or when lower elevation portions of the floodplain (active zones) are inundated by below bankfull events (flood flows). The presence of multiple channels and habitat types, many connected to outlets below bankfull elevations, promotes greater flood storage and is indicated by the degree of lateral and longitudinal confinement, habitat complexity (e.g., large woody debris, wetland cover types, substrate diversity), and connectivity between main channel and floodplain. In addition, wider buffers with greater and larger stem densities will slow flows and increase retention times. By examining these characteristics of the riparian corridor, we believe one can infer the degree of flooding across four categories – optimal, suboptimal, marginal, or poor. To calculate a Flood Storage Index we used data obtained from physical habitat (riverine and stream) and SWR metrics collected in unconstrained reaches in the Little Mahantango Creek and Deep Creek watersheds. Flood Storage Index:
- Riparian Complexity—Aquatic Habitat Extent + Channel Diversity+Channel Substrate+LWD+Organic Matter + Wetland Cover Types
- Connectivity—Bank Stability + Incision Ratio + Channel Diversity+Hydrologic Connectivity+LWD+Wetland Cover Types + Geomorphic Modification
- Riparian Vegetation (Retention Time)—Vegetative Protection + Riparian Zone Width + Channel Diversity+LWD+Organic Matter+Wetland Cover Types+Riparian Veg Stressors
- Anthropogenic Stressors--Stream Stressor Score + Grazing Pressure + Geomorphic Modification +Riparian Vegetation Stressors
We then compared scores for each component and the overall Flood Storage Index scores between various buffer types. Results indicated streams flowing through extensive mature forest buffers provide much higher flood water retention and carbon storage services than streams with only grass or no buffers.
WATER PURIFICATION AND BIODIVERSITY- Our primary measure of biodiversity in these aquatic ecosystems were macroinvertebrate communities, which are described in the section above on ecological condition. These same communities infer how well waters are “purified” by examining water quality conditions in the assessed waterbodies, again described in the same section above, for biological, physical, and chemical parameters.
WATER RECREATION (FISHING)—We attributed recreational fishing to a waterbody’s ability to support fish and other aquatic life (i.e. its aquatic life use or ALU), which is defined by water quality standards. We used the state’s protocols for biological monitoring of surface waters as indicated by macroinvertebrates (i.e., Indexes of Biotic Integrity or IBIs) to assess attainment status of the CNS monitoring sites. HQ waters exceed water quality standards and support high quality aquatic communities and may include Class A wild trout streams. EV waters, as their name signifies, are of the highest quality, which may be defined by several factors, including exceptional ecological significance or wilderness trout stream. This was translated to the following:
- Trout fisherman—need CWF and HQ/EV waters will provide best recreational experience. CWF streams with high IBI scores are the most likely candidates for brook trout. CWF streams with lower IBI scores would probably still be good for brown trout.
- Largemouth bass fisherman—larger range of IBI scores for WWF.
Project 4: Optimizing Best Management Practices and Determining Strategic Barriers to Success
Subproject: This is subproject number 004, established and managed by the Center Director under grant RD83556801.
Investigators: Peter Kleinman, Doug Beegle, Heather Karsten, Art Allen, Zach Easton, Tamie Veith, Ray Bryant, Amy Collick, Tony Buda, Jennifer Weld, Jasmeet Lamba, Mostofa Amin, Curtis Dell, Clinton Church, Jian Liu, and Gordon Folmar
Institution(s) of PI(s): USDA-ARS Pasture Systems and Watershed Management Research Unit, Pennsylvania State University, University of Maryland Eastern Shore, Virginia Tech Eastern Shore Agricultural Research and Extension Station
Objective(s) of the Research: Activities in the Project/Team 4 research area are organized under two major objectives: (1) Optimize “tactical” options, and (2) Define “strategic” barriers. For objective 1, we will work with the Community Partners Council to identify alternative suites of practices that may realistically be adopted under existing systems and constraints. Using the Nutrient Center’s decision-support tools, iteratively adjust the tactical management options to develop optimal suites of tactical options. For objective 2 we will elucidate the boundaries of existing nutrient management systems that must be removed to achieve maximum potential for optimized tactical nutrient management options to improve health of the Bay and its tributaries.
Summary of Findings:
Major Activities.
Team 4 compared SWAT and Chesapeake Bay Model simulation results for each of the two Ridge and Valley province watersheds (Spring Creek, Mahantango). BMP cost-effectiveness selection and placement in each of the watersheds was then modified based on BMP application on acreage defined in the WIP and on BMP application in order of BMP cost.
The Manokin Watershed on Maryland’s Eastern Shore has proven to be a modeling challenge not only due to its very flat terrain but its history of heavy poultry litter applications and the resulting high P levels in the soil. We made substantial progress on a suitable baseline representation in SWAT for the Taylor Branch subwatershed.
In year 3, Team 4 finalized the alternative practices to be considered for Conewago, based on the procedures used for Mahantango and Spring Creek. Additionally, simulation models for alternative dairy cropping conservation systems in the Spring Creek watershed were designed, based on previous field work. Preliminary results demonstrate the potential for improving watershed-level water quality through locally-appropriate variations of conservation cropping.
Coding improvements and corrections were made to the SWAT model to better simulated phosphorous fate and transport after liquid manure application, account for rock volumes within the soil profile, and to provide outputs that could be related back to phosphorus soil testing values. The new code will be made publicly accessible and changes are documented within this study’s SWAT-related journal publications.
SWAT simulation results for the two Ridge and Valley province watersheds (Spring Creek, Mahantango) and the Piedmont province watershed (Conewago) were updated for Scenarios A, B, and variations of C. These results were shared throughout CNS, providing nutrient yields and loads as crucial input data and comparison data to the other teams.
In addition SWAT simulations were performed for Scenario D, with variations specific to the concerns and conditions of the watershed. In particular, the impact of urbanization and landuse intensification was examined in a subwatershed of Spring Creek. Additionally, simulation models for alternative dairy cropping conservation systems in the Spring Creek watershed demonstrate the potential for improving watershed-level water quality through locally-appropriate variations of conservation cropping were completed, presented, and published. In Mahantango, SWAT was used to compare historic and current farming practices to help stakeholders plan for the future. Additionally, winter manure storage or spreading options were evaluated at both a field and watershed level to evaluate both seasonal and chronic water quality risks. These findings as well as a global review of winter manure application were presented and published. In Conewago, the impacts of adding riparian buffers to other community-based BMPs was evaluated. This work helped inform a comprehensive review and assessment of riparian buffers within the Chesapake Bay Watershed
Key Outcomes and Achievements.
Task 1 – Optimize “tactical” options. Under this task, the Center’s Community Partners Council engage in a shared discovery process to optimize tactical nutrient management in each of the four focal watersheds. This process involves an iterative approach in which the first step is to identify alternative practices that are attractive as a result of perceived ecosystem contribution, socio-economic benefit or production system compatibility.
In year 2, Team 4 focused on interacting with the Center’s Community Partners Council to gain feedback on current and alternative practices that are important within each watershed, corroborating the Soil Water Assessment Tool simulation model for two of the four watersheds (Mahantango and Spring Creek), continuing model initialization for the other two watersheds (Manokin and Conewago), and clarifying what model output data were needed by the other teams. The Center’s Community Partners Council meetings, organized by Team 7, provided crucial guidance in development of “tactical” options germane to each watershed and also energized all parties in looking forward to modeling results from Team 2 and 4.
In the spirit of shared discovery, frequent meetings between various members of teams 2, 3, 4, 5 and 6 have continued, resulting in a well-blended working group that is refining, implementing, and analyzing the tactical scenarios. Additionally, team 2 and 4 worked on establishing clear initial conditions and input data sets to be used across models. Teams 3 and 4 continue to explore the connection between nutrient losses from the land, ecological riparian integrity, and provisioning of ecosystem services. Team 4 modelling output was used by Team 5 to develop prototype web outreach tools.
Between the SWAT and Bay simulation models, the improvement in sediment loadings predicted by implementing the Bay TMDL was similar. However, SWAT predicted about half the improvement in N as did the Bay Model. For P loadings, predictions were similar for Spring Creek, but for Mahantango SWAT again predicted only half the improvement as did the Bay model.
Simulation results have been vetted within CNS and presented at both scientific and stakeholder meetings. Findings have driven scenario revisions and informed the next stage of the project. Additionally, we worked with the other teams to design the transformative scenarios for each watershed based on findings thus far and on insights from the Center’s Community Partners Council
Task 2 – Define “strategic” barriers. Central to the iterative assessment of tactical management options will be the comparison of the trade-offs associated with alternative suites of practices. While the Center’s decision support tools (SWAT, SWR Index, PIHM) will provide insight into various quantifiable differences at farm, field, stream and watershed scales, central to the process of selecting practices will be consideration of the perceived barriers to adopting these practices or including additional tactics.
Economic, agronomic, and water quality impacts of relocating poultry litter were evaluated to shed light on the perceived versus actual barriers for this means of balancing nutrient resources. A modeling study evaluating manure spreading at different times and rates, with particular interest on winter/spring spreading, was designed and started. Conversations with Team 1 members helped identify scenarios of atmospheric change that may result from strategic changes.
The trade-offs in phosphorus loss due to applying manure frequently during fall and winter, but at low rates, versus storing manure throughout the season or year and then applying at high rates in the spring and/or fall, are unclear. We simulated seasonal manure application timing and storage effects on phosphorus loss in a Pennsylvania watershed. Winter and fall applications of manure resulted in risk of larger annual phosphorus losses from fields than spring application, but phosphorus loss could be reduced by applying manure to low-slope fields, not applying near streams, increasing crop cover in fall and winter, and decreasing manure rates. Although 12-month storage across the watershed (that is, spreading all manure in the spring), reduced total yearly amounts of phosphorus lost, compared to 6-month or 3-month storage, it led to great peaks of phosphorus concentrations in the stream in spring. Results point to the need to assess trade-offs associated with change in manure storage capacities in the region.
Follow-up stakeholder meetings were held for the Spring Creek, Mahantango, and Conewago watersheds to discuss model simulation results and demonstrate how we used feedback from the initial stakeholder meetings to inform and design our research. The SWAT simulation projects will form a solid foundation for future research on impacts of climate and policy on agricultural practices and resulting water quality.
Significant Findings.
Space , place, and time of stressors & management-related activities matter greatly: 1) spring manure application reduces annual P loss but increases seasonal loading; 2) targeting application to low-slope, distant fields reduces stream P loadings; 3) cover crops reduce field-level P losses, regardless of almost all other factors; 4) 12-month storage with spring application reduces dissolved, but not total, P loss.
We can meet Bay’s target load reduction at lowest cost by reducing periods of soil disruption and bareness, protecting stream edges, making the most of manure and nutrients through incorporation and precision application. In-field management changes can create multiple benefits at a relatively low cost, e.g., improved soil health, reduced nutrient and erosion losses, and improved air quality. By implementing low cost, in-field management changes in the fields of highest loss risk, we can potentially save and apply watershed-level money to critical, high-cost stream restoration sites. As a result, both downstream water quality and local water quality and soil productivity are improved.
Project 5 Informatics
Subproject: this is subproject number 005, established and managed by the Center Director under grant RD83556801
Investigators: Brian Bills, Doug Miller, Michael Stryker, Blake Ketchum, Joseph Bishop
Institution(s) of PI(s): Pennsylvania State University
Objective(s) of the Research: TheInformatics team develops and implements web-based tools (collaborative web portal, map-based discussion tool, and interactive model scenario browser) to aid in communicating CNS science information to watershed stakeholders.
Summary of Findings:
Major Activities. We developed the collaborative project web portal (www.cns.psu.edu) that enables team scientists, collaborators, and stakeholders to share information as well as communicate project work both internally and publicly. Using the ExpressionEngine content management system (CMS), we built templated website pages directly editable by CNS Team members giving members with domain knowledge full control over content conveyed to the public and with collaborators. The website also hosts map-based web applications designed in collaboration with Team 7 (Outreach) and Team 4 (Best Management Practices) to visualize a summary of modeling outputs across multiple scenarios.
Applications: Based on feedback from the Community Partners Council and Science Advisory Committee, we designed and implemented interactive web applications in collaboration with Team 4 and 7 to illustrate specific concepts and outcomes of the scenario approach using data generating from the modeling efforts. In adopting a narrative concept, we paired narrative text with interactive graphics and maps. The approach addressed the need to show how the scenarios are a progression and refinement in the selection and placement of best management pratices. The narrative text is intended to provide context for understanding and interpreting selected summary data and fill gaps where quantitative comparisons are not practical. A number of narrative themes were identified and conceptualized. We implemented a nutrient load narrative showing the spatial distribution of best management practices, the scale of these transformations, modeled nutrient loss outcomes and modeled costs associated with a given practice. Narratives are intended as an entry point for the public to explore scenarios and modeled outcomes further in additional publications and presentations hosted on the CNS website. Figures 2 and 3 show screen shots from the nutrient load narrative.
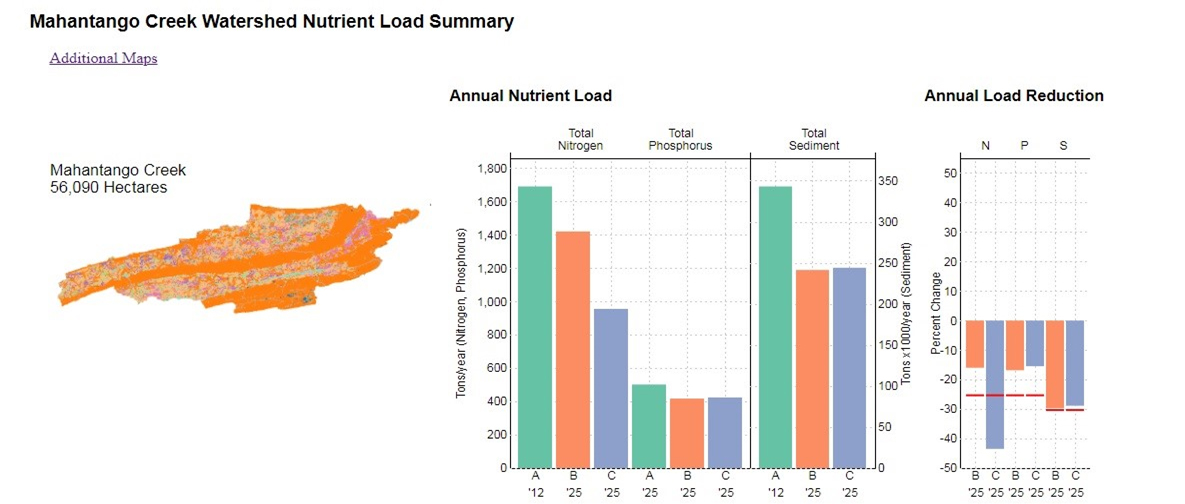
Figure 2. Partial display of Nutrient Load Narrative showing map of Scenario B (highlighted) with summary data
| Best Management Practice | Scenario A (ha) | Scenario B (ha) | Scenario C (ha) | |
|---|---|---|---|---|
| conventional tillage | 5,253 | 254 | 279 | |
| developed | 2,646 | 2,114 | 2,646 | |
| forest | 22,873 | 23,149 | 22,873 | |
| minimum tillage | 10,812 | 9,742 | 432 | |
| non-rotational agric. | 283 | 6 | 283 | |
| permanant pasture | 9 | 2,202 | 9 | |
| water | 63 | 63 | 63 | |
| wetland | 7 | 7 | 7 | |
| conventional tillage w/ cover crop | - | 940 | - | |
Table 2. Distribution of BMP
| Best Management Practice | Scenario A (ha) | Scenario B (ha) | Scenario C (ha) | |
|---|---|---|---|---|
| conventional tillage | 5,253 | 254 | 278 | |
| developed | 2,646 | 2,114 | 2,646 | |
| forest | 22,873 | 23,149 | 22,873 | |
| minimum tillage | 10,812 | 9,742 | 432 | |
| non-rotational agric | 283 | 6 | 283 | |
| permanant pasture | 9 | 2,202 | 9 | |
| water | 63 | 63 | 63 | |
| wetland | 7 | 7 | 7 | |
| conventional tillage w/ cover crop | - | 940 | - | |
| conventional tillage w/ man inj | - | 32 | - | |
| forest buffer | - | 23 | - | |
| grass buffer | - | 222 | 167 | |
| minimum tillage w/ cover crop | - | 2,552 | - | |
| minimum tillage w/ cover crop & man inj | - | 170 | - | |
| no-till w/ cover crop | - | 470 | - | |
| enh. N mang., no-till cover | - | - | 5,305 | |
| no-till | 1 | 1 | 9,881 |
BMP Cost -= Figure 3. Load Narrative and relative costs for BMPs by scenario
| Scenario B | Scenario C | |||||
|---|---|---|---|---|---|---|
| BMP | Implemented (ga) | USD/ha | USD | Implemented (ha) | USD/ha | USD |
| Conservation tillage | 5,346 | $7 | $39,563 | - | - | - |
| Cover crops | 4,131 | $55 | $227,228 | 2,453 | $55 | $134,940 |
| Land retirement | 2,194 | $299 | $656,754 | - | - | - |
| Continuous no-till | 470 | $7 | $3,477 | 4,416 | $7 | $32,680 |
| Tree planting | 385 | $195 | $75,168 | - | - | - |
| Grass buffer | 236 | $63 | 14,868 | 174 | $63 | $10,962 |
| Liquid manure injection | 202 | $29 | $5,868 | 2,944 | $29 | $85,380 |
| Forest buffer | 23 | $90 | $2,044 | - | - | - |
| Enh. N management | - | - | - | 4,907 | $7 | $33,858 |
| All | 13,760 | $74 | $1,024,969 | 4,097 | $7 | $297,820 |
Project 6: Economics and Ecosystem Services
Subproject: this is subproject number 006, established and managed by the Center Director under grant RD83556801
Objective(s) of the Research: Interventions aimed at reducing nutrient loadings to the Chesapeake basin, for example, through adoption of best management practices on agricultural lands, are costly but generate benefits in the form of increased ecosystem services. A challenge is that the individuals who bear the costs of implementing BMPs are not necessarily the same as those who enjoy the benefits. Indeed, the benefits can accrue at considerable distance from where the BMP adoptions occur.
Team 6’s main tasks are to (1) develop a system that can be used to measure, in a spatially explicit way, the monetary value of ecosystem services generated by specific interventions in specific watersheds and (2) use the system to evaluate scenarios developed and modeled by Teams 2 and 4 in three case study watersheds.
Summary of Findings:
Major Activities. A GIS-based system was developed that, for a specific intervention in a specific target watershed, (1) incorporates water quality changes from SWAT model runs done by Team 4; (2) models changes in nutrient and sediment deliveries downstream of target watersheds, using delivery ratios obtained from the Chesapeake Bay Program; (3) calculates changes in the Water Quality Index for each stream reach in the targeted watershed and for each downstream reach; (4) calculates the resulting reduction in nutrient and sediment deliveries to the Bay and calculates the value of the ecosystem services generated by those reductions; (5) calculates the benefit associated with improved in-stream water quality to each household in the study area, which depends on the household’s location; (6) multiplies average benefit per household by household density, to calculate spatially-specific total benefit from the intervention; and (7) aggregates total benefit across space to generate total benefit for each State in the basin.
Key Outcomes and Achievements. The system was used to calculate the value of ecosystem services generated by the Phase I WIP (B) and Smart Strategy (C) Scenarios for the Mahantango Creek, Spring Creek, and Conewago Creek watersheds (six total scenarios). GIS maps were generated for each of the six scenarios that show the spatial distribution of the benefits associated with the in-stream water quality improvements. These were then summed for each state. In addition, the benefit associated with reduced sediment and nutrient loadings to the Bay was calculated. Because of the way benefits from improved Bay water quality are calculated, this value cannot be allocated across states. Total benefits were then compared to the cost of implementing the BMPs associated with each scenario.
Significant Findings. An important discovery from this effort is that, for all scenarios considered, the benefits from BMP adoption are much larger than the costs. Benefit-cost ratios ranges from 22 to 276. Even considering only the benefits associated with in-stream water quality improvements, and only those benefits that accrue to Pennsylvania (where the three target watersheds are located), the benefits from each scenario outweight the costs by at least a factor of six. Second, the benefits associated with improved in-stream water quality are of the same order of magnitude as the benefits associated with improved water quality in the Bay, though the relative importance of the two categories of benefits does vary across watersheds. Third, the Smart Strategy (C) Scenarios give consistently higher benefit-cost ratios than the WIP Phase I (B) Scenarios. Fourth, the benefit from in-stream improvements in water quality is highest for households living within or close to the targeted watershed, but benefits also accrue to households who live close to downstream reaches.
Finally, the results show that the benefits from BMP adoption vary depending on where the BMPs are adopted, but in complicated ways. BMPs will generated higher benefits if they 1) are targeted at watersheds where they will achieve higher reductions in nutrient and sediment runoff; 2) are located near or upriver from populated areas, so that the local benefits from improved in-stream water quality are highest; and 3) are located near the Bay, so that reductions in nutrient and sediment deliveries to streams results in large reductions to the Bay. However, these criteria often conflict with each other. The tool developed here can be used to determine how these factors trade off against each other and to evaluate any spatially-specific BMP scenario.
Project 7: Engagement/Education/Outreach
Subproject: this is subproject number 007, established and managed by the Center Director under grant RD83556801
Investigators: Matt Royer, Lara Fowler, Brian Bills, Doug Miller, Susan Yetter, Kevin Sellner
Institution(s) of PI(s): Pennsylvania State University; Chesapeake Research Consortium
Objective(s) of the Research: The Engagement/Education/Outreach team facilitates connections among all research teams and external stakeholders to ensure that research conducted by the Center will be connected to decision makers and stakeholders wrestling with nutrient management issues at a variety of spatial scales. By engaging key decision makers and stakeholders at all levels, CNS’ phased outreach and engagement strategy will facilitate research outcomes related to understanding, evaluating and choosing integrated multi-scale solutions for nutrient pollution.
Summary of Findings:
Major Activities. To provide an consistent venue for stakeholder engagement and shared discovery, we convened and coordinated the Community Partners Council (CPC), representing diverse interests in nutrient pollution and nutrient management practice and policy in the Chesapeake Bay region. CPC meetings were held with researchers 1-2 times per year throughout the project duration. Several of these were multiday meetings. This allowed for stakeholders to provide input into shaping research design and researchers to provide research results and explore scenarios and solutions that are most helpful for watershed decision makers.
We also convened watershed stakeholder groups in each of our study watersheds. We facilitated interactive meetings where researchers and stakeholders learned together about the watersheds and the research objectives of CNS. Initial meetings encouraged stakeholders to share details on the nature of agricultural operations and other land uses in the watershed, the level and placement of conservation practices already in existence, and the priority issues and objectives of the local watershed community. Follow up meetings were held with watershed stakeholders to share results of our scenario process and discuss how results could help shape watershed planning and decision making.
Our work with watershed stakeholders helped to develop scenarios for meeting local water quality and other priority objectives while also addressing nutrient reduction goals. Based on the input of local stakeholders and working with our modeling team, we develop customized Scenario D approaches for each watershed, and used the CAST modeling tool to compare these to other scenarios.
We contributed to the communication of the efforts of CNS through collective work with Team 5 in building the CNS website, and also through the production of a mini-documentary on the Center and its innovative approach, Center for Nutrient Solutions: New Science for Solving Wicket Nutrient Problems.
In June 2018, we held a full day conference in Harrisburg, Pennsylvania to publicly share our results. Over 100 researchers, policy makers, agency professionals, and practitioners, many of whom are engaged in Chesapeake Bay restoration issues, attended the conference. The conference was a successful venue to share our collective research results and explore the aplicabity of the CNS research findings and approaches to nutrient pollution mitigation strategies.
Key Outcomes and Achievements. Perhaps the most prominent and overarching outcome of our work is the continued development, refinement and successful application of “shared discovery.” This is a collaborative, iterative process where researchers together with stakeholders explore research design, results, and decision support tools developed from the collective effort. The process is deliberative and focused, providing clear opportunities for engagement and communication among researchers and external collaborators and stakeholders. These communications provide a directional guide for how the research unfolds during a project, and links science-based research directly to issues and solutions to real environmental problems. Its success is dependent upon involving all participatns in the project as equal members. Research team leaders, investigators, staff, students and stakeholders collaborate in periodic “all hands” sessions and through many other methods of communication and engagement, including other in-person working sessions and workshops, conference calls and video conferencing, webinars, and informational materials and web-based products. Shared discovery ensures two-way communications in all project phases, a constant receptivity to suggestions, comments and critiques, and inclusion of contributors in study design, analysis and authoring of products. This process was critical in producing research results highly valued by stakeholders.
We learned through our watershed stakeholder engagement that standard approaches to watershed management and approaches designed entirely for pollutant reduction (e.g. Phase 1 and 2 WIPs) are less likely to produce effective action at local levels where desires and concerns of the community differ from regional goals. This information underscored the need for developing multi-objective local scenarios and provided guidance for developing Scenario D and tailoring it to each watershed.
However, local stakeholders do recognize the importance of meeting regional nutrient reduction goals, and prefer solutions that will meet both regional and local water quality goals as well as other important local objectives. Through stakeholder input, we were able to develop customized Scenario D approaches that took into account all of these objectives. These included BMPs meant to address the sources of local water quality impairment (in most cases sediment), including practices that enhanced instream and riparian habitat (which our work found to be a key driver of local watershed health), as well as cost effective agricultural BMPs that help support local agriculture and, in one mixed urban land use watershed (Conewago) green infrastructure BMPs to meet urban stormwater goals. Generally speaking we found that regional nutrient and sediment goals can be reached and in some cases exceeded (particularly for sediment) through these approaches, but at a higher cost. Thus there is a need to understand the tradeoffs involved in focusing on local water quality and other local objectives in choosing nutrient pollution solutions.
Significant Findings: Successful shared discovery ensures research results and outcomes are understood and linked to solutions to environmental problems and implementation challenges faced by stakeholders. CNS provides a model for how to successful incorporate stakeholder involvement in a complex, multidisciplinary research project.
Establishing a consistent stakeholder advisory committee (here the CPC) and engaging them throughout the entire research creates continuity in the project and helps formulate research design and results better aligned with stakeholder needs. The stakeholder committee should be diverse and represent the full diversity of stakeholder interests across sectors (governmental, private, public, academic), areas of expertise and enagement (policy makers, watershed managers, land managers), and scales of interest (federal, regional, state, local).
Engaging local watershed stakeholders is absolutely essential to developing meaningful watershed planning tools to guide watershed decision making. Local knowledge shared by watershed community members helps to develop a more informed baseline of conditions within the watershed, and can help researchers develop tools to address local concerns.
We found varying levels of understanding of what regional water quality goals (i.e. TMDLs, WIPs) mean for local water quality stakeholders. While agricultural sector have low awareness with little communication of how WIPs relate to their management directives and goals, municipal authorities are more aware of challenges and need to meet water quality directives but are often uncertain of specific actions to meet those requirements. We note that these findings are relevant to the Phase 1 and 2 WIPs only, as the Phase 3 WIP process (which is expected to provide a much higher degree of local stakeholder involvement) was not yet underway when we undertook the stakeholder engagement process associated with this project.
Local watershed managers are interested in both improving local water quality and meeting Bay nutrient and sediment reduction goals. Practices that achieve both results are given high priority by local stakeholders.
The economic and social impacts of implementing nutrient pollution solutions are important to stakeholders. In particular, local watershed stakeholders are seeking solutions that improve water quality while at the same time support a vibrant agricultural industry.
Every watershed is different. Differences in landscape type, geology and hydrology, type of agriculture, communities and populations, and social networks will necessarily mean the concerns of stakeholders related to nutrient pollution will be different. Solutions should be tailored to these unique circumstances and concerns.
Watershed planning tools that provide information about selecting practices that maximize local water quality improvement and nutrient reductions while minimizing costs, and provide science-based guidance for where on the landscape to target these practices have high resonance with stakeholders and will be valued and useful in watershed decision making.
Communicating these tools through simple, effective visual communications platforms is essential to stakeholder understanding and acceptance. There is a preference for interactive, map based tools, a set of easily understood huristics, and a road map for transferring these hursitics to other watersheds where the intenstive study and modeling that went into the four pilot watersheds in this project cannot be replicated.
References:
Dissertation/Thesis
Hirt, C. Stream condition and nutrient runoff: Linking the Soil and Water Assessment Tool (SWAT) model with empirical ecological measures in an agricultural watershed in central Pennsylvania. M.S. Thesis, Geography, The Pennsylvania State University, 2016.Stream condition and nutrient runoff: Linking the Soil and Water Assessment Tool (SWAT) model with empirical ecological measures in an agricultural watershed in central Pennsylvania
Redder, Brian (2018). Groundwater surface water interactions affecting nitrogen loadings in an agricultural watershed. MS Thesis, Penn State University, 79pp.
Reed, Brendan (2015). Water quality of three forest streams in Pennsylvania impacted by acidic Atmospheric deposition. MS Thesis, Penn State University, 85pp.
Journal Articles
Amin MG, Veith TL, Collick AS, Karsten HD, Buda AR. Simulating hydrological and nonpoint source pollution processes in a karst watershed: A variable source area model evaluation. Agric. Water Manage.
Amin, M. G. M., H. D. Karsten, T. L Veith, D. B. Beegle, and P. J. Kleinman. 2018. Conservation dairy farming impact on water quality in a karst watershed in northeastern US, Agricultural Systems, 165: 187-96.
DeWalle DR, Boyer EW, Buda AR. Exploring lag times between monthly atmospheric deposition and stream chemistry in Appalachian forests using cross correlation. 2016. Atmospheric Environment, doi: 10.1016/j.atmosenv.2016.09.015.
Iavorivska L, Boyer EW, Miller MP, Brown MG, Vasilopoulos T, Fuentes JD, Duffy CJ Atmospheric inputs of organic matter to a forested watershed: variations from storm to storm over the seasons.2016. Atmospheric Environment, doi: 10.1016/j.atmosenv.2016.10.002.
Leonard L, Duffy CJ. Automating data-model workflows at a level 12 HUC scale: watershed modeling in a distributed computing environment. Environmental Modelling & Software 2014; 6:17490. DOI:10.1016/j.envsoft.2014.07.015.
Liu, J., P. J. A. Kleinman, D. B. Beegle, C. J. Dell, T. L. Veith, L. S. Saporito, K. Han, D. H. Pote, and R. B. Bryant. 2016. Subsurface Application Enhances Benefits of Manure Redistribution. Agric. Environ. Lett. 1:150003.
Liu, Jian, Peter JA Kleinman, Helena Aronsson, Don Flaten, Richard W McDowell, Marianne Bechmann, Douglas B Beegle, Timothy P Robinson, Ray B Bryant, and Hongbin Liu. 2018. 'A review of regulations and guidelines related to winter manure application', Ambio: 1-14.
Liu, J., T. L. Veith, A. S. Collick, P. J. A. Kleinman, D. B. Beegle, and R. B. Bryant. 2017. Seasonal Manure Application Timing and Storage Effects on Field- and Watershed-Level Phosphorus Losses, J Environ Qual, 46(6): 1403-12.
Liu, Jian, Douglas Beegle, Peter J. A. Kleinman, Curtis J. Dell, Tamie L. Veith, Lou S. Saporito, Ray B. Bryant, Kun Han, and Dan H. Pote. 2016. Subsurface application enhances benefits of manure redistribution, Crops & Soils, 49: 48-51. https://doi.org/10.2134/cs2016-49-0513
Miller MA, Boyer EW, McKnight DM, Brown MG, Gabor RS, Hunsaker CT, Iavorivska L, Inamdar S, Johnson DW, Kaplan LA, Lin H, McDowell WH, Perdrial JN. Variation of organic matter quantity and quality in streams at Critical Zone Observatory Watersheds. 2016. Water Resources Research, 52, doi: 10.1002/2016WR018970
Ranjan R, Shortle J. Protecting and restoring aquatic ecosystems in multiple stressor environments. Water Economics and Policy 2016; 2(2); DOI: 10.1142/S2382624X16500119 (28pp.).
Sebestyen SD, Shanley J, Boyer EW, Kendall C, Doctor D. Coupled hydrological and biogeochemical processes controlling variability of nitrogen species in streamflow during autumn in an upland forest. Water Resources Research 2014; DOI: 10.1002/2013WR013670.
Shortle J, Horan RD. Nutrient pollution: a wicked challenge for economic instruments. Water Economics and Policy 2017; 3(2); DOI: 10.1142/S2382624X16500338 (38pp.).
Tzilkowski SS, AR Buda, EW Boyer, RB Bryant, PJA Kleinman, CD Kennedy, AL Allen, GJ Folmar, and EB May (2018). Urea fluctuations in stream baseflow across land cover gradients and seasons in a coastal plain river system. Journal of the American Water Resources Association, JAWRA‐18‐0054‐P, DOI: 10.1111/1752-1688.12716.
Williams MR, Buda AR, Elliott HA, Hamlett J, Boyer EW, Schmidt JP. Groundwater flow path dynamics and nitrogen transport potential in the riparian zone of an agricultural headwater catchment. Journal of Hydrology 2014; DOI:10.1016/j.jhydrol.2014.02.033.
Presentations
Alexander R., Schwarz G, Garcia A, Boyer E. Unraveling measurement and process related uncertainties in watershed models using hierarchical Bayesian approaches. Coastal and Estuarine Research Federation, Portland, NY, November 2015.
Boyer E.W. Water Quality of America's Rivers and Streams. Paul A. Witherspoon Award Lecture. American Geophysical Union, Washington, DC, December 2018. (Invited, Plenary)
Boyer EW. Research and Opportunities at the Environmental Science & Engineering Nexus. Cornell University 10th Annual Civil and Environmental Engineering Graduate Research Symposium, March 2018. (Invited, Keynote)
Boyer EW. Coupled Hydrological and Biogeochemical Cycles in Watersheds: Responses to Anthropogenic Changes in the Critical Zone. Sixth Interagency Conference on Research in the Watersheds, Shepherdstown, WV, July 2018. (Invited, Plenary)
Boyer EW. Biogeochemical cycling in Mid-Appalachian forested catchments. Geological Society of America, Northeastern Section meeting on Mountains to Lakes, Burlington, VT, March 2018.
Boyer EW. Nitrogen in Catchments of the United States: Current Problems and Future Solutions. American Geophysical Union, Catchment Science Symposium, New Orleans, LA, December 2017. (Invited, Keynote)
Boyer EW, RB Alexander, JN Galloway, HE Golden, R Moore, G Schwarz, JW Harvey, J Gomez-Valez, D Scott, N Schmadel, and J Clune. Factors Controlling Nitrogen Loadings in Major River Basins. American Geophysical Union, New Orleans, LA, December 2017.
Boyer EW. Nutrient Pollution in the Susquehanna and Delaware Watersheds, from the Headwaters to the Bays. 12th Annual Susquehanna River Symposium, Lewisburg, PA, November 2017. (Invited, Plenary).
Boyer EW. Inputs of Pollutants to Watersheds via Atmospheric Deposition, With Implications for Human Health and Aquatic Life. NIWR Water Conference, Water Research: Building Knowledge and Innovative Solutions. Shepherdstown, WV, October 2017.
Boyer EW, HE Golden, JN Galloway, RB Alexander, G Schwarz, J Gomez-Velez, JW Harvey, D Scott, and N Schmadel. Coupled Hydrological, Biogeochemical, and Geomorphic Processes Affecting Nutrient Loadings in Fluvial Networks. Geological Society of America, Seattle, WA, October 2017.
Boyer EW, B Reed, and J Harper. Water Quality of Three Forest Streams in Pennsylvania in Response to Decreasing Atmospheric Deposition. H33J-1697, American Geophysical Union, San Francisco, CA, December 2016.
Boyer EW, J Harper, K Horner, J Grimm, and N Irwin. Status and trends of atmospheric deposition in the Great Lakes Region of Pennsylvania. Tom Ridge Environmental Center, Regional Science Consortium, 12th Annual Research Symposium, Erie, PA, November 2016.
Boyer EW. Impacts of Atmospheric Deposition on Pennsylvania Watersheds. PA American Water Resources Association Annual Conference: Planning for Water Quality Improvements on a Watershed Basis. State College, PA, October 2015.
Boyer EW. Impacts of Atmospheric Deposition on Pennsylvania Watersheds. PA American Water Resources Association Annual Conference: Planning for Water Quality Improvements on a Watershed Basis. State College, PA, October 2015.
Boyer EW. Atmospheric Deposition in Pennsylvania. Pennsylvania Department of Environmental Protection, Air Quality Technical Advisory Committee, Harrisburg, Pennsylvania, August 2015.
Boyer EW. Water Quality in Catchments of the Northeastern USA: Toward Understanding Impacts of Atmospheric Deposition and Climatic Variability. Cornell University, Department of Agricultural and Biological Engineering, Soil & Water Seminar Series, April 13, 2015.
Boyer EW. Water quality in catchments of the Northeastern USA: toward Understanding impacts of atmospheric deposition and climatic variability. Department of Earth Sciences Seminar Series, Uppsala University, December 3, 2014.
Brooks R. Part 2: What is a healthy stream or wetland worth? Translating ecosystem services to ecosystem values’ CNS Science for Solutions Seminar Series, University Park, PA, February 27, 2015.
Brooks R., Yetter S, Nassry M, Bishop J, Ingram H, Regan C, Mazurczyk T. The art and science of translating ecological indicators to ecosystem services in riparian systems. Society of Wetland Scientists Annual Meeting, Providence, RI, May 31 June 4, 2015.
Bryant RB, AL Allen, AR Buda, PR Kleinman, EW Boyer, FM Hashem, MD King, SS Tzilkowski, LC Kibet, SA Klick, LS Saporito, and EB May. Terrestrial Sources of Urea: Allochthonous or Autochthonous? Association for the Sciences of Limnology and Oceanography, Honolulu, HI, February 2017.
Bryant RB, AR Buda, SS Tzilkowski, EW Boyer, MD King, LC Kibet, AL Allen, and EB May. Terrestrial Sources of Urea to Water in a Mixed Land Use Watershed: Implications for Nitrogen Management. 2nd International Interdisciplinary Conference on Land Use and Water Quality: Agricultural Production and the Environment. Vienna, Austria, September 2015.
Bryant RB, Buda AR, Tzilkowski SS, Boyer EW, King MD, Kibet LC, Allen AL, May EB. Terrestrial sources of urea to water in a mixed land use watershed: implications for nitrogen management. 2nd International Interdisciplinary Conference on Land Use and Water Quality: Agricultural Production and the Environment. Vienna, Austria, September 2015.
Campbell JL, Vadeboncoeur MA, Asbjornsen H, Green MB, Adams MB, EW Boyer. Evaluating biological and physical drivers of evapotranspiration trends at Northeastern US watersheds. Fifth Interagency Conference on Research in the Watersheds in Charleston, SC, March 2015.DeWalle D, Boyer E, Buda A. Relationships between long-term atmospheric wet deposition and stream chemistry in Mid-Appalachian forest catchments. 9th international conference on Acid Rain, Rochester, NY, October 2015.
DeWalle, D, E Boyer, and A Buda. Relationships Between Long-term Atmospheric Wet Deposition and Stream Chemistry in Mid-Appalachian Forest Catchments. 9th international conference on Acid Rain, Rochester, NY, October 2015.
DeWalle D, Boyer EW, Buda AR. Relationship between long-term atmospheric wet deposition and stream chemistry in Mid-Appalachian forest catchments. American Geophysical Union, San Francisco, CA, December 2014
Iavorivska L, Boyer E, Grimm J,Fuentes J. Quantifying rates of atmospheric dissolved organic matter deposition in the Northeastern United States. 9th international conference on Acid Rain, Rochester, NY, October 2015.
Ready R. Valuing ecosystem services generated by nutrient reductions—a spatial approach. EPA Water Research Webinar Series, August 31, 2016.
Ready, R. Center for Nutrient Solutions (CNS): An Innovative Approach to Exploring Nutrient Pollution Solution Scenarios, US EPA National Priority Centers Kickoff Workshop, Narragansett, RI, January 18, 2015.
Ready R. Part 1: What is a healthy stream or wetland worth? Translating ecosystem services to ecosystem values. CNS Science for Solutions Seminar Series, University Park, PA, December 5, 2014.
Redder BW, EW Boyer, AR Buda, CD Kennedy, DR DeWalle, and GJ Folmar. Groundwater-Surface Water Interactions Affecting Water and Nitrogen Fluxes in an Agricultural Watershed. Geological Society of America, Indianapolis, IN, November 2018.
Redder B, A Buda, C Kennedy, G Folmar, DR DeWalle, and EW Boyer. Quantifying Nitrogen Transport from Riparian Groundwater Seeps to a Headwater Stream in an Agricultural Watershed. American Geophysical Union, New Orleans, LA, December 2017.
Redder B, A Buda, and E Boyer. Transport and Transformations of Nitrogen in Groundwater Seeps Along the Stream Corridor of an Agricultural Watershed. NIWR Water Conference, Water Research: Building Knowledge and Innovative Solutions. Shepherdstown, WV, October 2017
Regan C, Yetter S, Veith T, Collick A, Brooks R. Nutrient/sediment runoff and ecological condition: linking the SWAT-VSA model with empirical measures. Maryland Water Monitoring Conference, North Linthicum, MD, November 21, 2014.
Roy K, Pembrook H, Nelson S, Ricassi A, McHale M, Boyer E, Lampman G, Funk C. Long term monitoring of acidification in sensitive areas of the Eastern United States: A new generation of research. 9th international conference on Acid Rain, Rochester, NY, October 2015
Royer, M. Achieving Participatory Catchment Management through “Shared Discovery” Research Models: The Center for Nutrient Solutions Approach. Agricultural Phosphorus Management Workshop, Aas, Norway, August 13, 2018.
Royer, M. Center for Nutrient Solutions: Innovative engagement, outreach and education through shared discovery. US EPA National Priority Centers Kickoff Workshop, Narragansett, RI, January 18, 2015.
Royer M. Legal and policy drivers of nutrient pollution solutions. CNS Science for Solutions Seminar Series, University Park, PA, October 10, 2014.
Shortle J. Nutrient trading: Potentials and challenges in the Baltic Sea. European Maritime Day Conference on “Investing in blue growth—smart and sustainable solutions,” Turku, Finland, May 18, 2016. (Invited)
Shortle J. Nutrient trading: What have we learned? Central Baltic Programme Nutritrade Project Workshop on Flexible Policy Instruments for Promoting Cost-Effective Nutrient Reductions in the Baltic Sea, US Embassy, Helsinki, Finland, May 16, 2016. (Invited)
Shortle J. Nutrient pollution: a wicked challenge for economic instruments. 2016 CLEAN Center Annual Stakeholder Meeting, Ft. Collins, CO, February 23, 2016. (Invited)
Shortle, J. Innovating public policy to address nutrient pollution from agriculture. Columbia Water Center American Water Webinar Series. November 12, 2015. (Invited) http://water.columbia.edu/2015/11/12/next-americas-water-webinar-series-innovating-policy-to-address-nutrient-pollution-from-agriculture/
Shortle, J. Endogenous risk and non-point uncertainty trading ratios. Energy and Environmental Economics Seminar Series, Penn State University, University Park, PA, November 11, 2015
Shortle J. Water quality and agriculture: policies to harmonize food production with protection of aquatic ecosystems and ecosystem services. University of Illionois Institute for Sustainability, Energy, and Environment 2015 CONGRESS: Water Planet, Water Crisis? Meeting the World’s Water-Food-Energy Needs Sustainably. Champaign-Urbana, IL, September 15, 2015. (Invited) For related press, see http://investigatemidwest.org/2015/09/17/researches-weigh-in-on-water-quality-agricultural-runoff/
Shortle J. Improving the efficiency and effectiveness of agri-environmental policies. PA Department of Environmental Protection Chesapeake Bay Agricultural Advisory Committee. Harrisburg, PA, June 18, 2015Water Quality Trading. Penn State Extension Water Resources Seminar Series, May 27, 2015. (Invited) http://extension.psu.edu/natural-resources/water/news/2015/pennstate-webinar-discusses-water-quality-trading
Shortle J, Veith T, Amin M. Watershed modeling research for nutrient pollution management. Penn State College of Agricultural Sciences Research Tour, Loganton, PA September 22, 2016. (Invited)
Veith, TL, Amin M, Collick AS, Karsten HD. Best management practices for reducing nutrient loads in a sub-watershed of Chesapeake Bay. SWAT 2015 International Soil and Water Assessment Tool Conference. p. 38. Purdue University, West Lafayette, IN. http://swat.tamu.edu/media/114933/swat-purdue-2015-book-of-abstracts.pdf
Veith TL, Collick AS, Yetter S, Regan C, Nassry M. Closing the prediction gap between agricultural nutrient losses and riparian zone ecology. SWAT 2015 International Soil and Water Assessment Tool Conference. p. 89. Purdue University, West Lafayette, IN. http://swat.tamu.edu/media/114933/swat-purdue-2015-book-of-abstracts.pdf
Veith, TL, Gall, HE, Shortle, J, Brooks, R, Kleinman, PJA. 2018. Moving Towards Sustainable Land Management in the Chesapeake Bay Through Novel Engagement Strategies. #H43K-2624, AGU 2018 Fall Meeting, Dec 10-14, 2018, Washington DC.
Yetter, S, Shortle, J, Brooks R, Boyer EW, Kemanian A, Kleinman P, Bills B, Ready R, and Royer M. Center for Integrated Multi-Scale Nutrient Pollution Solutions. US EPA National Priority Centers Kickoff Workshop, Narragansett, RI, January 18, 2015.
Popular Press
Mulhollem, Jeff. 2018. ‘Conservation dairy farming could help Pa. meet Chesapeake target‘, Penn State News. September 13, 2018 https://news.psu.edu/story/536381/2018/09/13/research/conservation-dairy-farming-could-help-pa-meet-chesapeake-target
Penn State. ‘Conservation dairy farming could help Pa. meet Chesapeake target.’ ScienceDaily. ScienceDaily, 13 September 2018.http://www.sciencedaily.com/releases/2018/09/180913134548.htm
Journal Articles: 14 Displayed | Download in RIS Format
| Other center views: | All 57 publications | 14 publications in selected types | All 14 journal articles |
|---|
| Type | Citation | ||
|---|---|---|---|
|
|
Amin MGM, Veith TL, Collick AS, Karsten HD, Buda AR. Simulating hydrological and nonpoint source pollution processes in a karst watershed: a variable source area hydrology model evaluation. Agricultural Water Management 2017;180(Part B):212-223. |
R835568 (2016) R835568 (2017) |
Exit Exit Exit |
|
|
Amin M, Veith T, Shortle J, Karsten H, Kleinman P. Addressing the spatial disconnect between national-scale total maximum daily loads and localized land management decisions. JOURNAL OF ENVIRONMENTAL QUALITY 2020;49(3):613-627. |
R835568 (Final) |
Exit Exit |
|
|
Coi D, Ready R, Shortle J. Valuing water quality benefits from adopting best management practices:A spatial approach. JOURNAL OF ENVIRONMENTAL QUALITY 2020;49(3):582-592. |
R835568 (Final) |
Exit Exit |
|
|
DeWalle DR, Boyer EW, Buda AR. Exploring lag times between monthly atmospheric deposition and stream chemistry in Appalachian forests using cross-correlation. Atmospheric Environment 2016;146:206-214. |
R835568 (2016) R835568 (2017) |
Exit Exit Exit |
|
|
Horan R, Shortle J. Endogenous Risk and Point-nonpoint Uncertainty Trading Ratios. AMERICAN JOURNAL OF AGRICULTURAL ECONOMICS 2017;99(2):427-446. |
R835568 (Final) |
Exit Exit |
|
|
Iavorivska L, Boyer EW, Miller MP, Brown MG, Vasilopoulos T, Fuentes JD, Duffy CJ. Atmospheric inputs of organic matter to a forested watershed: variations from storm to storm over the seasons. Atmospheric Environment 2016;147:284-295. |
R835568 (2016) R835568 (2017) |
Exit Exit Exit |
|
|
King MD, Bryant RB, Saporito LS, Buda AR, Allen AL, Hughes LA, Hashem FM, Kleinman PJ, May EB. Urea release by intermittently saturated sediments from a coastal agricultural landscape. Journal of Environmental Quality 2017;46(2):302-310. |
R835568 (2017) |
Exit Exit Exit |
|
|
Kuwayama Y, Olmstead S. Hydroeconomic modeling of resource recovery from wastewater:Implications for water quality and quantity management. JOURNAL OF ENVIRONMENTAL QUALITY 2020;49(3):593-602. |
R835568 (Final) |
Exit Exit |
|
|
Leonard L, Duffy CJ. Automating data-model workflows at a level 12 HUC scale: watershed modeling in a distributed computing environment. Environmental Modelling & Software 2014;61:174-190. |
R835568 (2014) R835568 (2015) R835568 (2016) |
Exit Exit Exit |
|
|
Miller MP, Boyer EW, McKnight DM, Brown MG, Gabor RS, Hunsaker CT, Iavorivska L, Inamdar S, Johnson DW, Kaplan LA, Lin H, McDowell WH, Perdrial JN. Variation of organic matter quantity and quality in streams at Critical Zone Observatory watersheds. Water Resources Research 2016;52(10):8202-8216. |
R835568 (2016) R835568 (2017) |
Exit Exit |
|
|
Ranjan R, Shortle J. Protecting and restoring aquatic ecosystems in multiple stressor environments. Water Economics and Policy 2017;3(2):650011. |
R835568 (2016) R835568 (2017) |
Exit Exit |
|
|
Sebestyen SD, Shanley JB, Boyer EW, Kendall C, Doctor DH. Coupled hydrological and biogeochemical processes controlling variability of nitrogen species in streamflow during autumn in an upland forest. Water Resources Research 2014;50(2):1569-1591. |
R835568 (2015) R835568 (2016) |
Exit Exit Exit |
|
|
Shortle J, Horan RD. Nutrient pollution: a wicked challenge for economic instruments. Water Economics and Policy 2017;3(02):1650033. |
R835568 (2016) R835568 (2017) |
Exit |
|
|
Williams MR, Buda AR, Elliott HA, Hamlett J, Boyer EW, Schmidt JP. Groundwater flow path dynamics and nitrogen transport potential in the riparian zone of an agricultural headwater catchment. Journal of Hydrology 2014;511:870-879. |
R835568 (2014) R835568 (2015) R835568 (2016) |
Exit Exit Exit |
Relevant Websites:
Center for Nutrient Solutions Exit
USDA Agricultural Research Service
Penn State Environment and Natural Resources Institute Exit
Penn State Integrated Hydrologic Modeling System Exit
Penn State Riparia Center Exit
Elizabeth Boyer, Department of Ecosystem Science & Management Exit
Kemanian Agroecosystems Modeling Laboratory Exit
Progress and Final Reports:
Original AbstractThe perspectives, information and conclusions conveyed in research project abstracts, progress reports, final reports, journal abstracts and journal publications convey the viewpoints of the principal investigator and may not represent the views and policies of ORD and EPA. Conclusions drawn by the principal investigators have not been reviewed by the Agency.