
Grantee Research Project Results
2015 Progress Report: Center for Integrated Multi-scale Nutrient Pollution Solutions
EPA Grant Number: R835568Center: Center for Integrated Multi‐scale Nutrient Pollution Solutions
Center Director: Shortle, James S.
Title: Center for Integrated Multi-scale Nutrient Pollution Solutions
Investigators: Shortle, James S. , Brooks, Robert P. , Boyer, Elizabeth W. , Ready, Richard C , Royer, Matthew B , Bills, Brian , Kemanian, Armen
Institution: Pennsylvania State University , The State University of New York
Current Institution: Pennsylvania State University , University of Maryland - Eastern Shore , USDA
EPA Project Officer: Packard, Benjamin H
Project Period: September 1, 2013 through August 31, 2018
Project Period Covered by this Report: September 1, 2014 through August 31,2015
Project Amount: $2,220,649
RFA: Centers for Water Research on National Priorities Related to a Systems View of Nutrient Management (2012) RFA Text | Recipients Lists
Research Category: Watersheds , Water
Objective:
The Center for Integrated Multi-scale Nutrient Pollution Solutions (CNS) is a collaboration of scientists and community partners engaged in a ‘shared dscovery’ process to develop an integrated systems approach to enhance the decision making capacity of key water and nutrient management institutional agents. Efforts to reduce nutrient pollution are needed at different scales (Figure 1). Many individual sources of nutrients and sediment occur at the scale of the individual farm or property and require a ‘bottom up’ approach to conservation. However, bottom up approaches lack the replication mechanisms provided by regional planning and national policy. Conversely, top-down approaches, such as Chesapeake Bay Program policy directives, may lack an effective delivery mechanism at the ground level. Both approaches are needed to ensure success, but clear connections must be established in the middle. A primary goal of the CNS is to provide connections between policy directives and on-the-ground actions.
Figure 1. Conceptual diagram depicting CNS in relation to various levels of nutrient pollution applications, from policy directives to individual farm best management practices
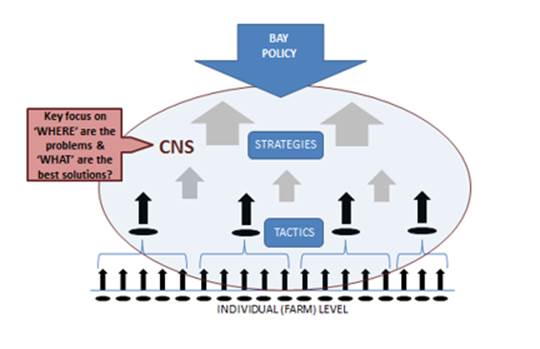
In order to provide these connections between policy and farm-level tactics, we must move beyond the old paradigm or 'BMP fix' to discover optimal solutions that reduce nutrient pollution through understanding 1) the sources and flow paths of nutrients as they impact water quality and ecosystem function, 2) how individual management practices integrate and aggregate from field to watershed scales and beyond, and 3) how this information is translated at different management levels to produce effective action and successful results. Thus, the main objective of the CNS is to use an integrated decision support process involving modeling, empirical data, and lessons learned to develop community-based, spatially-explicit, nutrient intervention scenarios that engage and inform stakeholders for high impact water management decisions.
This process involves several steps, which are carried out via seven team sub-projects: Team 1—Drivers and Interventions; Team 2—Harmonizing Models; Team 3—Ecological Assessment; Team 4—Best Management Practices; Team 5—Informatics; Team 6—Economics and Ecosystem Services; and Team 7—Engagement, Education, and Outreach. For more information on team objectives, progress and results, refer to the individual sub-project summaries below.
Progress Summary:
The second year of the project was primarily centered on the following activities:
- Meetings with CNS (all-hands) personnel (September 2014, May 2015), CPC (September 2014, May 2015), watershed stakeholders (March 2015), Science Advisory Committee (March 2015), and other NCER centers (January 2015) to improve integration within and across research teams, review progress and plan next steps, refine scenario building and foster communication, and identify barriers and improve connections between people working at all levels from farm to mid-level management to regional policy.
- Building and running scenarios in the four focal watersheds: Mahantango Creek, Spring Creek, Conewago Creek, and Manokin River. Using feedback obtained from our all-hands meeting with the Community Partners Council (CPC) in September 2014, we finalized our multiple scenario approach for each watershed, which consists of the following five scenarios: Scenario A (Baseline analysis), Scenario B ( Implementation of the Chesapeake Bay Watershed Implementation Plans (WIPs)), Scenario C (Smart WIP implementation emphasizing low-cost, efficient tactics and strategies), Scenario D (Implement tactics and strategies to meet multi-objective local watershed goals), and Scenario E (Transformational strategies). We first tested the scenario building process by initially applying Scenarios A, B, and C on a small sub-watershed of Mahantango Creek (WE38—the USDA ARS' intensive study watershed). The main purpose of this step was to confirm the specific steps necessary to complete a scenario, including flows between teams.
- Chesapeake Bay Program (CBP) model land use and management translations: In order to make more informed, strategic watershed management decisions, we need tools that operate on more precise spatial scales than the CBP model (i.e., Soil and Water Assessment Tool (SWAT) and Penn. State Integrated Hydrologic Model (PIHM)/Cycles models). Working with modelers at the CBP, who provided both current (2012) and projected (2025) WIP BMP implementation data, we first translated the CBP model land use and management regimes that lack spatial reference into options that could be placed on the ground by CNS models. We then translated the CNS model results back to the CBP model and total maximum daily load (TMDL) progress.
- Final selection and communication with the Scientific Advisory Committee (SAC). CNS leaders met with the SAC to introduce the CNS, discuss SAC roles in the project, and determine next steps for interaction between SAC and CNS members.
- Initiation of watershed stakeholder meetings, which provided additional detail on current management and agricultural operations in each watershed. They also helped to identify priority BMPs or strategies and target locations, as well as identify local priorities and objectives for use in Scenario D (implementation of local watershed objectives). Meetings were held in the Manokin River and Conewago Creek watersheds. Refer to Team 7 progress for more details.
- Continuation of CNS seminar series titled 'Science for Solutions: Combating the Wicked Nutrient Problem.' Each seminar was conducted in webinar format with recordings available on the CNS website. Online audiences included stakeholders from academia, government agencies, consulting firms, and nonprofits.
- Individual team progress: Other progress is covered under specific team projects and can be found under the appropriate sub-project summaries. Some examples of questions posed by each team and their preliminary results are included below.
Team 1 (Drivers & Interventions)
Questions: How can nutrient budgets guide understanding of where to target management practices? How far will reductions in atmospheric deposition take us?
Findings: Nutrient budgets provide a framework for benchmarking the current situation and for assessing future progress. Quantifying the fluxes remains challenging and highlights the need for long term monitoring and data availability. Between 1990 and 2014, significant decreases in atmospheric deposition of nitrogen occurred, largely due to the amendments to the Clean Air Act Amendments and subsequent emissions reductions policies; however, these reductions have stabilized, making additional reductions to the level needed to meet Bay TMDL 2025 goals highly unlikely from these sectors. Reductions in nitrogen inputs from non-regulated sectors (e.g., agricultural emissions to the atmosphere and inputs to the landscape) will be required.
Team 2 (Harmonizing Models)
Question: Can knowledge of modeled hydrologic flows improve estimates of nutrient and sediment flows?
Findings: Groundwater flowpaths can be significant sources of nitrogen transport, while phosphorus is transported more through sediment in surface water runoff. PIHM simulations of groundwater wetting and drainage pathways during storm events in WE38 (a small sub-watershed of Mahantango Creek) improved identification of critical source areas (e.g., flow accumulation areas and sections discharging to streams) and selection of targeting options of BMP placement throughout the sub-watershed.
Team 3 (Ecological Assessment)
Question: How can ecological assessments inform management decisions at multiple levels?
Findings: Information on baseline ecological condition can provide a benchmark for measuring the degree of success of management actions, and identification of probable onsite stressors can help guide selection of types and locations of BMPs. This information can be gathered at site (e.g., farm or stream reach), tributary, and/or watershed levels. Baseline information on biological and ecological condition and onsite stressors noted in the Mahantango Creek watershed suggested the majority of headwaters within the upper portions of Mahantango Creek are in poorer condition than the upper portions of Deep Creek and Pine Creek. Riparian buffers and stream bank fencing of pastures in headwaters of Upper Mahantango, including the WE38 subwatershed, along with stream bank restoration along the larger stream channels (lower Deep Creek and Mahantango mainstem) are most likely needed if ecological condition is to improve.
Team 4 (Best Management Practices)
Question: Can we refine models of nutrient and sediment flows to reflect smaller spatial scales?
Findings: Nutrient and sediment flows can be simulated at smaller spatial scales (e.g., small sub-basins or tributaries), but the process is highly labor-intensive and requires several iterations along with detailed knowledge of current and alternative management practices. Additional information on ecosystem services or socioeconomic benefits that are important and unique to the watershed also can be helpful in guiding model simulations.
Team 5 (Informatics)
Question: How do we convey important messages to multiple audiences?
Findings: The collaborative project web portal (Center for Nutrient Solutions | Penn State) will be most useful if it provides answers about where the problems are located and what tactics work best in each watershed. This was a common request from our CPC members and watershed stakeholders; however, the specific type of information or format differed between audiences. We need to focus in on our target audience(s) and communicate the appropriate messages accordingly. The map-based web application can assist multiple audiences in visualizing scenario outputs within the context of their question(s).
Team 6 (Economics and Ecosystem Services)
Question: How do stream (local) and Chesapeake Bay water quality benefits compare?
Findings: Based on a comparison of annual values in changes in stream/river water quality resulting from WIP implementations at Mahantango Creek and Bay scales, the benefit of improving Bay water quality was much larger than the total benefit from improved river and stream water quality (~ $11.6 million per year vs. ~ $2.2 million per year, respectively).
Team 7 (Engagement, Education and Outreach)
Question: What level and types of conservation practices exist in a particular watershed and where? Whay types are still needed?
Findings: A common theme among watersheds appears to be an increase in non-commercial or 'hobby' farms (e.g., small horse farms, households growing their own beef, etc.). Conservation practices already exist on large commercial farms in the watershed, because these farmers are typically targets for education and regulation. Conservation practices often are nonexistent, however, on hobby farms, due in part to lack of regulation as well as education/outreach opportunities.
Future Activities:
Center-wide activities planned for Year 3 include the following:
- Finalize the SWAT-modeled scenario runs with addition of PIHM-Cycles.
- Engage stakeholders in the remaining study watersheds (Spring Creek, Mahantango Creek) in scenario development, selection of scenario outcome evaluation criteria, and assessment of scenario outcomes.
- Conduct additional all-hands, CPC, and SAC meetings to further project goals and objectives.
- Continue development of tools and resources for target audiences with active engagement of stakeholders to determine needs, appropriate tools, and deployment methods. Given our interest in the development of processes that can be generalized beyond the project, we will actively capture and evaluate these developmental processes. These results will be referred back to the CPC and SAC for input.
Journal Articles: 14 Displayed | Download in RIS Format
| Other center views: | All 57 publications | 14 publications in selected types | All 14 journal articles |
|---|
| Type | Citation | ||
|---|---|---|---|
|
|
Amin MGM, Veith TL, Collick AS, Karsten HD, Buda AR. Simulating hydrological and nonpoint source pollution processes in a karst watershed: a variable source area hydrology model evaluation. Agricultural Water Management 2017;180(Part B):212-223. |
R835568 (2016) R835568 (2017) |
Exit Exit Exit |
|
|
Amin M, Veith T, Shortle J, Karsten H, Kleinman P. Addressing the spatial disconnect between national-scale total maximum daily loads and localized land management decisions. JOURNAL OF ENVIRONMENTAL QUALITY 2020;49(3):613-627. |
R835568 (Final) |
Exit Exit |
|
|
Coi D, Ready R, Shortle J. Valuing water quality benefits from adopting best management practices:A spatial approach. JOURNAL OF ENVIRONMENTAL QUALITY 2020;49(3):582-592. |
R835568 (Final) |
Exit Exit |
|
|
DeWalle DR, Boyer EW, Buda AR. Exploring lag times between monthly atmospheric deposition and stream chemistry in Appalachian forests using cross-correlation. Atmospheric Environment 2016;146:206-214. |
R835568 (2016) R835568 (2017) |
Exit Exit Exit |
|
|
Horan R, Shortle J. Endogenous Risk and Point-nonpoint Uncertainty Trading Ratios. AMERICAN JOURNAL OF AGRICULTURAL ECONOMICS 2017;99(2):427-446. |
R835568 (Final) |
Exit Exit |
|
|
Iavorivska L, Boyer EW, Miller MP, Brown MG, Vasilopoulos T, Fuentes JD, Duffy CJ. Atmospheric inputs of organic matter to a forested watershed: variations from storm to storm over the seasons. Atmospheric Environment 2016;147:284-295. |
R835568 (2016) R835568 (2017) |
Exit Exit Exit |
|
|
King MD, Bryant RB, Saporito LS, Buda AR, Allen AL, Hughes LA, Hashem FM, Kleinman PJ, May EB. Urea release by intermittently saturated sediments from a coastal agricultural landscape. Journal of Environmental Quality 2017;46(2):302-310. |
R835568 (2017) |
Exit Exit Exit |
|
|
Kuwayama Y, Olmstead S. Hydroeconomic modeling of resource recovery from wastewater:Implications for water quality and quantity management. JOURNAL OF ENVIRONMENTAL QUALITY 2020;49(3):593-602. |
R835568 (Final) |
Exit Exit |
|
|
Leonard L, Duffy CJ. Automating data-model workflows at a level 12 HUC scale: watershed modeling in a distributed computing environment. Environmental Modelling & Software 2014;61:174-190. |
R835568 (2014) R835568 (2015) R835568 (2016) |
Exit Exit Exit |
|
|
Miller MP, Boyer EW, McKnight DM, Brown MG, Gabor RS, Hunsaker CT, Iavorivska L, Inamdar S, Johnson DW, Kaplan LA, Lin H, McDowell WH, Perdrial JN. Variation of organic matter quantity and quality in streams at Critical Zone Observatory watersheds. Water Resources Research 2016;52(10):8202-8216. |
R835568 (2016) R835568 (2017) |
Exit Exit |
|
|
Ranjan R, Shortle J. Protecting and restoring aquatic ecosystems in multiple stressor environments. Water Economics and Policy 2017;3(2):650011. |
R835568 (2016) R835568 (2017) |
Exit Exit |
|
|
Sebestyen SD, Shanley JB, Boyer EW, Kendall C, Doctor DH. Coupled hydrological and biogeochemical processes controlling variability of nitrogen species in streamflow during autumn in an upland forest. Water Resources Research 2014;50(2):1569-1591. |
R835568 (2015) R835568 (2016) |
Exit Exit Exit |
|
|
Shortle J, Horan RD. Nutrient pollution: a wicked challenge for economic instruments. Water Economics and Policy 2017;3(02):1650033. |
R835568 (2016) R835568 (2017) |
Exit |
|
|
Williams MR, Buda AR, Elliott HA, Hamlett J, Boyer EW, Schmidt JP. Groundwater flow path dynamics and nitrogen transport potential in the riparian zone of an agricultural headwater catchment. Journal of Hydrology 2014;511:870-879. |
R835568 (2014) R835568 (2015) R835568 (2016) |
Exit Exit Exit |
Supplemental Keywords:
nutrient pollution, best management practices, BMPs, nitrogen and phosphorus budgets, community engagement, hydrological models, stakeholders, shared discovery, scenarios, partnership, decision support, Pennsylvania Integrated Hydrologic Model, PIHM, cycles, agro-ecosystem models, model intercomparison, HydroTerre, cyber-infrastructure, nutrient and pollution transformation and transport, SWAT modeling, tactical interventions, Stream-Wetland-Riparian Index, ecological assessment, ecosystem services, nonmarket valuation, aquatic macroinvertebrates, watershed planning, Chesapeake Bay, Susquehanna River, Mid-Atlantic RegionRelevant Websites:
- Center for Nutrient Solutions | Penn State Exit
- USDA Agricultural Research Service
- Environment and Natural Resources Institute — Penn State Exit
- Penn State Integrated Hydrologic Modeling System Exit
- Riparia | Penn State Exit
- Kemanian Agroecosystems Modeling Laboratory: Cycles | Penn State College of Agricultural Sciences Exit
Progress and Final Reports:
Original AbstractThe perspectives, information and conclusions conveyed in research project abstracts, progress reports, final reports, journal abstracts and journal publications convey the viewpoints of the principal investigator and may not represent the views and policies of ORD and EPA. Conclusions drawn by the principal investigators have not been reviewed by the Agency.