
Grantee Research Project Results
2015 Progress Report: Cloud Condensation Nuclei Measurements During the SENEX 2013 Campaign: Observations, Analysis and Impacts
EPA Grant Number: R835410Title: Cloud Condensation Nuclei Measurements During the SENEX 2013 Campaign: Observations, Analysis and Impacts
Investigators: Nenes, Athanasios
Institution: Georgia Institute of Technology
EPA Project Officer: Chung, Serena
Project Period: June 15, 2013 through June 14, 2016 (Extended to June 14, 2017)
Project Period Covered by this Report: June 15, 2015 through June 14,2016
Project Amount: $185,790
RFA: Anthropogenic Influences on Organic Aerosol Formation and Regional Climate Implications (2012) RFA Text | Recipients Lists
Research Category: Air Quality and Air Toxics , Air , Climate Change
Objective:
The southeastern United States is characterized by high biogenic and anthropogenic emissions and active photochemistry. The interaction between biogenic and anthropogenic aerosol is not well characterized and contribute to the anomalous cooling trend observed in the southeast United States. With support of the EPA STAR grant, we carried out measurements of cloud condensation nuclei (CCN) data collected aboard the NOAA WP-3D during the June-July 2013 Southeast Atmosphere Study (SENEX 2013), and on the ground at the Centerville SOAS site to address the following scientific questions:
- What are the hygroscopicity, CCN activity and activation kinetics of aerosols in the Southeast United States (SE US)? How do these parameters relate to aerosol chemical composition and size distribution? What is the spatiotemporal evolution of these parameters?
- How does this evolution affect CCN activity, hygroscopicity, and droplet activation kinetics of aerosol?
- What are the similarities and differences of SE US aerosol against other locations of the globe (urban, rural, continental, remote, anthropogenic, biogenic, biomass burning)? How does the mixing of anthropogenic and biogenic aerosol precursors affect observed hygroscopicity and activation kinetics?
- What is the indirect forcing associated with SE US aerosol? How complex should be the size distribution-composition-CCN-activity relationship, to adequately represent the aerosol-CCN link?
Progress Summary:
Scanning Flow CCN Analysis: Effects of Flow Waveform and Operation Characteristics
The Droplet Measurement Technologies Continuous Flow Streamwise Thermal Gradient Cloud Condensation Nuclei (CCN) Counter (DMT CFSTGC) is widely used to measure CCN concentrations and study aerosol hygroscopicity, and was a key instrument for this EPA STAR proposal. When operated in Scanning Flow CCN Analysis (SFCA) mode (Moore and Nenes, 2009), the instrument is capable of providing measurements of CCN over a wide range of supersaturations ("CCN spectra) over a short period of time (20-120 s). SFCA works by varying the instrument flow rate to follow a characteristic "waveform over 20-120 s cycles, during which CCN spectra are obtained. The ability to quickly measure CCN spectra is advantageous for airborne measurements as well as ground-based measurements of rapidly changing environments, and was a major tool during the SENEX and SOAS measurements.
To date, implementation of SFCA with the DMT CFSTGC was realized with a software patch to the existing instrument software that allowed for SFCA flow cycles with linear upscans and downscans, by varying the voltage sent to the proportional valve controlling the flow rate through the instrument. During this proposal, we developed and implemented a hardware module consisting of an Arduino microcontroller coupled to a modified mass flow controller and attached it to the CFSTGC unit for precise flow control and flexibility to follow any arbitrary flowscan profile and waveform. The use of the new hardware module reduces the uncertainty in supersaturation compared to published SFCA operation, which allowed for efficient usage of downcycle data.
We then carried out a thorough and comprehensive study on the performance of the augmented SFCA instrument. The focus was on triangular and sinusoid SFCA flow cycles for a range of operation pressures and scancycles frequently carried out during airborne operation (600 - 900 mb pressure and 30 to 120s scan periods). The study was a needed addition to the literature, as SFCA operation develops a periodic pressure perturbation during a flow cycle that generates compressive/expansive heating and cooling inside the instrument column and shifts instantaneous supersaturation away from steady-state flow calibrations. A question on whether this fluctuation differs between lab calibrations and in-flight operation (hence introducing supersaturation uncertainty) needed to be addressed.
The above motivated a study (Lin et al., in preparation) to comprehensively understand the source of these pressure fluctuations and how they influence supersaturation - between lab and ambient operation of SFCA. For this, we carried out a careful set of calibration experiments, which together with in-flight data, was interpreted with a comprehensive Computational Fluid Dynamics (CFD) model of SFCA The model identifies how flow rate range and sample inlet temperature need to be considered when using lab-based calibrations to interpret ambient SFCA data. Model accuracy is verified using a broad set of data which include ammonium sulfate calibration data (under conditions of low CCN concentration) and airborne measurements where either the instrument pressure was not controlled or where exceptionally high CCN loadings were observed.
A summary of the SFCA calibration experiments is given in Table 1. The experiments were per- formed in order to evaluate the effects of pressure, type of wave form, and wave form period on instrument supersaturation during SFCA operation. The type of waveform and wave period are both expected to have differing contributions to the SFCA supersaturation based on differing changes in flow rate for each waveform or wave period. The experimental setup for evaluating SFCA operation follows that of Moore and Nenes (2009). Ammonium sulfate calibration aerosol is size-selected us- ing a differential mobility analyzer (DMA 3080, TSI). The classified aerosol is mixed with particle- free dilution air before being split between a condensation particle counter (CPC 3010, TSI) and the CFSTGC. Pressure inside the CFSTGC is controlled with a DMT pressure control box.
The results from the set of calibrations are shown in Figure 1 for triangle waves and Figure 2 for sinusoid waves. For comparison, calibrations at various constant flow rates are also shown in the figures. It can be seen that some of the calibrations show large deviations from the supersaturation curve obtained from conventional operation while others behave similarly to conventional operation. Instrument supersaturation range decreases with decreasing instrument pressure while increasing with decreasing flow scan period. A change of flow scan waveform from triangle to sine wave enabled by the new hardware also brings an increase in supersaturation range. Future implementations of SFCA will largely benefit from these findings.
Table 1. Calibration experiments performed for SFCA study (Lin et al., in preparation).
| ΔT(K) | Pressure (mb) | Waveform | Period (s) | ΔT (K) | Pressure (mb) | Waveform | Period (s) |
|---|---|---|---|---|---|---|---|
| 30 | 30 | ||||||
| 60 | 60 | ||||||
| Triangle 120 30 | Triangle 120 240 | ||||||
| 10 | 900 |
| 10 | 600 |
| ||
| 30 | 30 | ||||||
| 60 | 60 | ||||||
| Sinusoid | Sinusoid | ||||||
| 120 | 120 | ||||||
| 240 | 240 | ||||||
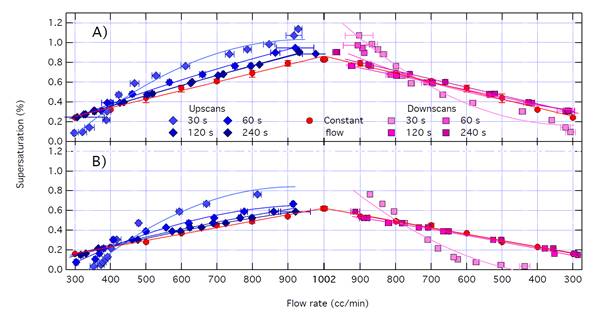
Figure 1 : Calibration curves of instrument supersaturation versus flow rate for triangle flow scans at (A) 900 mb pressure and (B) 600 mb pressure. Different symbols denote different scan cycle time. Also shown in red are instrument supersaturations at constant flow rates. Data obtained from Lin et al. (in preparation).
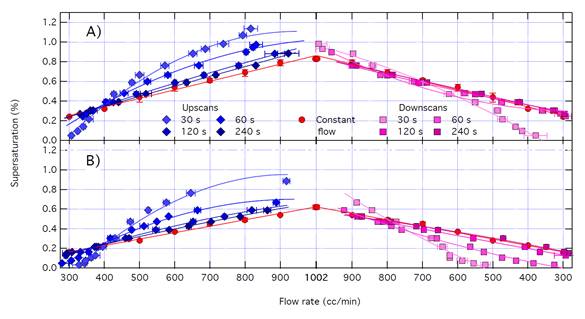
Figure 2 : Calibration curves of instrument supersaturation versus flow rate for sinusoid flow scans at (A) 900 mb pressure and (B) 600 mb pressure. Different symbols denote different scan cycle time. Data obtained from Lin et al. (in preparation).
The full CFSTGC model was run for both field and calibration experiments to compare supersaturation profiles that develop under both environments; an example of the analysis is shown in Figure 3. The left panel of the figure shows the actual SFCA data collected during SENEX Flight 5, while the right panel shows the supersaturation that is developed during field operation (blue dots). Compared to laboratory conditions present during the calibrations (black lines), the simulations show that changing conditions during flights affect instrument supersaturation in a way that cannot be captured by calibrations done on the ground. The model is able to identify the effects of multiple smaller differences in instrument operational parameters on instrument supersaturation, highlighting to importance of running the model for flight experiments.
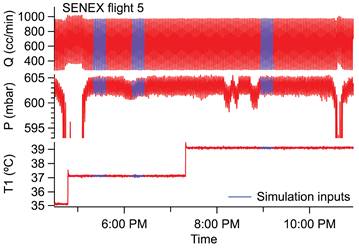
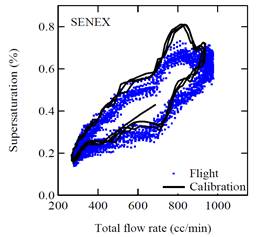
Figure 3 : Calibration curves of instrument supersaturation versus flow rate for triangle flow scans at (A) 900 mb pressure and (B) 600 mb pressure. Different symbols denote different scan cycle time. Also shown in red are instrument supersaturations at constant flow rates. Data obtained from Lin et al. (in preparation).
In the flights data simulated in this study, the largest driver in differences in supersaturation was the flow rate range followed by the column top temperature. The effect of flow rate range on instrument supersaturation highlights the importance of controlling the flow rate in the CFSTGC. This suggests inclusion of temperature and pressure data to the mass flow controller as a method for improving flow rate control and increasing the reliability of the supersaturation generated in the instrument. Alltogether, this points to improvements in SFCA that will greatly enhance its robustness and ability to design scan cycles for any measurement purpose.
SENEX data and analysis: hygroscopicity, CCN activity and impact on clouds
CCN measurements were carried out onboard the WB-P3 successfully using the augmented Scanning Flow CCN Analysis technique presented above; for more than 80% of the flights. A map of all the flight paths for which CCN data were collected successfully are shown in Figure 4. All data have been processed and archived for usage by groups worldwide.
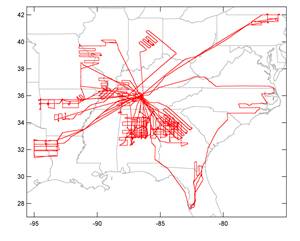
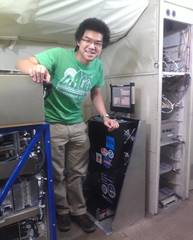
Figure 4: (left) Flight tracks of the WP-3D for which CCN data were collected. (right) Installation of the CCN instrument onboard the P3, with Nenes group graduate student Jack Lin whom operated and maintained the SFCA instrument (shown in the lower left right part of the picture) throughout the campaign.
An important outcome of the measurements and analysis thereof are simple and comprehensive parameterizations that link aerosol chemical composition with CCN activity and droplet activation kinetics. These parameterizations are readily required in studies of aerosol-cloud interactions and studies that require a quantification of aerosol water uptake. We have processed all the data to obtain the climate relevant properties (hygroscopicity, water vapor uptake coefficients) and are in the process of writing up the results for peer-review (Bougiatioti et al., in preparation). Representative results are presented in Figure 5, where aircraft data sampling above the SOAS Centerville ground site is compared against observations obtained concurrently on the ground. In general, the two datasets agree in terms of the CCN activity of the aerosol (Figure 5, left panel). A unique feature however of the airborne data is the appearance of a secondary mode of ultrafine aerosol (modal diameter ~ 40nm) which is highly hygroscopic (hygroscopicity of ~0.6). This is most likely the influence of powerplant plumes that is not seen on the ground.
Figure 5: (a) Fraction of the aerosol that is CCN-active as a function of water vapor supersaturation (left panel). Data shown on board the aircraft (red symbols) are contrasted against data collected on ground above the Centerville ground site (blue symbols). (b) size distribution (red line) and size-resolved hygroscopicity (symbols) derived from combination of the CCN data and the size distribution data. Note that the hygroscopicity of the aerosol increases as the particle size decreases.The pie chart denotes average composition and hygroscopicity Data from Bougiatioti et al., in preparation.
The direct microphysical link between aerosol and clouds is the activation process, where a fraction of the aerosol contained within an ascending cloud parcel experiences unconstrained growth and activates to form cloud droplets. State of the art cloud droplet parameterizations can accurately and rapidly calculate the droplet number (Nd) and maximum supersaturation (Smax) that would form in a cloud given knowledge of the aerosol distribution, composition and updraft velocity. Using the aerosol and hygroscopicity, we calculate the droplet number and supersaturation for clouds that would form in the airmasses sampled onboard for characteristic cloud formation conditions (updraft velocity). For these calculations we use the droplet parameterizations based on the "population splitting concept as presented by Morales and Nenes (2014), which gives highly accurate results. In the calculations of droplet number, the size distribution is represented by the sectional approach, derived directly from the SMPS distribution files. Cloud formation conditions are characterized by assuming a distribution of vertical velocities with spectral dispersion of σw = 0.3 m s-1 to obtain velocity-averaged values of CDNC and Smax. As a sensitivity test, we also consider calculations for a convective boundary layer (σw = 0.6 ms-1).
The calculation of droplet number for all the data in the flights then allows one to directly quantify the sensitivity of clouds to the aerosol parameters (size distribution and chemical constituents, including the inorganic and organic factors). A characteristic results is shown in Figure 6, which shows data for SENEX Flight 6, which sampled the Atlanta plume (left panel). Although the aerosol and CCN data displayed considerable variability in the boundary layer (Figure 6, left panel and right panel inset) droplet number that would form in clouds in the boundary layer displays considerable insensitivity to aerosol fluctuations (note dotted area in Figure 6, right panel). This is because there is such fierce competition for water vapor (denoted by the very low levels of S max, which are below 0.1%) clouds cannot respond to the added CCN, and become insensitive to aerosol fluctuations. Only when the aerosol ventilates to the free troposphere and concentrations drop - can aerosol fluctuations influence in-cloud droplet number (Figure 6, left panel). This is a remarkable dataset that can help, for the first time, quantify cloud susceptibility to aerosol using field data alone.
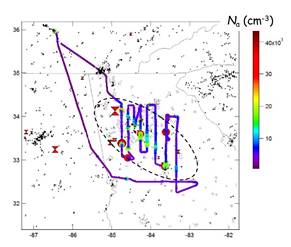
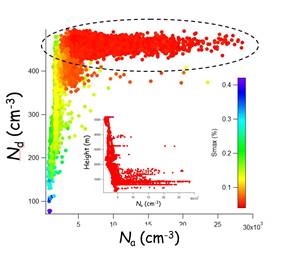
Figure 6: (left panel) Flight path of SENEX Flight 6, that sampled the Atlanta plume. Data points are colored by the total aerosol concentration (N a) sampled. (right panel) Droplet number (N d) predicted for clouds that would form in the airmasses sampled. The relationship between N a and altitude is indicated in the inset graph. Note that as aerosol number exceeds 2,500 cm-3 (which is situation throughout the boundary layer) N d is essentially insensitive to N a variations. Only when the supersaturation increases above 0.1% do clouds begin responding to aerosol variations. Results from Bougiatioti et al., in preparation.
SOAS data and analysis: the contribution of each organic factor to hygroscopicity
During the SOAS campaign, at the Centerville, AL site, our group also contributed a suite of instruments including a CCN counter, a thermodenuder (TD), size distributions; combined with high resolution time-of-flight aerosol mass spectrometer (AMS) the instrumentation was used to measure CCN activity, aerosol volatility, composition and oxidation state. Particles were either sampled directly from ambient or through a Particle Into Liquid Sampler (PILS) allowing the investigation of the water-soluble aerosol component.
Analysis of the data sampled showed that ambient aerosol exhibited size-dependent composition with larger particles being more hygroscopic. The hygroscopicity of thermally denuded aerosol was similar between ambient and PILS-generated aerosol and showed limited dependence on volatilization (not shown). PMF analysis for the aerosol showed that the most hygroscopic components are both the most and the least volatile features of the aerosol, with the least volatile component appearing to be the most oxidized, as expected (Figure 7). Of all the factors sampled, the isoprene factor and its hygroscopicity are robust values that can be used in any model that considers the water uptake properties of the factors.
Understanding the factors associated with each organic fraction and their corresponding hygroscopicities allows for an attribution of hygroscopicity for the organic species in the SE US. From the mass fraction of each AMS-derived organic factor (Figure 8, left panel) and the hygroscopicity of each factor (Figure 7) we can then quantify the contribution of each factor to the water uptake properties of the aerosol (Figure 8, right panel). We find that isoprene SOA contributes about 25% of the water uptake associated with organic aerosol, with the other factors (More Oxidized OOA: 40-50%; Less Oxidized OOA: 5-30%) contributing the remaining hygroscopicity.
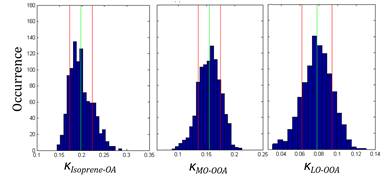
Figure 7. κorg found for each organic PMF factor through linear regression versus O:C for non-denuded PILS aerosol at s=0.40% (left panel), where error bars represent the standard deviation. The probability distributions of the hygroscopicity of each factor, obtained by bootstrap analysis results of the linear regression are shown on the right, where the green and red lines represent the average and one standard deviation in each factor κorg , respectively. Data from Cerully et al. (2015).
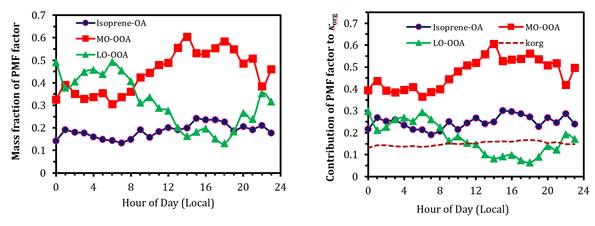
Figure 8. Diurnal profiles for each organic PMF factor obtained from analysis of AMS spectra (left panel). Using the hygroscopicity of each factor (Figure 7) we can then quantify the contribution of each factor to the water uptake properties of the aerosol (right panel). Results from Cerully et al. (2015).
References:
Bougiatioti et al., Cloud condensation nuclei, droplet formation and cloud susceptibility to aerosol in the SE US, in preparation forAtmos.Chem.Phys.
Cerully, K., Bougiatioti, A., Guo, H., Xu, L., Hite, J.R., Ng, N.L., Weber, R., Nenes, A. (2015) On The Link Between Hygroscopicity, Volatility, And Oxidation State Of Ambient and Water-Soluble Aerosol In The Southeastern United States,Atmos.Chem.Phys.,15, 8679-8694
Lin, J.J., Raatikainen, T., Purdue, S., and Nenes, A., Scanning Flow CCN Analysis: Effects of Flow Waveform and Operation Characteristics, in preparation forAerosol Sci.Tech.
Moore, R.H. and Nenes, A. (2009) Scanning Flow CCN Analysis - A Method for Fast Measurements of CCN Spectra,Aer.Sci.Tech., 43, 1192-1207
Morales Betancourt, R., and Nenes, A. (2014) Understanding the contributions of aerosol properties and parameterization discrepancies to droplet number variability in a Global Climate Model,Atmos.Chem.Phys., 14, 4793-4807
Journal Articles on this Report : 8 Displayed | Download in RIS Format
| Other project views: | All 19 publications | 19 publications in selected types | All 19 journal articles |
|---|
| Type | Citation | ||
|---|---|---|---|
|
|
Budisulistiorini SH, Li X, Bairai ST, Renfro J, Liu Y, Liu YJ, McKinney KA, Martin ST, McNeill VF, Pye HOT, Nenes A, Neff ME, Stone EA, Mueller S, Knote C, Shaw SL, Zhang Z, Gold A, Surratt JD. Examining the effects of anthropogenic emissions on isoprene-derived secondary organic aerosol formation during the 2013 Southern Oxidant and Aerosol Study (SOAS) at the Look Rock, Tennessee ground site. Atmospheric Chemistry and Physics 2015;15(15):8871-8888. |
R835410 (2013) R835410 (2014) R835410 (2015) R835410 (Final) R835401 (2014) R835401 (Final) R835404 (2014) R835404 (2015) R835404 (Final) |
Exit Exit Exit |
|
|
Cerully KM, Hite Jr. JR, McLaughlin M, Nenes A. Toward the determination of joint volatility-hygroscopicity distributions:development and response characterization for single-component aerosol. Aerosol Science and Technology 2014;48(3):296-312. |
R835410 (2013) R835410 (2014) R835410 (2015) R835410 (Final) |
Exit Exit Exit |
|
|
Cerully KM, Bougiatioti A, Hite Jr. JR, Guo H, Xu L, Ng NL, Weber R, Nenes A. On the link between hygroscopicity, volatility, and oxidation state of ambient and water-soluble aerosols in the southeastern United States. Atmospheric Chemistry and Physics 2015;15(15):8679-8694. |
R835410 (2013) R835410 (2014) R835410 (2015) R835410 (Final) |
Exit Exit |
|
|
Guo H, Xu L, Bougiatioti A, Cerully KM, Capps SL, Hite Jr. JR, Carlton AG, Lee S-H, Bergin MH, Ng NL, Nenes A, Weber RJ. Fine-particle water and pH in the southeastern United States. Atmospheric Chemistry and Physics 2015;15(9):5211-5228. |
R835410 (2013) R835410 (2014) R835410 (2015) R835410 (Final) R834799 (2015) R834799 (2016) R834799 (Final) R834799C001 (2015) R834799C001 (Final) R835041 (2015) R835041 (Final) |
Exit Exit Exit |
|
|
Warneke C, Trainer M, de Gouw JA, Parrish DD, Fahey DW, Ravishankara AR, Middlebrook AM, Brock CA, Roberts JM, Brown SS, Neuman JA, Lerner BM, Lack D, Law D, Hubler G, Pollack I, Sjostedt S, Ryerson TB, Gilman JB, Liao J, Holloway J, Peischl J, Nowak JB, Aikin KC, Min K-E, Washenfelder RA, Graus MG, Richardson M, Markovic MZ, Wagner NL, Welti A, Veres PR, Edwards P, Schwarz JP, Gordon T, Dube WP, McKeen SA, Brioude J, Ahmadov R, Bougiatioti A, Lin JJ, Nenes A, Wolfe GM, Hanisco TF, Lee BH, Lopez-Hilfiker FD, Thornton JA, Keutsch FN, Kaiser J, Mao J, Hatch CD. Instrumentation and measurement strategy for the NOAA SENEX aircraft campaign as part of the Southeast Atmosphere Study 2013. Atmospheric Measurement Techniques 2016;9(7):3063-3093. |
R835410 (2013) R835410 (2014) R835410 (2015) R835410 (Final) R835406 (Final) |
Exit Exit |
|
|
Weber RJ, Guo H, Russell AG, Nenes A. High aerosol acidity despite declining atmospheric sulfate concentrations over the past 15 years. Nature Geoscience 2016;9:282-285. |
R835410 (2013) R835410 (2014) R835410 (2015) R835410 (Final) R834799 (2016) R834799 (Final) R834799C001 (Final) |
Exit Exit |
|
|
Xu L, Guo H, Boyd CM, Klein M, Bougiatioti A, Cerully KM, Hite JR, Isaacman-VanWertz G, Kreisberg NM, Knote C, Olson K, Koss A, Goldstein AH, Hering SV, de Gouw JA, Baumann K, Lee S-H, Nenes A, Weber RJ, Ng NL. Effects of anthropogenic emissions on aerosol formation from isoprene and monoterpenes in the southeastern United States. Proceedings of the National Academy of Sciences of the United States of America 2015;112(1):37-42. |
R835410 (2013) R835410 (2014) R835410 (2015) R835410 (Final) R834799 (2015) R834799 (2016) R834799 (Final) R834799C001 (2015) R834799C001 (Final) R835403 (2014) R835403 (2015) R835403 (Final) |
Exit Exit Exit |
|
|
Xu L, Middlebrook AM, Liao J, de Gouw JA, Guo H, Weber RJ, Nenes A, Lopez-Hilfiker FD, Lee BH, Thornton JA, Brock CA, Neuman JA, Nowak JB, Pollack IB, Welti A, Graus M, Warneke C, Ng NL. Enhanced formation of isoprene-derived organic aerosol in sulfur-rich power plant plumes during Southeast Nexus. Journal of Geophysical Research: Atmospheres 2016;121(18):11137-11153. |
R835410 (2013) R835410 (2015) R835410 (Final) R835403 (Final) |
Exit Exit Exit |
Progress and Final Reports:
Original AbstractThe perspectives, information and conclusions conveyed in research project abstracts, progress reports, final reports, journal abstracts and journal publications convey the viewpoints of the principal investigator and may not represent the views and policies of ORD and EPA. Conclusions drawn by the principal investigators have not been reviewed by the Agency.