
Grantee Research Project Results
Final Report: Understanding regional oxidation capacity by comprehensive observations to constrain hydroxyl radical sources and sinks during the Southern Oxidant Aerosol Study (SOAS)
EPA Grant Number: R835400Title: Understanding regional oxidation capacity by comprehensive observations to constrain hydroxyl radical sources and sinks during the Southern Oxidant Aerosol Study (SOAS)
Investigators: Kim, Saewung
Institution: University of California - Irvine
EPA Project Officer: Chung, Serena
Project Period: April 1, 2013 through March 31, 2016
Project Amount: $299,895
RFA: Anthropogenic Influences on Organic Aerosol Formation and Regional Climate Implications (2012) RFA Text | Recipients Lists
Research Category: Early Career Awards , Air Quality and Air Toxics , Air , Climate Change
Objective:
We proposed to constrain oxidation capacity and tropospheric reactivity during the Southern Oxidant Aerosol Study (SOAS) campaign on a ground site in Brent, Alabama, in 2013. SOAS was a comprehensive community field campaign utilizing multiple platforms to investigate from emissions of biogenic volatile organic compounds (BVOCs), their oxidations in various anthropogenic influences and their implications toward secondary oxidation product formation, such as ozone and aerosols. Eventually, the elucidation of these atmospheric processes leads us to a better understanding in regional air quality and climate from short-lived climate forcers.
In tropospheric photochemistry perspective, the oxidation capacity is determined by atmospheric NOX level and tropospheric reactivity determined by amount of trace gases in the atmosphere (Figure 1).
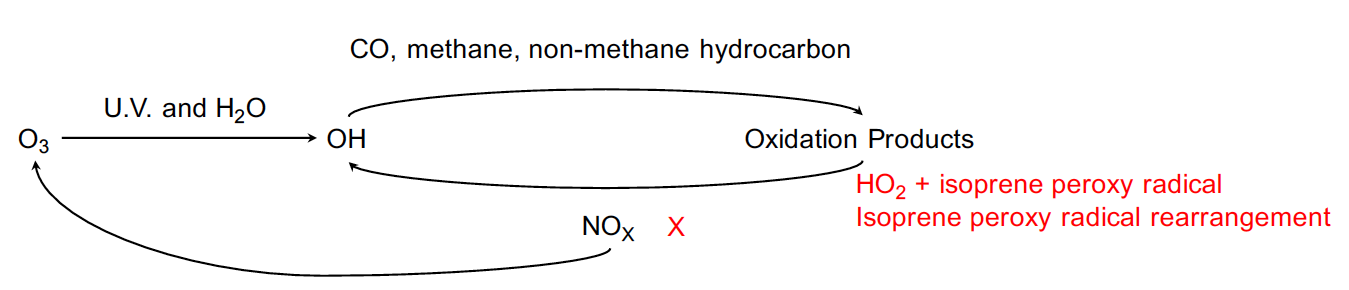
Figure 1. A schematic diagram of tropospheric photochemistry and recently proposed isoprene mediated OH recycling chemical processes.
In the early '80s, when a global chemical transport model was first developed, the photochemistry of BVOCs was not incorporated due to its complexity.2 The study, however, commented about their influence on the OH level, particularly isoprene, as follows: "It is apparent that concentrations of OH could be substantially reduced near strong sources of isoprene and terpenes."
Since the atmospheric chemistry community became capable to quantify tropospheric OH,3 numerous reports have consistently indicated that in high-isoprene and low-to-moderate NO environments, observed OH levels cannot be simply accounted by the conventional photochemistry summarized in Figure 1. Rohrer and colleagues1 presented comprehensive reanalysis of the previously reported observed OH data sets in high-isoprene and low-NO environments. The study argued that tropospheric OH levels that mostly define the tropospheric oxidation capacity are not suppressed in low-NO conditions where isoprene accounts the most dominant OH sink, as shown in Figure 2.
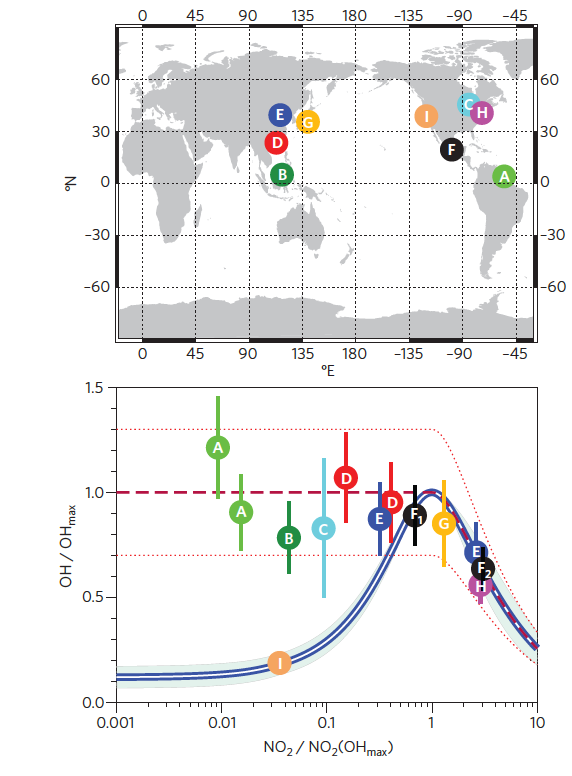
Figure 2. A summary of OH observations in isoprene and low NO environments and correlations between NOx and OH (Rohrer and colleagues1).
The results from SOAS with a comprehensive observational suite intentionally designed for a maximum redundancy certainly provide observational constraints to address the conundrum on oxidation capacity and tropospheric reactivity. The Kim group at the University of California—Irvine (UCI) and collaborators deployed chemical ionization mass spectrometer (CIMS)-based OH and OH reactivity instrumentation. This report presents the methods including quality assurance procedures, results, and discussion.
Summary/Accomplishments (Outputs/Outcomes):
Methods
Field Site
The observations were conducted between June 1 and July 15, 2013, at the Centerville Research Site (CTR) in Brent, Alabama (+32° 54' 11.81", -87° 14' 59.79"). The site is a part of the Southeastern Aerosol Research and Characterization Network. The CTR ground site is surrounded by a mosaic of dense forest, including the Talladega National Forest, and agricultural lands. The surrounding vegetation was composed of grass, crops, brush, kudzu, pines, oaks, and other trees with canopy heights between 9 and 12 meters. The field site is subjected to strong isoprene emissions during the day and influenced by aged pollution plumes from Southern metropolitan cities.
OH Reactivity and OH Measurements Using Chemical Ionization Mass Spectrometer Systems
The UCI OH reactivity system is an online in situ analytical method utilizing the comparative reactivity method (CRM).18 The system is composed of a CIMS system with a low-pressure drift tube ion-neutral reactor system utilizing hydronium ion (H3O+) and a glass reactor equipped with a UV lamp, and it uses a known amount of pyrrole (C4H5N, Air Liquide America Specialty Gases LLC, NIST traceable grade, 5.1 ppm in nitrogen) as a reference gas. OH radicals are generated in the glass reactor by the photolysis of humidified N2 by the UV lamp. By diverting ambient air through a catalytic convertor (Pt-wool heated to 380°C), most trace gases, including volatile organic compounds (VOCs), are removed without changes in water vapor contents in the air sample. CRM uses competitive kinetics in a sequence of multistep cycles to obtain OH reactivity of the ambient air. One-point calibration using a propene standard (NIST traceable, 1 ppm AirLiquide LLC) was routinely conducted (every 2 days) and did not show a sensitivity change over time within the analytical uncertainty. In the laboratory, we conducted the multicomponent (propane, propene and isoprene) calibration over the range of OH reactivity observed in the field environment. The experimental data do not indicate any systematic bias from the different VOC classes. The calibration experimental result is presented in the supplementary material. The inlet (1/4" PFA Teflon tubing) was installed on top of a walk up tower (~ 15 m). Ambient air was pulled through at the rate of 10 liters per minute. The Pennsylvania State University OH reactivity quantification system is well described in elsewhere and deployed multiple times in the ground and airborne field campaigns. The measurement uncertainty (2σ) is 20 percent.
The horizontal error bars in Figure 1 represent 1σ of uncertainty related to calculated OH reactivity. OH reactivity (Rcalc) was calculated using the equation—

The variables V, a, R, and T represent volume, Avogadro's number, and the gas constant, respectively. The variables C and k represent the concentration of the standard gases and their reaction constant with OH, respectively. C was calculated using the mixing ratios between the standard gas and zero air, where—
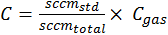
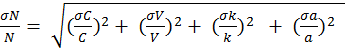
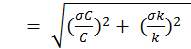
The numerator in Equation 2 represents the flow of the standard in standard cubic centimeters per minute (sccm) and the denominator represents the sum of the standard and zero-air flow. Here, Cgas represents the manufacturers' stated concentrations. The root mean square method was used to propagate the error in Equation 1 and calculate the uncertainty. The errors from flow fluctuations in mass flow controllers were corrected using dry calibrators. These had an error of 1 percent, represented in equation 3 as σC. The variables σsccmza and σsccmx represent the flow fluctuation error of zero air and standard gas, respectively.

The error of C is propagated into Equation 4 to assess the error of C from Equation 2. Cgas represents isoprene, propene or propane, where the uncertainties of the standard gas concentrations are 5 percent, 1 percent and 1 percent, respectively.

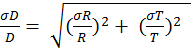
Equation 1 can be simplified to Equation 5, where N and D represent the terms in the numerator and denominator, respectively. The uncertainty in both N and D can then be assessed using Equations 6 and 7. Assuming no error in V and a, Equation 6 simplifies to Equation 6a. The associated with k of isoprene, propene and propane is 21 percent, 8.1 percent and 20 percent, respectively. By multiplying equation 8 by Rcalc the total uncertainty of the calculated OH reactivity can be solved.


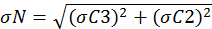
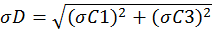
The vertical error bars in Figure 1 represent 1σ of uncertainty related to the observed OH reactivity. The observed OH reactivity was calculated using the equation—
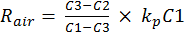
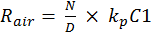
The variables C1, C2 and C3 represent the pyrrole signals from the comparative reactivity method, and kp is the rate constant of pyrrole and OH. The error associated with kp is 12.5 percent. The error in the pyrrole gas concentration is 5 percent and used to propagate the error in the pyrrole signals. Equation 9 can be simplified to Equation 10. Here, N and D represent the terms in the numerator and denominator, respectively. Equations 11 and 12 are used to assess the uncertainty in N and D. By multiplying Equation 13 by Rair, the uncertainty in the observed OH reactivity can be solved.
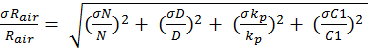
Using the equations above, the uncertainty associated with Rcalc was calculated to be 21 percent, 8.3 percent,and 20 percent for isoprene, propene and propane, respectively. The uncertainty for Rair is 16.7 percent. The lower limit of detection of the OH reactivity system at 3σ over 2 minutes was between 0.24 and 0.30 s-1. This was found by taking the standard deviation of the C2 pyrrole signal, representing the background. Using equation 10, the lower limit of detection could be found at 3σ.
An OH CIMS was integrated on top of the walk-up tower. The CIMS instrumentation was integrated side by side with a LIF system from the Pennsylvania State University equipped with a chemical OH removal background characterization system.19 Mao and colleagues19 described the details of the system, and a separate manuscript is being prepared by the Pennsylvania State University group. The OH CIMS system utilized ambient pressure ionization using NO3- as a reagent ion.20, 21 The technique was first introduced in the mid-'80s 20, 21 and has been mostly used in pristine conditions with low trace loading environments such as in Polar regions.22-25 In the past couple of years, the CIMS OH observations have been made in high BVOC environments.26, 27 The CIMS system deployed for the SOAS campaign has been modified with updated corona discharge ion source from the existing system thoroughly described in previous publications.28 We also adapted the UHP N2 matrix calibration system allowing us to have a multi-point calibration. A detailed system diagram is shown in supplementary material. The overall uncertainty is assessed as 35 percent (2σ) and lower limit of detection is assessed as 2 × 10⁵ molecules cm-3 (2σ) 26, 29 over 1-minute average. Analytical characteristics of other trace gases presented in this manuscript are summarized in Table 1.
Table 1. A summary of analytical techniques for trace gas observations during the SOAS field campaign
|
Observables |
Techniques/Manufacturers |
|
CO |
Thermo Scientific 48i-TLE |
|
NOX |
Thermo Scientific 42i-TL with NO2 photolytic converter |
|
SO2 |
Thermo Scientific 43i-TLE |
|
ozone |
Thermo Scientific 49i |
|
VOCs |
Gas Chromatography-Mass Spectrometer Proton Transfer Reaction-Time of Flight-Mass Spectrometer |
|
ISOPOOH |
Chemical Ionization Mass Spectrometer |
|
CH2O |
Laser Induced Florescence |
|
Ambient temperature and relative humidity |
Vaisala HMT 333 |
Box Model Calculation
The University of Washington Chemical Box-Model (UWCM 2.2, https://sites.google.com/site/wolfegm/models)30 was employed to evaluate contributions of oxygenated VOC (OVOC) to OH reactivity. UWCM is a MATLAB (MathWorks®) based, zero-dimensional model embedded with a HOX-NOx-VOC coupling chemical schemes. The Master Chemical Mechanism (MCM31-34) can be incorporated into UWCM and yields near-explicit VOC oxidation mechanisms. In addition, isoprene photo-oxidation reactions that may account for higher than expected OH can be incorporated in the model. The details of the chemical mechanisms are described by Archibald and colleagues35 and the specific applications using UWCM 2.2 can be found in Kim and colleagues.36 Different model scenarios presented in this study are summarized in Table 2.
Table 2. A summary of box model scenarios presented in this study
|
Scenario I |
MCM 3.2 |
|
Scenario II |
MCM 3.2 + HPALD (Chemistry introduced in Crounse and collegues10) |
|
Scenario III |
MCM 3.3.1 |
|
Scenario IV |
HO2+RO2 recycle (Rohrer and colleagues1) |
|
Scenario V |
HO2+X (Rohrer and colleagues1) |
Model Scenarios I, II and III are embedded isoprene oxidation mechanisms with no substantial OH recycling other than a reaction between NO and peroxy radicals. Model Scenarios IV and V have added substantial OH recycling processes by including a reaction between HO2 and isoprene peroxy radicals and an unknown peroxy radical reducing agent X. Although a series of laboratory studies has failed reproducing these two chemical mechanisms in the controlled environments,37-39 the applications of these scenarios can be justified as some of field observations only can be accounted by these mechanisms.1 We followed the mechanistic treatments for the OH recycling processes as presented in Rohrer and colleagues.1
Results and Discussion
OH and OH Reactivity
Figure 3 presents the averaged diurnal variations of OH reactivity and OH from both the CIMS and LIF analytical systems. The averaged diurnal variations of OH for 10 days from the two different analytical techniques show agreement within the analytical uncertainty (Figure 3a). Therefore, we can eliminate uncertainty coming from model-calculated OH reactivity to constrain the observed OH. Moreover, observed OH can be used as a quantitative evaluation tool for the isoprene photo-oxidation mechanisms. As shown in averaged diurnal variations of trace gases during the field campaign, NO was relatively low (~ 50 ppt; Figure 4) especially towards the afternoon. Therefore, the afternoon data set provides an excellent test bed for highly uncertain OH and isoprene interaction in such conditions.

Figure 3. The diurnal averages of observed (a) OH and (b) OH reactivity from two different analytical suites and calculated OH reactivity during the SOAS campaign.
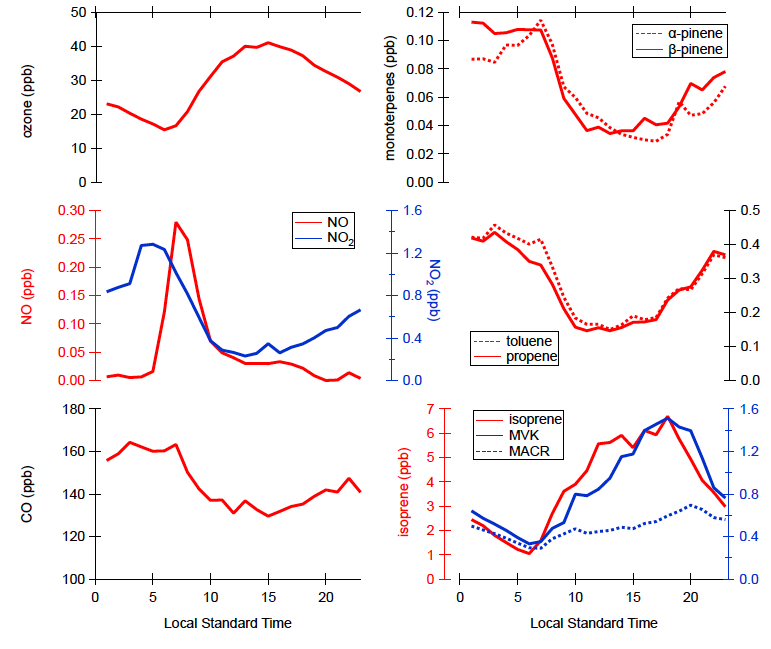
Figure 4. The diurnal averages of some trace gases included in the calculated reactivity assessments shown in Figure 3.
The observed OH reactivity from the LIF and the CIMS systems (Figure 3b) averaged over 18 days of observations also show an agreement within the uncertainty range of the two analytical systems. However, observed OH reactivity using the LIF system is systematically higher than that from the CIMS system, especially toward afternoon. This could be caused by the differences in sampling strategies between the CIMS and the LIF systems as described in the method section: Low-volatility reactive or highly soluble compounds may not be detected by the CIMS OH reactivity analytical system due to the lengthy PFA tubing used for the sample intake. It should be also noted that the gas chromatography-mass spectrometer (GC-MS) system, which produced a data set of most VOCs for calculated OH reactivity assessment also utilized a sample intake from a PFA line extended to the top of the walk-up tower. The diurnal variation of calculated OH reactivity from a comprehensive trace gas data set is also presented in Figure 3b with the diurnal variations of observed total OH reactivity from the CIMS and the LIF systems overlaid. Contributions from the different classes of trace gases are shown by the colored areas.
The diurnal variations of some major trace gases included in the calculated OH reactivity assessments are presented in Figure 4. The specific breakdowns for each chemical species is presented in the supplementary material. The differences between observed and calculated OH reactivity, called missing OH reactivity, is assessed to be 17–50 percent depending upon which observed OH reactivity data set is utilized for the assessments and time of the day as summarized in Table 3.
Table 3. A summary of assessments for missing OH reactivity in two periods of the day from two different OH reactivity observational suites deployed during the SOAS campaign
|
0:00 to 6:00 |
11:00 to 18:00 |
|
|
Observed OHR by CIMS |
17.7 (0.4) |
22.0 (1.0) |
|
Observed OHR by LIF |
17.6 (1.7) |
26.5 (2.9) |
|
Calculated |
8.7 (1.6) |
18.2 (1.8) |
|
Missing OHR |
51% |
17-31 % |
Nevertheless, the assessed missing OH reactivity is significantly lower than previous reports from the similar environments with high isoprene and moderate NO.17, 18 One noticeable finding is that missing OH reactivity is assessed higher during the night than the magnitude of the day. The diurnal variations of major trace gases (Figure 4) shows that the concentrations of monoterpenes, anthropogenic VOCs and CO were higher during the night than during the day, which is similar to the missing OH reactivity diurnal pattern. The monoterpene diurnal pattern can be explained by the combination of the temperature dependency of monoterpene emissions and the evolution of the boundary layer height.40 On the other hand, the diurnal concentration variations of anthropogenic tracers such as benzene, toluene and CO are most likely governed by the boundary layer height evolution considering their relatively long chemical lifetime. Therefore, the discussion could lead us to speculate the unobserved compounds causing missing OH reactivity would be either relatively long lived species or mono, sesquiterpenoids or other unaccounted BVOC species, such as benzenoid stress compounds.41 Indeed, the proton transfer reaction (PTR)-time of flight (ToF)-Mass Spectrometer (MS) data set allows us to infer that low-abundance or unobserved reactive monoterpenoid and sesquiterpenoid species may still explain a fair portion of the missing OH reactivity. In addition, due to a considerable geographical separation from anthropogenic pollution sources from the site, it is less plausible speculating that considerable amount of missing OH reactivity could be accounted by anthropogenic compounds. Kaiser and colleagues presented observationally constrained model calculation results. The model calculated OH reactivity including multigenerational oxidation products of isoprene could explain the missing OH reactivity. There has been a notion that the oxidation products of the well-known VOC precursors such as isoprene are the dominant source for assessed missing OH reactivity rather than unknown/unquantified precursors, which is consistent with the findings utilizing the most comprehensive oxidant and precursors observational data set.
To further examine any systematic bias between the analytical techniques, the magnitude of differences between CIMS and LIF techniques for OH (Figure 5a) and OH (Figure 5b) reactivity as a function of NO, NOX ratio, isoprene and monoterpene. No systematic bias both OH and OH reactivity is noticed as a function of isoprene and monoterpenes, which are the indicators for the photochemistry of the most dominant OH sink and potential unquantified terpenoid species, respectively. However, both the differences in OH and OH reactivity become higher with lower NO concentrations, and the high bias points for OH correlates with lower NOx ratio. In case of OH, the color coding shows the high bias points are associated with low OH mostly in the early morning and the late afternoon. In contrast, the high bias points for OH reactivity found in the low NO level are associated with relatively high OH reactivity data points. In addition, the strong negative bias toward the CIMS-CRM observed OH reactivity can be found in low NO. This analysis again confirms that (1) CIMS and LIF with a chemical removal technique agree on quantifying daytime OH in high NO, and (2) the systematic bias in OH reactivity observations between the CIMS-CRM technique and the LIF technique is probably caused by unconstrained multifunctional oxidation products of isoprene products as their production rates in low NO environments are known to be significantly higher.

Figure 5. Distributions of differences between the CIMS and the LIF observations of (a) OH and (b) OH reactivity are plotted with respect to [NO], [NO/NO2], [isoprene] and [monoterpene]. The blue dashed lines show the different levels that can be accounted by the observational uncertainty.
Evaluations of Isoprene Oxidation Schemes using Observed Oxidation Capacity and Reactivity
First, we evaluate how OH is simulated in the box model system with the different box model scenarios. The model calculation results from different isoprene oxidation chemistry schemes are shown in Figure 6a. Indeed, different isoprene oxidation mechanisms simulated a wide range of OH concentrations. Either Scenario I, II or III, which exhibit low OH regeneration from isoprene oxidation processes, can explain observed OH within the observational uncertainty range around noon, when OH shows its maximum. In the early morning and the late afternoon there is a substantial discrepancy between observed and model simulated OH. This can be interpreted along the similar context with the larger discrepancy we examined between the CIMS and the LIF techniques in Figure 6a. Therefore, follow-up studies are urged. As the other scenarios are known to be consistent with the LIF observational data set without a chemical removal background system, we can conclude that at least in this photochemical environment, the conventional understanding that NO is driving most of OH recycling and is still upheld. As expected, the different isoprene oxidation chemistry schemes also simulate a wide range of OH reactivity coming from oxidation products, mostly isoprene. It is worth noting that the OH levels from different scenarios do not have any correlations with the simulated OH reactivity levels. The results are caused by the differences in treating the chemical fates of isoprene peroxy radicals that eventually produce OVOCs.35 Since we have evaluated isoprene oxidation mechanisms using OH observations, we can constrain uncertainty in OH reactivity estimations from OVOCs using a box model framework. The shaded region in Figure 6b, which represents the analytical uncertainty range of CIMS observed OH reactivity, shows the simulated OH reactivity diurnal variations from Scenarios I, II and III that are capable of simulating observed OH. This box model evaluation utilizing an observational dataset shows a consistent outcome indicating that the NO driven OH recycling process is consistent with observed OH and OH reactivity data set. This finding again confirms the finding that the current isoprene oxidation chemical mechanism has capability to constrain the OH reactivity contributions from isoprene oxidation products reported by Kaiser and colleagues.42

Figure 6. The box model results of OH (the left) and OH reactivity (the right panel) using different model scenarios. the dotted lines with a shade show CIMS observed OH and OH reactivity with analytical uncertainty ranges.
During the SOAS campaign, there was a suite of measurements to quantify VOCs and their oxidation products. Isoprene, the single most dominant OH sink in this environment, was quantified by the GC-MS system and a PTR-ToF-MS using two independent inlets. The comparison over the entire campaign indicates excellent agreement (e.g., within 5%) between the two systems in isoprene quantifications except during precipitation. However, a limited number of published intercomparison demonstrated that there could be a substantial discrepancy in ambient isoprene quantifications. Barket Jr. and colleagues43 presented ambient intercomparison results for isoprene from four different analytical techniques—two GC-MS systems, QIT, and FIS showing the discrepancy in the range of 21 percent to 88 percent. To examine potential impacts of the uncertainty in isoprene quantifications in OH reactivity estimations using a box model, we simulate OH reactivity again using two different isoprene diurnal averages by multiplying the averaged isoprene diurnal variation utilized by a factor of 1.2 and 0.8 for the previous model simulations as a model input. With each isoprene diurnal variation, we simulate a box model for OH reactivity estimations using two different model scenarios (I and IV). Other input parameters are set identical for all four simulations. The four different model simulation outcomes of OH reactivity are shown in Figure 7.
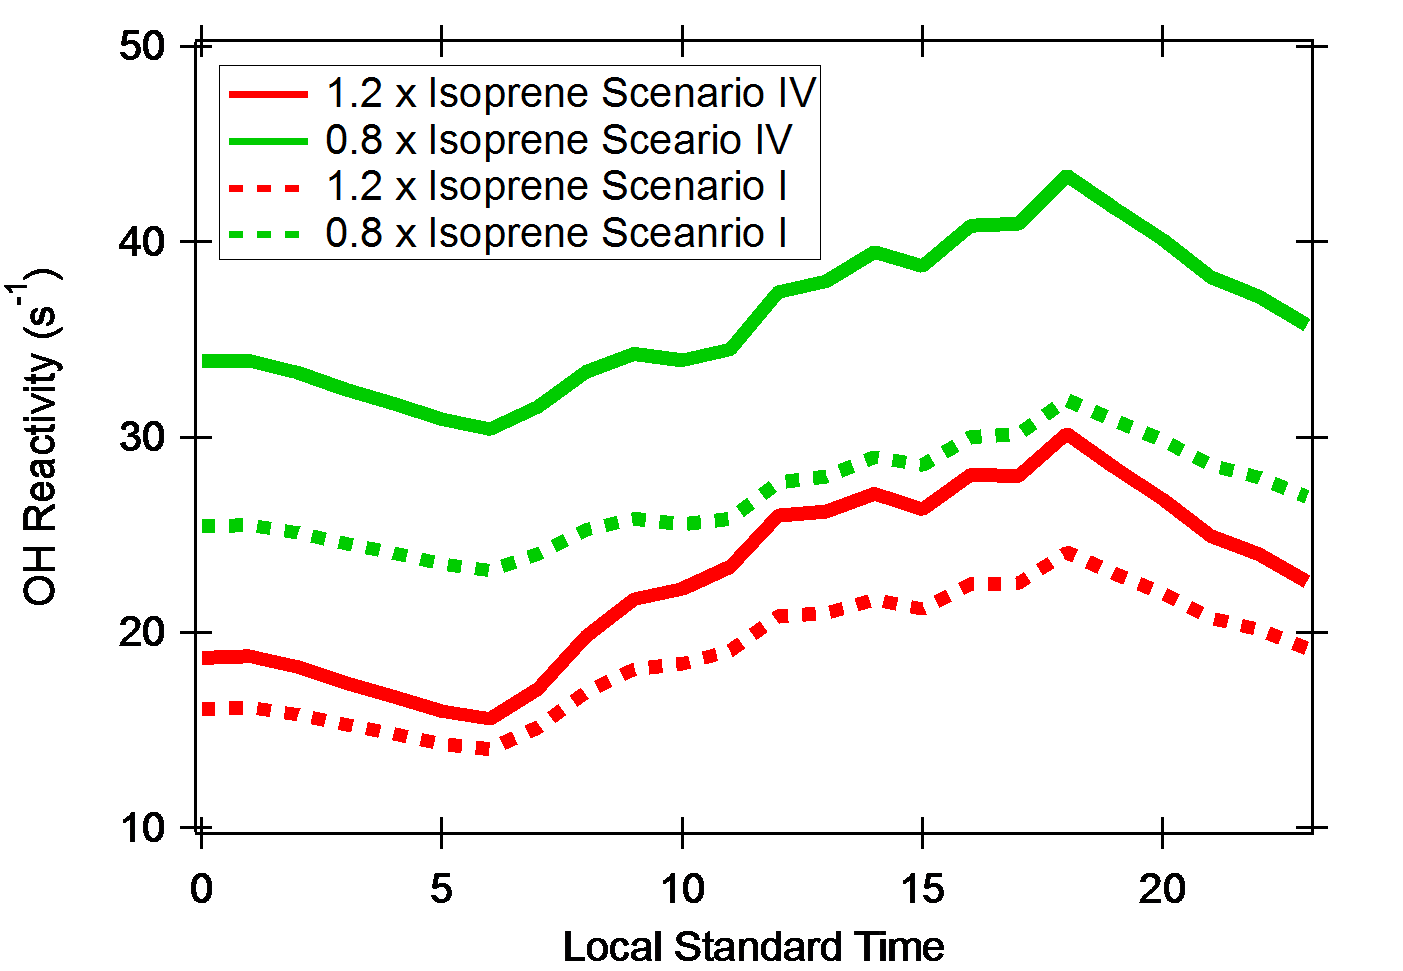
Figure 7. Model simulations results with manipulated isoprene concentrations to evaluate impacts of isoprene analytical uncertainty in OH reactivity assessments with different model scenarios shown in Figure 3 and Table 2.
The two different isoprene diurnal variations result in the discrepancies of 40–50 percent in OH reactivity estimations from isoprene and isoprene oxidation products by applying an identical isoprene oxidation scheme. The discrepancies become much larger by comparing the model outcomes with the different isoprene oxidation schemes and isoprene diurnal variations. The estimated OH reactivity could be in the range of 100 percent, as shown in Figure 6. This model exercise clearly suggests that the improvement of observational accuracy of highly reactive compounds such as isoprene should be preceded by a careful experimental procedure as applied during the SOAS campaign to accurately constrain uncertainty in our understanding of tropospheric reactivity and oxidation capacity. In addition, the colocation of samplings and careful temporal averages of different observables are essential for the accurate comparison basis in an environment of strong vertical gradients and temporal variations.44, 45
Conclusions:
In summary, in this study we comprehensively examined oxidation capacity and reactivity in a high-isoprene and moderate-NO environment. As in similar environments, unaccounted OH recycling sources and OH sinks have been observed; a comprehensive data set with multiple instrumentations on OH and OH reactivity along with trace gases provides a unique test bed for evaluating competing isoprene oxidation mechanisms proposed to reconcile higher-than-expected OH concentrations. Observationally constrained box model simulations indicate that it does not require a significant additional OH recycling to account for both observed OH and OH reactivity, which are direct quantitative parameters for oxidation capacity and atmospheric reactivity, respectively. This finding is contrary to a hypothesis that isoprene oxidation in the low-NO regime may maintain "maximum efficiency" in OH recycling presented in Rohrer and colleagues.1 Follow-up studies deploying the comprehensive observational suite to constrain oxidation capacity and atmospheric reactivity will facilitate further discussion on the controversy.
Although the funding cycle has ended, the rich data set from the SOAS field campaign has not been fully analyzed yet. The Kim group will keep investigating the dataset in conjunction with ongoing research activities in different photochemical environments. We are actively participating and conducting similar observations in Amazonia, Brazil, and a suburban forest near Seoul Metropolitan Area, South Korea. Therefore, the data sets will provide a comprehensive spectrum of anthropogenic influences impacting BVOC photochemistry.
References:
1. Rohrer F, Lu KD, Hofzumahaus A, Bohn B, Brauers T, Chang CC, Fuchs H, Haseler R, Holland F, Hu M, Kita K, Kondo Y, Li X, Lou SR, Oebel A, Shao M, Zeng LM, Zhu T, Zhang YH, Wahner A. Maximum efficiency in the hydroxyl-radical-based self-cleansing of the troposphere. Nature Geoscience 2014;7 (8):559-563.
2. Logan JA, Prather MJ, Wofsy SC, Mcelroy MB. Tropospheric chemistry - a global perspective. Journal of Geophysical Research-Oceans and Atmospheres 1981;86(Nc8):7210-7254.
3. Heard DE, Pilling MJ. Measurement of OH and HO2 in the troposphere. Chemical Reviews 2003;103(12):5163-5198.
4. Kim SW, Heckel A, McKeen SA, Frost GJ, Hsie EY, Trainer MK, Richter A, Burrows JP, Peckham SE, Grell GA. Satellite-observed US power plant NOx emission reductions and their impact on air quality. Geophysical Research Letters 2006;33(22).
5. Lelieveld J, Butler TM, Crowley JN, Dillon TJ, Fischer H, Ganzeveld L, Harder H, Lawrence MG, Martinez M, Taraborrelli D, Williams J. Atmospheric oxidation capacity sustained by a tropical forest. Nature 2008;452(7188):737-740.
6. Nguyen TL, Vereecken L, Peeters J. HOx Regeneration in the oxidation of isoprene III: theoretical study of the key isomerisation of the z-delta-hydroxy-peroxy isoprene radicals. Chemphyschem 2010;11(18):3996-4001.
7. Peeters J, Muller JF. HOx radical regeneration in isoprene oxidation via peroxy radical isomerisations. II: experimental evidence and global impact. Physical Chemistry Chemical Physics 2010;12(42):14227-14235.
8. Peeters J, Muller JF, Stavrakou T, Nguyen VS. Hydroxyl radical recycling in isoprene oxidation driven by hydrogen bonding and hydrogen tunneling: the upgraded LIM1 mechanism. J Phys Chem A 2014;118(38):8625-8643.
9. Peeters J, Nguyen TL, Vereecken L. HOx radical regeneration in the oxidation of isoprene. Physical Chemistry Chemical Physics 2009;11(28):5935-5939.
10. Crounse JD, Paulot F, Kjaergaard HG, Wennberg PO. Peroxy radical isomerization in the oxidation of isoprene. Physical Chemistry Chemical Physics 2011;13(30):13607-13613.
11. Hofzumahaus, A, Rohrer, F, Lu, K. D, Bohn, B, Brauers, t, chang, c. c, fuchs, h, holland, f, kita, k, kondo, y, li, x, lou, s. r, shao, m, zeng, l. m, wahner, a, zhang, y. h. amplified trace gas removal in the troposphere. Science 2009, 324 (5935), 1702-1704.
12. Di Carlo P, Brune WH, Martinez M, Harder H, Lesher R, Ren XR, Thornberry T, Carroll MA, Young V, Shepson PB, Riemer D, Apel E, Campbell C. Missing OH reactivity in a forest: evidence for unknown reactive biogenic VOCs. Science 2004;304(5671):722-725.
13. Edwards PM, Evans MJ, Furneaux KL, Hopkins J, Ingham T, Jones C, Lee JD, Lewis AC, Moller SJ, Stone D, Whalley LK, Heard DE. OH reactivity in a South East Asian tropical rainforest during the Oxidant and Particle Photochemical Processes (OP3) project. Atmospheric Chemistry and Physics 2013;13(18):9497-9514.
14. Nakashima Y, Kato S, Greenberg J, Harley P, Karl T, Turnipseed A, Apel E, Guenther A, Smith J, Kajii Y. Total OH reactivity measurements in ambient air in a southern Rocky Mountain ponderosa pine forest during BEACHON-SRM08 summer campaign. Atmos Environ 2014;85:1-8.
15. Nolscher AC, Sinha V, Bockisch S, Klupfel T, Williams J. Total OH reactivity measurements using a new fast Gas Chromatographic Photo-Ionization Detector (GC-PID). Atmos Meas Tech 2012;5(12):2981-2992.
16. Yang YD, Shao M, Wang XM, Nolscher AC, Kessel S, Guenther A, Williams J. Towards a quantitative understanding of total OH reactivity: a review. Atmos Environ 2016;134:147-161.
17. Nolscher AC, Yanez-Serrano AM, Wolff S, de Araujo AC, Lavric JV, Kesselmeier, J, Williams J. Unexpected seasonality in quantity and composition of Amazon rainforest air reactivity. Nat Commun 2016;7.
18. Sinha V, Williams J, Crowley JN, Lelieveld J. The comparative reactivity method - a new tool to measure total OH reactivity in ambient air. Atmospheric Chemistry and Physics 2008;8(8):2213-2227.
19. Mao J, Ren X, Zhang L, Van Duin DM, Cohen RC, Park JH, Goldstein AH, Paulot F, Beaver MR, Crounse JD, Wennberg PO, DiGangi JP, Henry SB, Keutsch FN, Park C, Schade GW, Wolfe GM, Thornton JA, Brune WH. Insights into hydroxyl measurements and atmospheric oxidation in a California forest. Atmospheric Chemistry and Physics 2012;12(17):8009-8020.
20. Tanner DJ, Eisele FL. Present OH measurement limits and associated uncertainties. Journal of Geophysical Research 1995;100(D2):2883-2892.
21. Tanner DJ, Jefferson A, Eisele FL. Selected ion chemical ionization mass spectrometric measurement of OH. Journal of Geophysical Research 1997;102(D5):6415-6425.
22. Eisele FL, Tanner DJ, Cantrell CA, Calvert JG. Measurements and steady state calculations of OH concentrations at Mauna Loa observatory. Journal of Geophysical Research-Atmospheres 1996;101(D9):14665-14679.
23. Mauldin L, Kosciuch E, Eisele FL, Huey G, Tanner DJ, Sjostedt S, Blake D, Chen C, Crawford J, Davis D. South Pole Antarctica observations and modeling results: new insights oh HOx radical and sulfur chemistry. Atmos Environ 2010;44:572-581.
24. Sjostedt SJ, Huey LG, Tanner DJ, Peischl J, Chen G, Dibb JE, Lefer B, Hutterli MA, Beyersdorf AJ, Blake NJ, Blake DR, Sueper D, Ryerson T, Burkhart J, Stohl A. Observations of hydroxyl and the sum of peroxy radicals at Summit, Greenland during summer 2003. Atmos Environ 2007;41(24):5122-5137.
25. Liao J, Huey LG, Tanner DJ, Brough N, Brooks S, Dibb JE, Stutz J, Thomas JL, Lefer B, Haman C, Gorham K. Observations of hydroxyl and peroxy radicals and the impact of BrO at Summit, Greenland in 2007 and 2008. Atmospheric Chemistry and Physics 2011;11(16):8577-8591.
26. Kim S, Wolfe GM, Mauldin L, Cantrell C, Guenther A, Karl T, Turnipseed A, Greenberg J, Hall SR, Ullmann K, Apel E, Hornbrook R, Kajii Y, Nakashima Y, Keutsch FN, DiGangi JP, Henry SB, Kaser L, Schnitzhofer R, Graus M, Hansel A, Zheng W, Flocke FF. Evaluation of HOx sources and cycling using measurement-constrained model calculations in a 2-methyl-3-butene-2-ol (MBO) and monoterpene (MT) dominated ecosystem. Atmospheric Chemistry and Physics 2013;13(4):2031-2044.
27. Petaja T, Mauldin RL, Kosciuch E, McGrath J, Nieminen T, Paasonen P, Boy M, Adamov A, Kotiaho T, Kulmala M. Sulfuric acid and OH concentrations in a boreal forest site. Atmospheric Chemistry and Physics 2012;9(19):7435-7448.
28. Kurten A, Rondo L, Ehrhart S, Curtius J. Performance of a corona ion source for measurement of sulfuric acid by chemical ionization mass spectrometry. Atmos Meas Tech 2011;4(3):437-443.
29. Kim S, Guenther A, Lefer B, Flynn J, Griffin R, Rutter AP, Gong L, Cevik BK. The potential role of stabilized Criegee radicals in sulfuric acid production in a high biogenic VOC environment. Environmental Science & Technology 2015 (Submitted).
30. Wolfe GM, Thornton JA. The chemistry of atmosphere-forest exchange (CAFE) model - PART1: Model description and characterization. Atmospheric Chemistry and Physics 2011;11:77-101.
31. Jenkin ME, Saunders SM, Wagner V, Pilling MJ. Protocol for the development of the Master Chemical Mechanism, MCM v3 (Part B): tropospheric degradation of aromatic volatile organic compounds. Atmospheric Chemistry and Physics 2003;3:181-193.
32. Saunders SM, Jenkin ME, Derwent RG, Pilling MJ. World Wide Web site of a Master Chemical Mechanism (MCM) for use in tropospheric chemistry models. Atmos Environ 1997;31(8):1249-1249.
33. Saunders SM, Jenkin ME, Derwent RG, Pilling MJ. Protocol for the development of the Master Chemical Mechanism, MCM v3 (Part A): tropospheric degradation of non-aromatic volatile organic compounds. Atmospheric Chemistry and Physics 2003;3:161-180.
34. Jenkin ME, Young JC, Rickard AR. The MCM v3.3.1 degradation scheme for isoprene. Atmos Chem Phys 2015;15(20):11433-11459.
35. Archibald AT, Cooke MC, Utembe SR, Shallcross DE, Derwent RG, Jenkin ME. Impacts of mechanistic changes on HOx formation and recycling in the oxidation of isoprene. Atmospheric Chemistry and Physics 2010;10(17):8097-8118.
36. Kim S, Kim SY, Lee M, Shim H, Wolfe GM, Guenther AB, He A, Hong Y, Han J. Impact of isoprene and HONO chemistry on ozone and OVOC formation in a semirural South Korean forest. Atmospheric Chemistry and Physics 2015;15(8):4357-4371.
37. St Clair JM, Rivera-Rios JC, Crounse JD, Knap HC, Bates KH, Teng AP, Jorgensen S, Kjaergaard HG, Keutsch FN, Wennberg PO. Kinetics and Products of the Reaction of the First-Generation Isoprene Hydroxy Hydroperoxide (ISOPOOH) with OH. J Phys Chem A 2016;120(9):1441-1451.
38. Dillon TJ, Crowley JN. Direct detection of OH formation in the reactions of HO(2) with CH(3)C(O)O(2) and other substituted peroxy radicals. Atmospheric Chemistry and Physics 2008;8(16):4877-4889.
39. Fuchs H, Hofzumahaus A, Rohrer F, Bohn B, Brauers T, Dorn HP, Haseler R, Holland F, Kaminski M, Li X, Lu K, Nehr S, Tillmann R, Wegener R, Wahner A. Experimental evidence for efficient hydroxyl radical regeneration in isoprene oxidation. Nature Geoscience 2013;6(12):1023-1026.
40. Kim S, Karl T, Guenther A, Tyndall G, Orlando J, Harley P, Rasmussen R, Apel E. Emissions and ambient distributions of Biogenic Volatile Organic Compounds (BVOC) in a ponderosa pine ecosystem: interpretation of PTR-MS mass spectra. Atmospheric Chemistry and Physics 2010;10(4):1759-1771.
41. Misztal PK, Hewitt CN, Wildt J, Blande JD, Eller A. SD, Fares S, Gentner DR, Gilman JB, Graus M, Greenberg J, Guenther AB, Hansel A, Harley P, Huang M, Jardine K, Karl T, Kaser L, Keutsch FN, Kiendler-Scharr A, Kleist E, Lerner BM, Li T, Mak J, Nolscher AC, Schnitzhofer R, Sinha V, Thornton B, Warneke C, Wegener F, Werner C, Williams J, Worton DR, Yassaa N, Goldstein AH. Atmospheric benzenoid emissions from plants rival those from fossil fuels. Sci Rep-Uk 2015;5.
42. Kaiser J, Skog KM, Baumann K, Bertman S, Brown SB, Brune W, Crounse JD, De Gouw J, Edgerton E, Feiner PA, Goldstein AH, Koss A, Misztal PK, Nguyen TB, Olson KF, St. Clair JM, Teng AP, Toma S, Wennberg PO, Wildt J, Zhang L, Keutsch F. Speciation of OH reactivity above the canopy of an isoprene dominated forest. Atmospheric Chemistry and Physics Discussion 2016, doi:10.5194/acp-2015-1006.
43. Barket DJ, Hurst JM, Couch TL, Colorado A, Shepson PB, Riemer DD, Hills AJ, Apel EC, Hafer R, Lamb BK, Westberg HH, Farmer CT, Stabenau ER, Zika RG. Intercomparison of automated methodologies for determination of ambient isoprene during the PROPHET 1998 summer campaign. Journal of Geophysical Research-Atmospheres 2001;106(D20):24301-24313.
44. Bryan AM, Cheng SJ, Ashworth K, Guenther AB, Hardiman BS, Bohrer G, Steiner AL. Forest-atmosphere BVOC exchange in diverse and structurally complex canopies: 1-D modeling of a mid-successional forest in northern Michigan. Atmos Environ 2015;120:217-226.
45. Kim S, Karl T, Helmig D, Daly R, Rasmussen R, Guenther A. Measurement of atmospheric sesquiterpenes by proton transfer reaction-mass spectrometry (PTR-MS). Atmos Meas Tech 2009;2(1):99-112.
Journal Articles on this Report : 2 Displayed | Download in RIS Format
| Other project views: | All 6 publications | 2 publications in selected types | All 2 journal articles |
|---|
| Type | Citation | ||
|---|---|---|---|
|
|
Lee BH, Mohr C, Lopez-Hilfiker FD, Lutz A, Hallquist M, Lee L, Romer P, Cohen RC, Iyer S, Kurten T, Hu W, Day DA, Campuzano-Jost P, Jimenez JL, Xu L, Ng NL, Guo H, Weber RJ, Wild RJ, Brown SS, Koss A, de Gouw J, Olson K, Goldstein AH, Seco R, Kim S, McAvey K, Shepson PB, Starn T, Baumann K, Edgerton ES, Liu J, Shilling JE, Miller DO, Brune W, Schobesberger S, D'Ambro EL, Thornton JA. Highly functionalized organic nitrates in the southeast United States:contribution to secondary organic aerosol and reactive nitrogen budgets. Proceedings of the National Academy of Sciences of the United States of America 2016;113(6):1516-1521. |
R835400 (2014) R835400 (Final) R835403 (2015) R835403 (Final) R835407 (Final) R835410 (2013) |
Exit Exit Exit |
|
|
Sanchez D, Jeong D, Seco R, Wrangham I, Park J-H, Brune WH, Koss A, Gilman J, de Gouw J, Misztal P, Goldstein A, Baumann K, Wennberg PO, Keutsch FN, Guenther A, Kim S. Intercomparison of OH and OH reactivity measurements in a high isoprene and low NO environment during the Southern Oxidant and Aerosol Study (SOAS). Atmospheric Environment 2018;174:227-236. |
R835400 (Final) |
Exit Exit Exit |
Supplemental Keywords:
Ambient air, tropospheric OH, SOA, observation, SoutheastProgress and Final Reports:
Original AbstractThe perspectives, information and conclusions conveyed in research project abstracts, progress reports, final reports, journal abstracts and journal publications convey the viewpoints of the principal investigator and may not represent the views and policies of ORD and EPA. Conclusions drawn by the principal investigators have not been reviewed by the Agency.