
Grantee Research Project Results
2012 Progress Report: Ensuring Safe Drinking Water in Lake Erie: Quantifying Extreme Weather Impacts on Cyanobacteria and Disinfection Byproducts (DPBs)
EPA Grant Number: R835192Title: Ensuring Safe Drinking Water in Lake Erie: Quantifying Extreme Weather Impacts on Cyanobacteria and Disinfection Byproducts (DPBs)
Investigators: Lee, Jiyoung , Shum, C.K. , Liang, Song
Institution: The Ohio State University
EPA Project Officer: Packard, Benjamin H
Project Period: June 1, 2012 through May 31, 2016
Project Period Covered by this Report: June 1, 2012 through May 31,2013
Project Amount: $748,902
RFA: Extreme Event Impacts on Air Quality and Water Quality with a Changing Global Climate (2011) RFA Text | Recipients Lists
Research Category: Air Quality and Air Toxics , Water Quality , Water , Air , Climate Change
Objective:
Our scientific objectives are: (1) the assessment of the link between historic and current extreme weather events and water quality indicators using satellite and field work data, including water color, temperature, turbidity, precipitation, water level, and ice/snow/flood extents; (2) improved understanding of the links between extreme weather events and the source and finished water quality, including cyanobacteria densities, cyanotoxins, disinfection byproducts (DBPs), and nutrient concentrations; and (3) the modeling and prediction of adverse impacts to source and finished water to understand the future impact of climate-change induced extreme weather events on water safety in Lake Erie.
Progress Summary:
We initiated an innovative interdisciplinary approach using historic and current satellite remote sensing and geodetic data, molecular microbiology tools for comprehensive understanding cyanobacterial dynamics and its influence on drinking water quality in Lake Erie region. During the first project year, we performed three main tasks: (1) we quantified parameters associated with extreme weather events using satellite remote sensing (MODIS, AIRS/AMSU/HSB, TRMM, and radar altimetry) data and Numerical Weather (NWP) Prediction reanalysis (e.g., ERA-Interim) models; (2) we determined the cyanobacteria profile using molecular methods, and measure chemical-physical parameters including toxins and DBPs from the water samples two regions at Lake Erie; and (3) we gathered historical environmental time-series data to characterize the patterns of PC and chlorophyll abundance. Since many environmental time-series data are typically noisy, complex and strongly non-stationary, posing methodological challenges for traditional time-series methods, we conducted a novel approach using wavelet analysis for analyzing the historical water color data.
Below are key findings from the three main tasks: (1) laboratory work with collected water samples; (2) analysis of satellite images; and (3) spectral analysis of environmental time-series with wavelets.
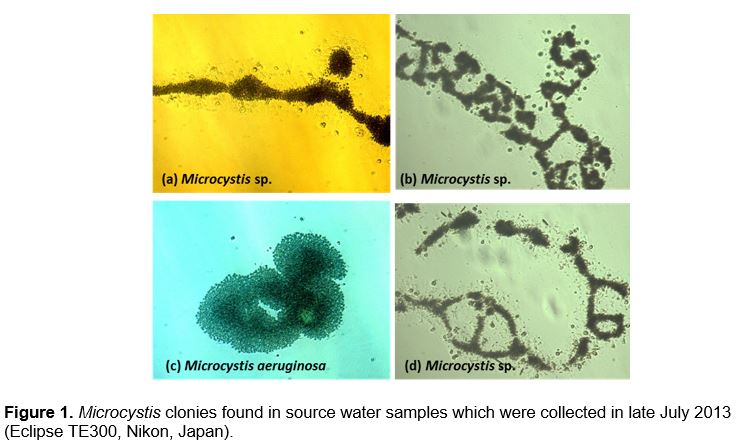
(1) Laboratory work: To date, we received source and drinking water samples from the two water treatment plants (64 sampling events in 2013, and still ongoing) and 11 different physical, chemical and biological parameters (e.g., hardness, nutrient concentrations, heterotrophic plate count, E.coli). These routine parameters help us comprehensively evaluate the source and drinking water quality. From the laboratory experiments with the collected water samples, we have two important findings in this reporting period. First, we observed Microcystis bloom in the source water in late July in 2013 from Toledo samples, and the Microcystis community is composed of diverse organisms (Figure 1). As Microcystis aeruginosa is considered to be one of the main microcystin producers in Lake Erie region, this indicates that drinking water source contains toxin producers during summer season, so additional measures should be taken to remove the potential toxin. Second, disinfection by-products (DBPs) have been detected in the drinking water samples; however, all of them were below the levels defined in the EPA’s Disinfection Byproducts Rule.
Overall, our two major findings from the laboratory work are aligned to our project goal and potentially support our hypothesis-not only harmful algal blooms produce toxins to contaminate source water, but also they can induce the DBPs formation in drinking water processes. This is particularly important for us to comprehensively assess the potential public health risks for ensuring drinking water safety.
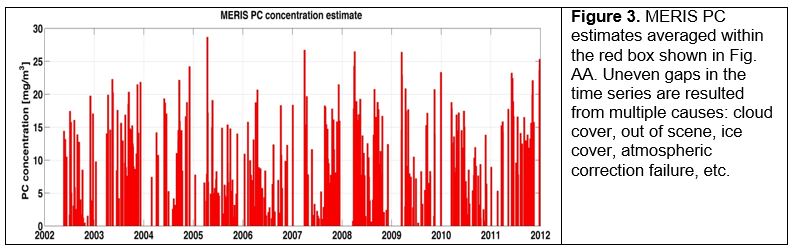
(2) Interannual Variation of MERIS Phycocyanin Concentration Estimates and TRMM Precipitation Data: Historical satellite radiometry images in western Lake Erie have been gathered from European Space Agency (ESA)’s MERIS instrument onboard Environmental Satellite (Envisat). Data span of the long-term time series covers 2002 to 2011 with intermittent data gaps due to the field-of-view (FOV) limitation, cloud cover, and water surface types (i.e., ice cover). Conversion of data from Level 1 top-of-atmosphere (TOA) reflectance to Level 2 water leaving radiance (L_w) has been processed using Basic ERS & Envisat (A) ATSR and MERIS (BEAM) VISAT toolbox provided by the ESA and Brockmann Consult. Detailed information about data collection and computation of phycocyanin (PC) concentration estimates has been summarized in Lee et al. 2013 (submitted). We conducted an analysis of the climate indicator and associated environmental response at western Lake Erie basin near Toledo (red box, Fig. 2). The MERIS-derived PC estimate is a gridded data set at 1200m spatial resolution gathered offshore Toledo and near the outlet of Maumee River.
In addition, TRMM daily-mean precipitation (3B43) data have been gathered within the light-blue box in Figure 2 that approximately confines the watershed of Maumee River, a major hydrologic drainage basin for the western Lake Erie, and the source of HAB.

Both time series of MERIS PC estimates and TRMM rainfall rate at the cropped regions are demonstrated in Figures 3 and 4, respectively. Our hypothesis is that there is a correlation between surface runoff that flushes nutrients into the lake in rainy season, and subsequently it induces an environmental response (i.e., quantitatively comparable amount of harmful algae, in terms of phycocyanin (PC) concentration) in the following summer and fall seasons. A test of correlation in between with a temporal leg enables confirmation of a positive relationship, which can be used in our subsequent modeling work.
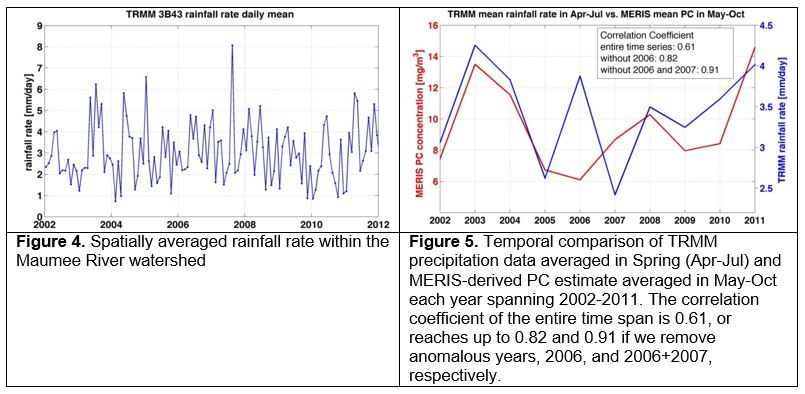
The temporal variation of TRMM rainfall-rate-daily-mean data within the blue box shown in Figure 2 is displayed in Figure 4.
To compare the amount of rainfall within the watershed and a delayed response of PC estimate in a typical peak season, we averaged TRMM time series spanning April-to-July, the main rainy season at this Midwest region each year, and then averaged MERIS samples from May to October. As shown in Fig. 5, although the comparison between two data sets is limited to 10 annual-sampling points, a coincidence in most of data points is observed (Pearson correlation coefficient (r) = 0.61). If we remove a relatively anomalous season in 2006, while a considerable amount of rainfall did not induce a corresponding magnitude of HAB in the same year, the r-value increased to 0.82, which demonstrate an excellent relationship.
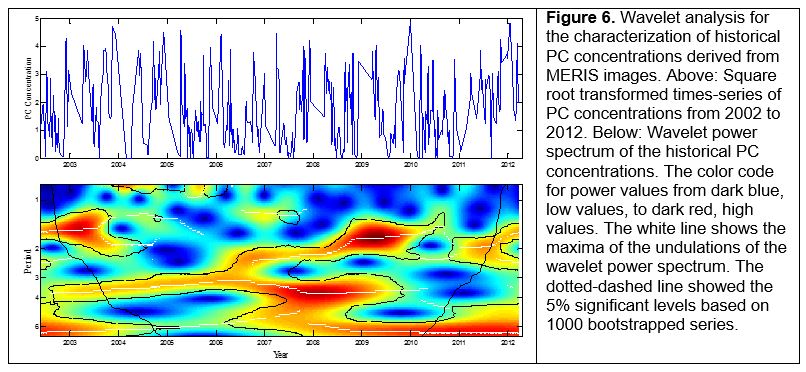
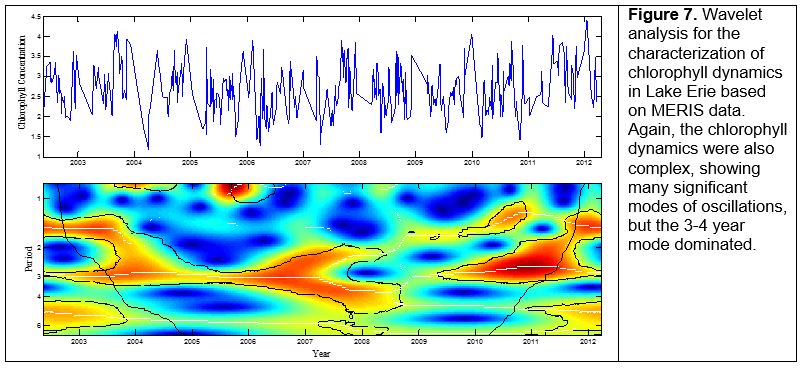
(3) Spectral analysis of historical data with wavelets: We aim to (1) use historical environmental time-series data to characterize the patterns of PC and chlorophyll abundance; (2) explore relationships between PC and chlorophyll, and temperature and precipitation. Many epidemiological and environmental time-series are typically noisy, complex and strongly non-stationary, posing methodological challenges for traditional time-series methods. Wavelet analysis offers a novel way to deal with such data. Below figures show major findings (Figures 6-8). Figure 6 shows the result of wavelet analysis for the characterization of evolving PC concentrations. Clearly the PC dynamics were complex with numerous significant modes of oscillations. The 1.5-year mode dominates in early stage of observations (2003-2004) and then from 1.5-2.5 year mode from late 2006 to 2010. Another significant mode was 3.5-year mode which dominated from approximately from 2003 to almost 2010.
We also explored if the two environmental variables, both derived from MERIS data, were related and when. The wavelet coherence (which quantifies the association between the two time-series) shows significant association for 2002 to 2011 around the 2-year mode and for 2005 and 2009 around the 3-year mode.
Future Activities:
For the subsequent reporting period, we plan to do following activities:
- Receive water samples from the two water treatment plants until the planned ending time.
- Extreact DNA from both source and drinking water samples.
- Quantify total and toxic Microcystis abundance in water samples using StepOne Real-Time PCR system (Applied Biosystems).
- Determine microcystins using HPLC-PAD (Shimadzu LC-20A) and ELISA kit (Abraxis).
- Expand pixelwise analysis to the entire Lake Erie and investigating regional difference of temporal lag between climate factors and associated HAB responses.
- Compile data and statistical analyses.
- Continue data meetings and discussion within the team members.
- Prepare manuscripts and presentations.
Journal Articles:
No journal articles submitted with this report: View all 13 publications for this projectSupplemental Keywords:
Drinking water, global climate change, disinfection byproducts, DPBs, microcystin, limnology, geodesy, environmental microbiology, satellite remote sensing, empirical modeling, harmful algal bloom, Great Lakes, Lake Erie, Ohio, OH, cyanobacteriaProgress and Final Reports:
Original AbstractThe perspectives, information and conclusions conveyed in research project abstracts, progress reports, final reports, journal abstracts and journal publications convey the viewpoints of the principal investigator and may not represent the views and policies of ORD and EPA. Conclusions drawn by the principal investigators have not been reviewed by the Agency.