
Grantee Research Project Results
2015 Progress Report: Exposure Mapping – Characterization of Gases and Particles for ExposureAssessment in Health Effects and Laboratory Studies
EPA Grant Number: R834796C001Subproject: this is subproject number 001 , established and managed by the Center Director under grant R834796
(EPA does not fund or establish subprojects; EPA awards and manages the overall grant for this center).
Center: University of Washington Center for Clean Air Research
Center Director: Vedal, Sverre
Title: Exposure Mapping – Characterization of Gases and Particles for ExposureAssessment in Health Effects and Laboratory Studies
Investigators: Yost, Michael , Larson, Timothy V. , VanReken, Timothy M. , Simpson, Chris , Jobson, B. Thomas
Current Investigators: Yost, Michael , VanReken, Timothy M. , Jobson, B. Thomas , Larson, Timothy V. , Simpson, Chris
Institution: University of Washington , Washington University
EPA Project Officer: Callan, Richard
Project Period: December 1, 2010 through November 30, 2015 (Extended to November 30, 2017)
Project Period Covered by this Report: August 1, 2014 through July 31,2015
RFA: Clean Air Research Centers (2009) RFA Text | Recipients Lists
Research Category: Air Quality and Air Toxics , Air
Objective:
Roadway-source air pollutants encompass a diversity of chemicals, including both particulate and gas-phase components, which are transformed by chemical and physical reactions as they age in the environment. Consequently, human exposures to air pollutants can range from relatively unaged to highly aged components that vary with respect to particle size and the chemical composition of particle and gas-phase components. To obtain a more comprehensive understanding of the seasonal and spatial variability in the concentration and composition of air pollutant exposures within Multi-Ethnic Study of Atherosclerosis and Air Pollution (MESA Air) cities, we employ mobile and fixed-site monitoring to assess both gas and particle components of these pollutants as they age from roadway sources to population areas.
The main project objectives are:
- Characterize spatial and temporal gradients of selected air pollutants along roadways and within neighborhoods in MESA Air cities using a mobile platform.
- Measure spatial variation in concentrations of selected air pollutants at 2‑week average stationary sites in coordination with the mobile measurements.
- Characterize aging of air pollutant components as they are transported from roadway sources to neighborhood receptor locations.
- Provide detailed characterization of laboratory exposure conditions available for toxicology testing, and identify likely conditions that mimic those found in urban settings.
Progress Summary:
Data collection related to Aims 1 and 2 has been completed and provided the main focus of activities up to the beginning of this project. Field sampling in four cities in the MESA Air cohort was completed: Minneapolis/St. Paul, MN; Baltimore, MD; Los Angeles, CA; and Winston-Salem, NC. Mobile monitoring and passive sampling measurements were conducted for both heating and nonheating seasons. Due to financial constraints, Winston-Salem only was monitored with passive samplers. During this reporting period, we have focused on data analysis of final QC data sets and providing data for use by investigators in our Project and other Center investigators. This process has been completed for data collected in Baltimore; Los Angeles; Albuquerque, NM; and the 2-week passive sample data for these cities. We also completed a collaborative measurement campaign in Atlanta, GA, with the Southeastern Center for Air Pollution and Epidemiology (SCAPE Center) and have provided preliminary data for this activity. The final QC data set from this collaborative campaign is under review and being analyzed by both Centers.
The instrument platform for mobile monitoring was assembled and tested in Seattle, WA, in October 2011. During each 2-week sampling period, the mobile monitoring platform measures concentrations of particles and gases while continuously on the move along a fixed sampling route with position information simultaneously logged by a real time GPS. Data collection includes the following components: optical particle size in 31 size bins from 10 to 0.2 µm, particle mean diameter and particle count from 0.03 to 0.2 µm, total particle count > 0.1 µm, particle light scattering coefficient, particle light absorption (black carbon), NO/NO2, O3, CO, CO2 and total volatile organic compounds (VOCs).
Preplanned driving routes were created for each city, arranged into three sectors with 14 measurement intersection waypoints in each sector for measurement plus a common central reference site. These 43 waypoints were selected in advance based on a set of route criteria developed in consultation with the Biostatistics Core of the Center. The routes were evaluated by the Biostatistics Core for use in the spatial mapping of exposures later in the study. Based on advice from our Advisory Committee, we also developed a more intensive roadway gradient sampling scheme, which modified one of the waypoints. This gradient sampling scheme was pilot tested during our field visit to Albuquerque, and the results are shown in Figure 1 below. Similar gradient samples were collected in all cities where mobile monitoring was conducted. A paper describing this work, titled "Multipollutant mobile platform measurements of air pollutants adjacent to the I-40 corridor in Albuquerque, NM," was published in Atmospheric Environment (Riley 2014).
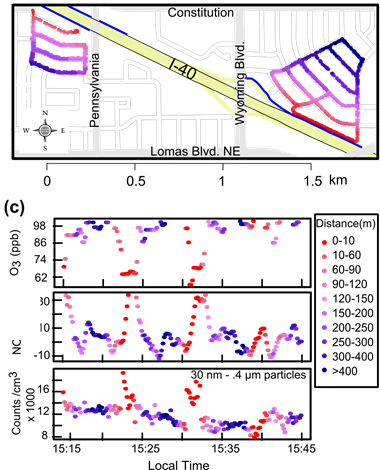 | 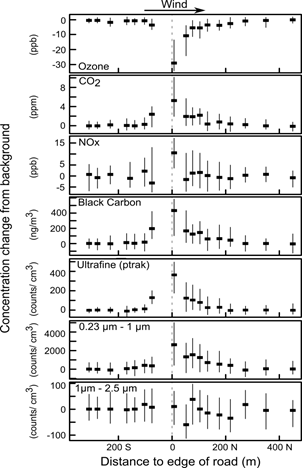 |
Figure 1. Gradient sampling data collected in Albuquerque, NM. Figure 1 shows results from our gradient sampling tests in Albuquerque over a 1‑week period during May 2012. Mobile monitoring was used to repeatedly sample multipollutants near a major interstate roadway (I-40). The 10-second mobile data collected near the interstate was classified into buffers corresponding to different distances from the centerline of the interstate.
Next, AERMOD was used to evaluate the dispersion condition near the roadway during the specific days and time that mobile sampling was done. Two major dispersion conditions were identified: a dominant north-side dispersion pattern with winds coming from the south and a symmetric dispersion condition during more stagnant conditions. Three sampling days corresponded to the dominant north-side pattern (shown in red), and 4 days corresponded to the symmetric pattern (shown in blue). The data shown represent the median and interquartile range (error bars) for buffer distance over the 7-day period classified by the dispersion conditions. The data for black carbon (absorbance) and ozone quite clearly show that the instruments capture the near roadway gradient and also illustrate the effect of dispersion conditions on the shape of the gradient. The mobile sampling also clearly captures the near-road deficit in ozone, which is likely due to NO/NOx scavenging.
Similar patterns in ozone and NO/NOx have been observed in larger scale sampling with both our passive samplers and mobile platform in the other cities. Note that the mobile data only is collected during the evening commute, while the passive badges collect continuously over the 2-week period. Since the mobile platform is often collected during peak traffic and ozone periods, it may more clearly capture these near-roadway effects showing an interaction of the multipollutants. Additional comparisons of the data after final QC were made with reference monitors in Baltimore. Figure 2 shows the results of comparing the 30-second averaged data from the mobile platform to hourly data on the same day recorded at the AQS site for ozone and PM2.5. The mobile data has excellent agreement with the AQS site and captures the day-to-day variation in these pollutants.
Figure 2. Multivariate analysis of the mobile platform data was done using pilot measurements in Seattle. Traditional principal component analysis (PCA) with varimax rotation was examined and the resultant factor scores were compared with a photographic record using an onboard camera. A paper on this analysis is under review in Science of the Total Environment (Fintzi, et. al., 2015).
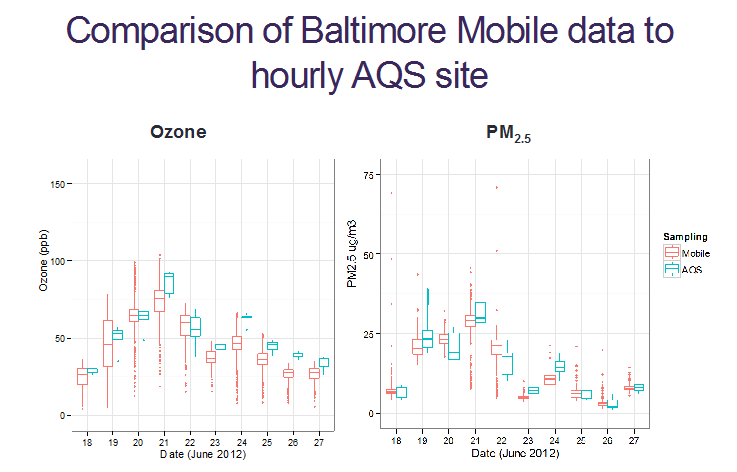
Figure 3. Results of PCA analysis with varimax rotation from Duwamish Pilot Study.
* Factor variable loadings from PCA analysis (see text for variable list)
** Peak events identified from factor scores plotted as a time series
*** Images from onboard video corresponding to peak event for this factor
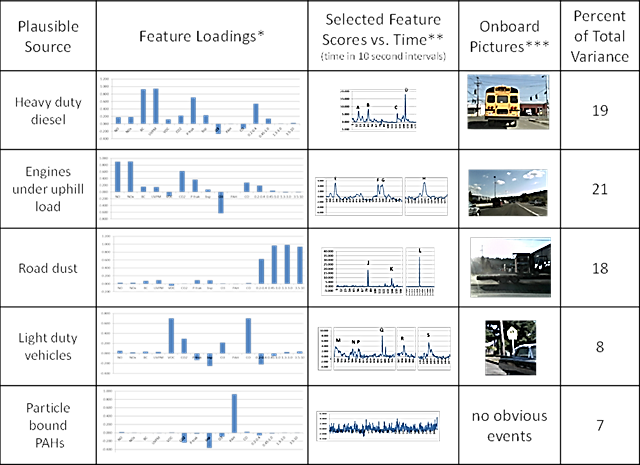
The results shown in Figure 3 indicate that there are strong latent variables that are logically related to specific roadway sources. We are currently examining whether these features are observed in our MESA Air cities data.
In the figure, the second column shows factor loadings from a PCA analysis of 10-second mobile monitoring data collected on one afternoon during the pilot study. The measured variables on the horizontal axis from left to right are NO, NOx, black carbon via aethalometer, UV channel on aethalometer, VOCs, particle number concentration via P-Trak, light scattering coefficient with integrating nephelometer, O3, particle-bound polycyclic aromatic hydrocarbons (PAHs), CO and total particle volume concentration within the following optical particle diameter size ranges: > 0.2–0.4, > 0.4–1.0, > 1.0–3.0, > 3.0–10 micrometers.
The third column shows a time series of the factor score for each factor in the PCA analysis. The labeled peaks correspond to the following events as determined by an onboard camera (events labeled in bold letters correspond to the pictures shown in the fourth column): (A) at red light behind truck; (B) behind truck under freeway; (C) following school bus; (D) at red light behind school bus; (E) truck passing uphill; (F) in uphill traffic; (G and H) roadside next to uphill traffic; (J) sample inlet adjustments (experimental artifact); (K) behind large vehicle; (L) dust plume from off-road truck; (M) next to minivan uphill; (N) idling vehicle; (P) idling pickup truck; (Q) industrial site (no CO observed); (R) residential street; (S) traffic pulse after stop light.
The fourth column of Figure 3 shows pictures taken with onboard camera at time of the peak event identified by the factor score time series. These video images help to clarify the interpretation of the factor loadings in terms of possible on-road sources of multipollutants. Further work is underway to extend this analysis to longer time scales and to integrate additional information collected during the mobile sampling campaigns.
In pursuance of Objective 4, detailed chemical characterization measurements were made of controlled exposure atmospheres at the Lovelace Repository Research Institute (LRRI) in May 2012. Over the course of 3 weeks, nearly 50 distinct exposure atmospheres were sampled. The majority of these test atmospheres were composed of unaged gasoline and diesel exhaust at various loadings and degrees of mixing; a few atmospheres were also sampled where the emissions were photochemically aged prior to sampling. All test atmospheres were sampled by the same instrument platform used for the mobile sampling.
Our Washington State University (WSU) collaborators sampled the test atmospheres with a high-resolution time-of-flight aerosol mass spectrometer (HR-TOF-AMS) and a proton transfer reaction mass spectrometer (PTR-MS). The PTR-MS was coupled with a thermal desorption system for analyzing organic compounds with intermediate volatility (IVOCs). The HR-AMS and PTR-MS provided a much more detailed characterization of the particle- and gas-phase organic composition of the test atmospheres, which will yield improved understanding of the chemical characteristics and phase partitioning behavior of exhaust mixtures. Preliminary results from the experiments at LRRI were presented at the Clean Air Research Center (CLARC) annual meeting, and a manuscript has been recently accepted and another submitted for review on the thermal desorption PTR-MS sampling of engine exhausts and fuels.
Detailed analysis of the aerosol mass spectrometer data has continued. Two types of data from the HR-TOF-AMS have been processed. Unit mass resolution (UMR) data and the more highly resolved high-resolution (HR) data. The UMR data collapses mass spectral signals into their respective unit masses and uses a fragmentation algorithm to allocate signals at a given UMR between organic, nitrate, sulfate, ammonium and chloride species contributions. The fragmentation algorithm is standard practice within the AMS community and has been corrected using filter data to account for nonambient conditions observed in the engine exhaust experiments. HR analysis provides a more robust identification of individual ions and thus a direct quantification of contributions between the five main classifications (organic, nitrate, sulfate, ammonium and chloride).
Figure 4. High-resolution data for a chamber experiment of 100 percent diesel exhaust under typical engine load. Trend of mass loadings over the course of a 2-hour sampling, showing the total organics with respect to the four PAH categories. Where PAH, Methyl-PAH, Nitro-PAH, and Oxy-PAH refer to the particle loading from the summation of ions listed below:
PAH = C10H8 + C12H8 + C12H10 + C13H10 + C14H10 + C16H10 + C18H12 + C20H12 + C22H12 + C22H14
Methyl-PAH = C11H10 + C12H12 + C13H12 + C14H12 + C15H14
Nitro-PAH = C10H7NO2 + C12H9NO2 + C13H9NO2 + C14H9NO2 + C16H9NO2 + C18H11NO2
Oxy-PAH = C13H8O + C13H10O + C15H8O + C14H8O2
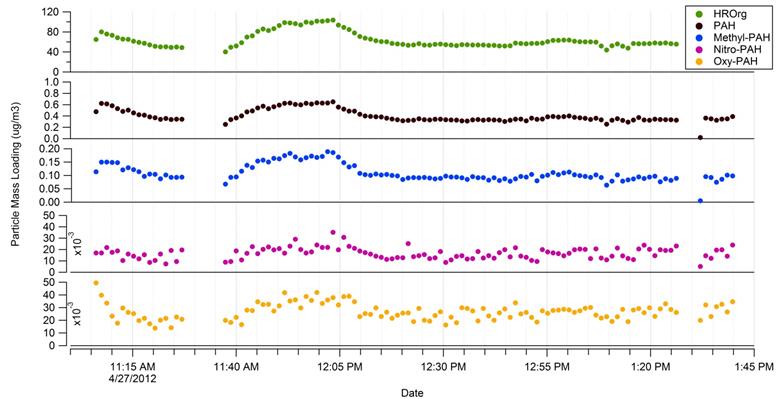
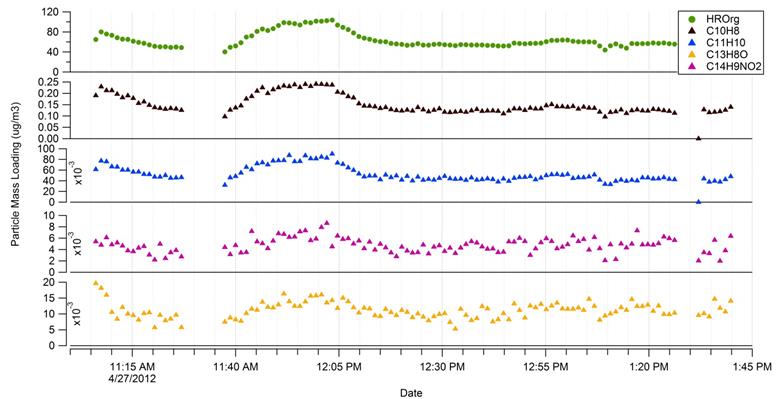
Figure 5. High-resolution data for a chamber experiment of 100 percent diesel exhaust under typical engine load. Trend of mass loadings over the course of a 2-hour sampling, showing the total organics with respect to the four PAH ions. C10H8 = Naphthalene, C11H10 = Methyl-naphthalene, C13H8O = Fluorenone, and C14H9NO2 = Nitro-phenanthrene/Nitro-anthracene
WSU has continued to focus on the composition of the controlled mixtures of diesel and gasoline exhaust generated at the LRRI exposure facility. The test atmospheres have been found to contain strong signals from PAHs, and we have developed a new analytical procedure to examine the contributions of individual PAH compounds to the aerosol under varying test conditions. This procedure, called PAHs by Molecular Ion Proxy (P-MIP), relies on the fact that PAHs are relatively resistant to fragmentation from electron impact ionization, and thus that significant signal remains at the molecular ion. After quantifying the molecular ion signal and taking into account potential interferences, the contributions of the parent PAH to the aerosol may be inferred. Using the dataset from LRRI, we identified and quantified the molecular ions associated with 53 PAH species, including both unsubstituted and functionalized species. For this data set, the observed interferences were typically less than 1.2 percent of the observed signal. This application should have broad applicability, particularly once follow-up work establishing standard HR-AMS spectra for PAH compounds is complete. In the LRRI chamber data, we found that the fractional PAH molecular ion signal remained stable despite dramatic temporal variability of the total particulate organic signal and that the fractional contributions of grouped PAH species and even individual PAH ions were remarkably consistent across experiments. The distribution of PAHs showed no apparent dependence on engine load or exhaust type. Comparison of particle-phase PAH concentrations against gas-phase PAH concentrations for four species suggests a strong enhancement of the particle phase over what is predicted by absorptive partitioning theory. This work is currently in review for publication in Aerosol Science & Technology.
Laboratory work on characterizing the PTR-MS sampling of IVOCs continued. Specifically, tests were done to determine the potential for positive interferences from n-aldehydes present in diesel exhaust on the measurement of naphthalene and alkyl-substituted naphthalenes. This interference has bearing on the interpretation of the gas-particle partitioning analysis using the combined PTR-MS and AMS data sets. Laboratory tests were conducted to establish product ions produced from H3O+ reaction with aldehydes as a function of drift field strength. Laboratory test were conducted to evaluate NO+ as a reagent ion to more effectively distinguish between aldehydes, alkanes and substituted naphthalene compounds. Figure 6 shows the NO+ product ion mass spectrum for selected alkanes, illustrating the low fragmentation and unique M-H product ion
Figure 6. Mass Spectra of three selected n-alkanes using NO+ as the reagent ion. Units are Hz/MHz NO+ and experiments were conducted at 80 Td drift conditions.
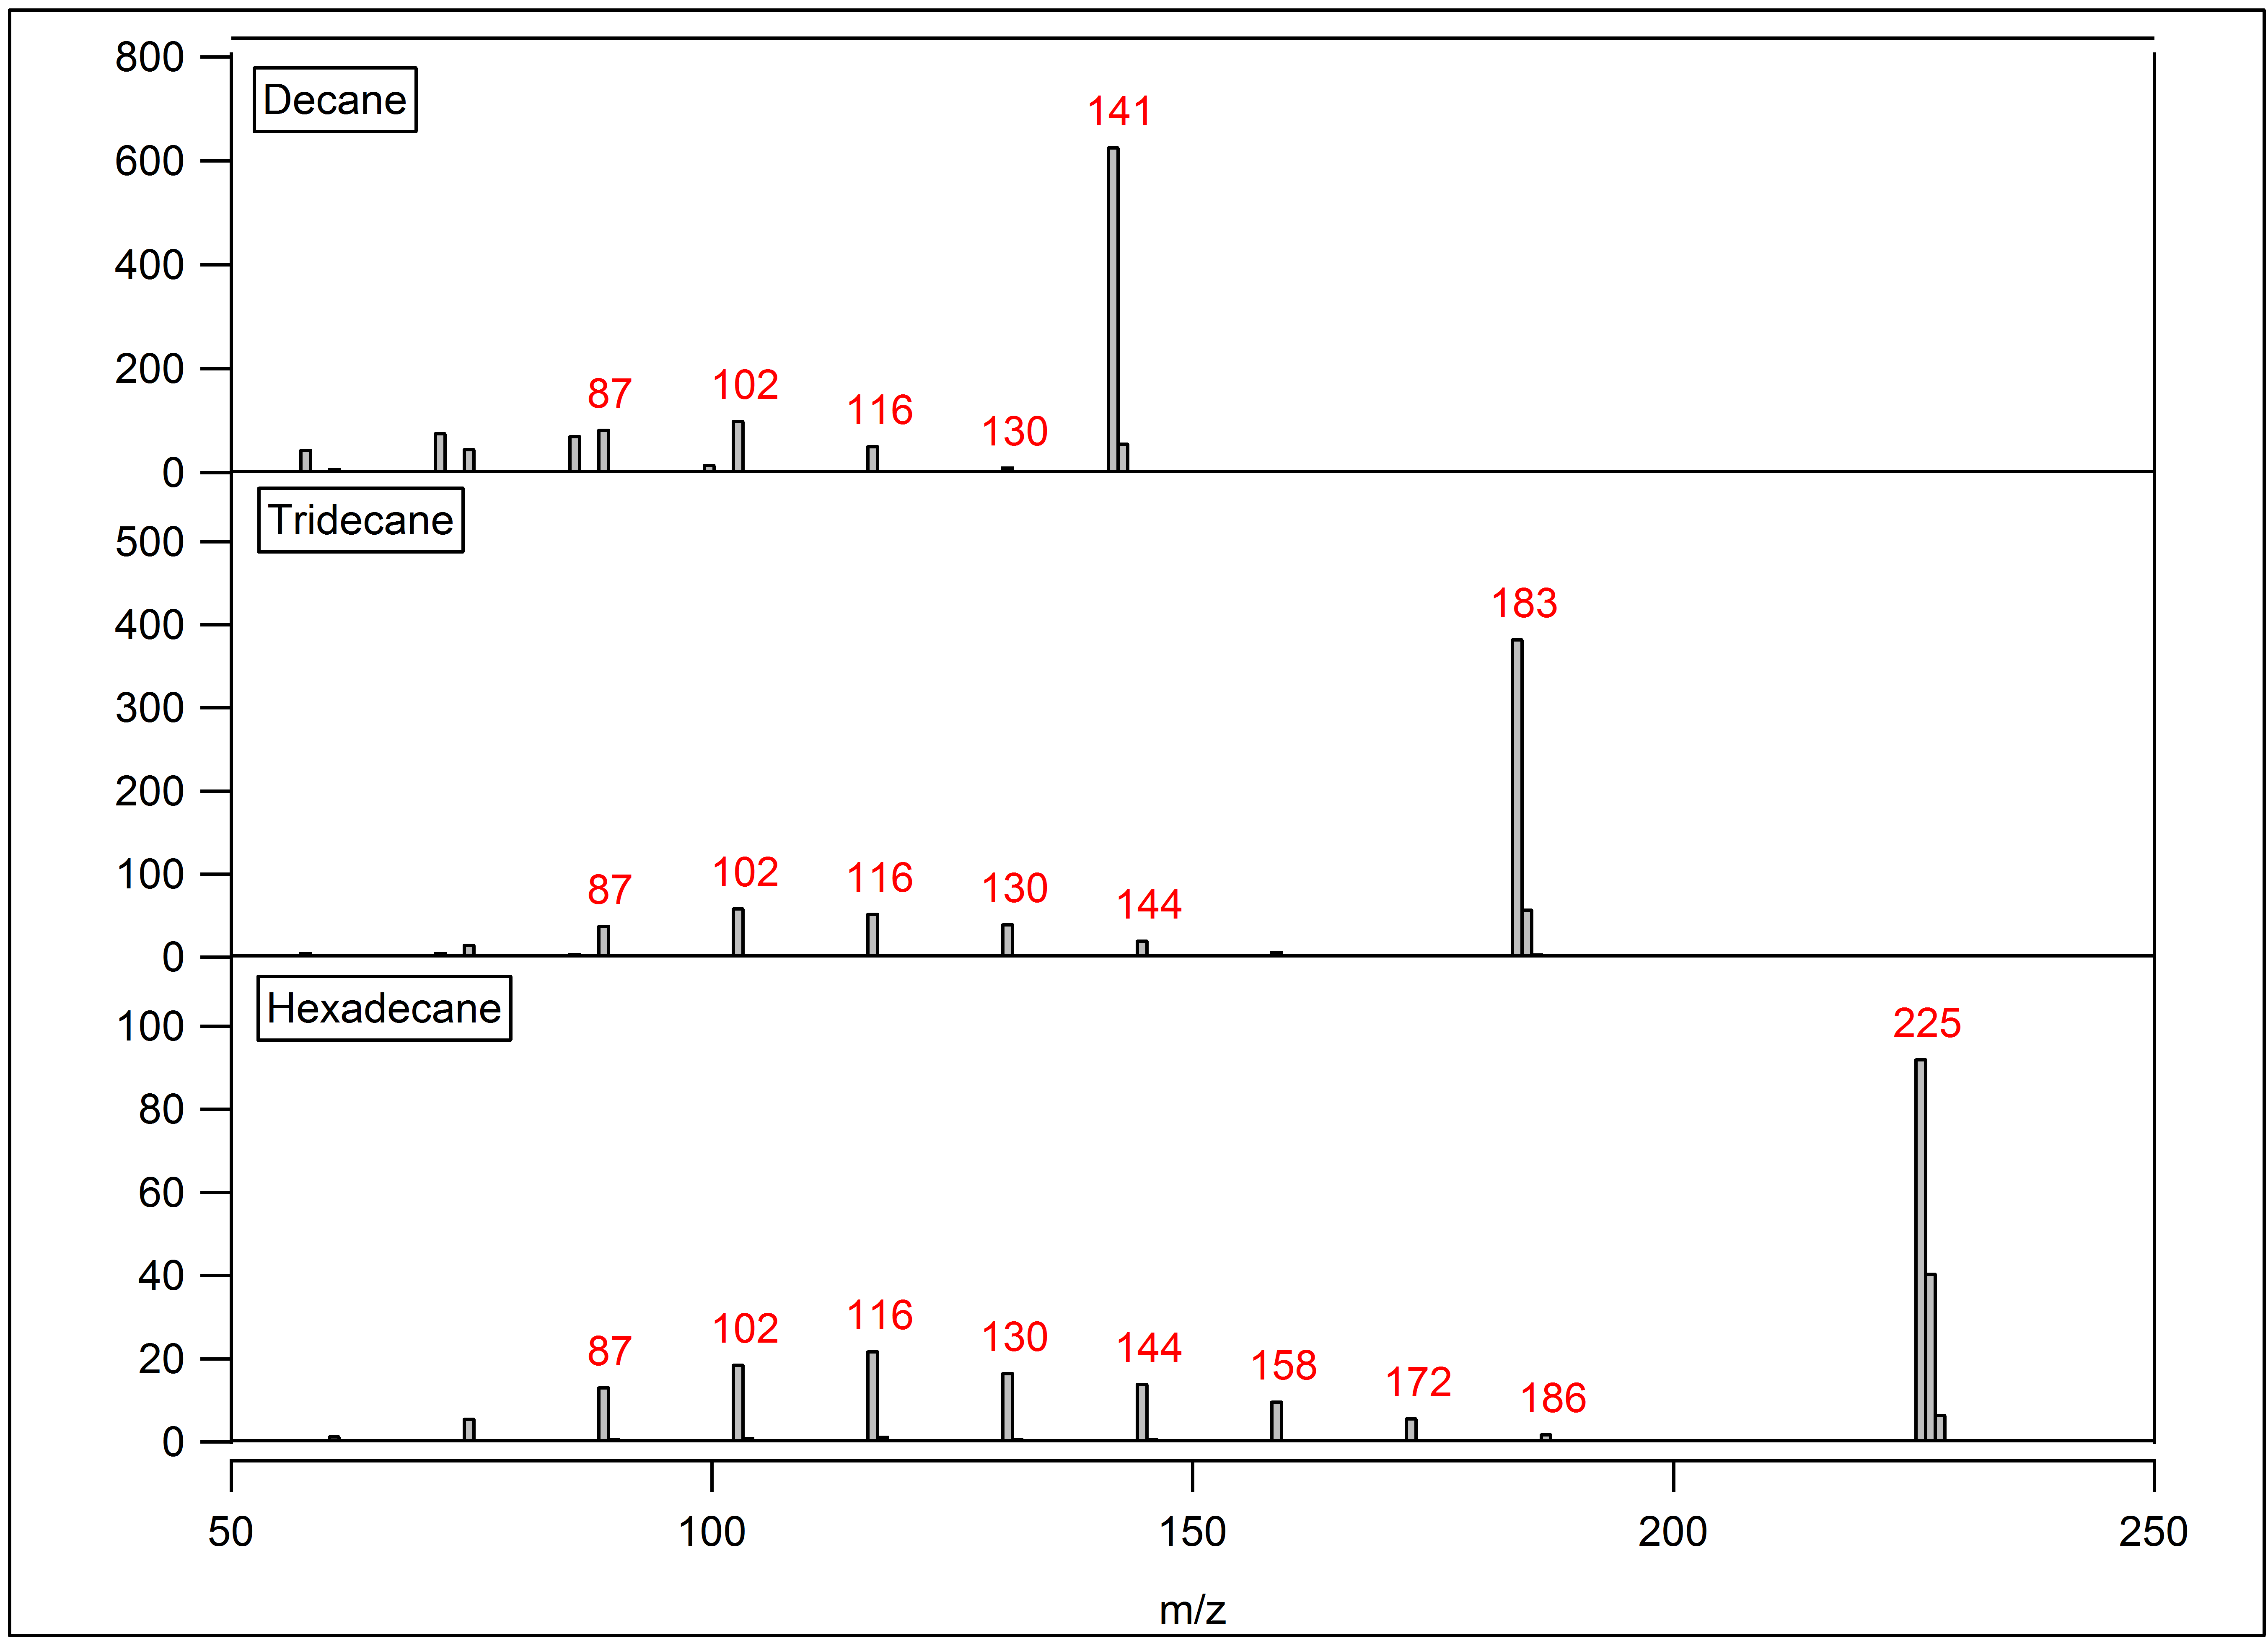
Diesel exhaust was sampled using NO+ to contrast information content of the mass spectrum against that obtained with H3O+. It was determined that using NO+ in IVOC mode would produce a more interpretable mass spectrum. These results are currently being written up as a manuscript to be submitted for publication.
Future Activities:
Activities in the next year will focus on analysis of final QC data from the field sampling campaigns, completing the chamber characterization studies. We have completed most of the field work on target and will be assisting Project 4 in scripted commute studies for the Center for Clean Air Research (CCAR) using instruments from the mobile platform. Data QC and review are underway for the cities that already have been sampled working with the Biostatistics Core. Work on publications and dissemination of results is underway.
Journal Articles on this Report : 7 Displayed | Download in RIS Format
| Other subproject views: | All 43 publications | 18 publications in selected types | All 18 journal articles |
|---|---|---|---|
| Other center views: | All 197 publications | 94 publications in selected types | All 93 journal articles |
| Type | Citation | ||
|---|---|---|---|
|
|
Erickson MH, Gueneron M, Jobson BT. Measuring long chain alkanes in diesel engine exhaust by thermal desorption PTR-MS. Atmospheric Measurement Techniques 2014;7(1):225-239. |
R834796 (2014) R834796 (2015) R834796C001 (2015) R834796C001 (Final) |
Exit Exit Exit |
|
|
Galaviz VE, Yost MG, Simpson CD, Camp JE, Paulsen MH, Elder JP, Hoffman L, Flores D, Quintana PJE. Traffic pollutant exposures experienced by pedestrians waiting to enter the U.S. at a major U.S.-Mexico border crossing. Atmospheric Environment 2014;88:362-369. |
R834796 (2014) R834796 (2015) R834796 (2016) R834796 (Final) R834796C001 (2015) R834796C001 (Final) |
Exit Exit Exit |
|
|
Gueneron M, Erickson MH, VanderSchelden GS, Jobson BT. PTR-MS fragmentation patterns of gasoline hydrocarbons. International Journal of Mass Spectrometry 2015;379:97-109. |
R834796 (2014) R834796 (2015) R834796 (Final) R834796C001 (2015) R834796C001 (Final) |
Exit Exit Exit |
|
|
Herring CL, Faiola CL, Massoli P, Sueper D, Erickson MH, McDonald JD, Simpson CD, Yost MG, Jobson BT, VanReken TM. New methodology for quantifying polycyclic aromatic hydrocarbons (PAHs) using high-resolution aerosol mass spectrometry. Aerosol Science and Technology 2015;49(11):1131-1148. |
R834796 (2015) R834796 (Final) R834796C001 (2015) R834796C001 (Final) |
Exit Exit Exit |
|
|
Hudda N, Gould T, Hartin K, Larson TV, Fruin SA. Emissions from an international airport increase particle number concentrations 4-fold at 10 km downwind. Environmental Science & Technology 2014;48(12):6628-6635. |
R834796 (2014) R834796 (2015) R834796 (Final) R834796C001 (2015) R834796C001 (Final) |
Exit Exit Exit |
|
|
Riley EA, Banks L, Fintzi J, Gould TR, Hartin K, Schaal L, Davey M, Sheppard L, Larson T, Yost MG, Simpson CD. Multi-pollutant mobile platform measurements of air pollutants adjacent to a major roadway. Atmospheric Environment 2014;98:492-499. |
R834796 (2014) R834796 (2015) R834796 (Final) R834796C001 (2015) R834796C001 (2016) R834796C001 (Final) |
Exit Exit Exit |
|
|
Xu W, Riley EA, Austin E, Sasakura M, Schaal L, Gould TR, Hartin K, Simpson CD, Sampson PD, Yost MG, Larson TV, Xiu G, Vedal S. Use of mobile and passive badge air monitoring data for NOx and ozone air pollution spatial exposure prediction models. Journal of Exposure Science and Environmental Epidemiology 2017;27(2):184-192. |
R834796 (Final) R834796C001 (2015) R834796C001 (2016) R834796C001 (Final) |
Exit Exit |
Supplemental Keywords:
chemical transport, community exposures, exposure science, mobile monitoring, Health, Air, Scientific Discipline, ENVIRONMENTAL MANAGEMENT, Health Risk Assessment, Risk Assessments, Air Quality, mobile sources, Atmospheric Sciences, Biochemistry, air toxics, Environmental Monitoring, Risk Assessment, aerosol particles, vehicle emissions, bioavailability, atmospheric chemistry, motor vehicle emissions, particulate matter, motor vehicle exhaust, ambient particle health effects, cardiotoxicity, air quality models, air pollutants, atmospheric aerosols, atmospheric particulate matter, vascular dysfunction, ambient air quality, air pollution, cardiovascular disease, exposure assessment, airway diseaseRelevant Websites:
University of Washington Center for Clear Air Research (UW CCAR) Exit
Progress and Final Reports:
Original AbstractMain Center Abstract and Reports:
R834796 University of Washington Center for Clean Air Research Subprojects under this Center: (EPA does not fund or establish subprojects; EPA awards and manages the overall grant for this center).
R834796C001 Exposure Mapping – Characterization of Gases and Particles for ExposureAssessment in Health Effects and Laboratory Studies
R834796C002 Simulated Roadway Exposure Atmospheres for Laboratory Animal and Human Studies
R834796C003 Cardiovascular Consequences of Immune Modification by Traffic-Related Emissions
R834796C004 Vascular Response to Traffic-Derived Inhalation in Humans
R834796C005 Effects of Long-Term Exposure to Traffic-Derived Particles and Gases on Subclinical Measures of Cardiovascular Disease in a Multi-Ethnic Cohort
The perspectives, information and conclusions conveyed in research project abstracts, progress reports, final reports, journal abstracts and journal publications convey the viewpoints of the principal investigator and may not represent the views and policies of ORD and EPA. Conclusions drawn by the principal investigators have not been reviewed by the Agency.