
Grantee Research Project Results
Final Report: A Sustainable Approach to Nitrate Reduction Using a Stream Denitrifying Biofilm
EPA Grant Number: SU834756Title: A Sustainable Approach to Nitrate Reduction Using a Stream Denitrifying Biofilm
Investigators: Barone, Justin Robert , Fahs, Ryan , Harvey, Kate , Hise, Adam , Kittur, Harsha , Langellotti, Kelsey , Lee, Parker , Mayo, Charlie , Neighbors, Daniel , Umberger, Ashley , Vaught, Daniel
Institution: Virginia Tech
EPA Project Officer: Page, Angela
Phase: II
Project Period: August 15, 2010 through August 14, 2012 (Extended to August 14, 2013)
Project Amount: $74,152
RFA: P3 Awards: A National Student Design Competition for Sustainability Focusing on People, Prosperity and the Planet - Phase 2 (2010) Recipients Lists
Research Category: Pollution Prevention/Sustainable Development , P3 Awards , P3 Challenge Area - Safe and Sustainable Water Resources , P3 Challenge Area - Chemical Safety , Sustainable and Healthy Communities
Objective:
1) Thoroughly characterize a laboratory-scale denitrifying bioreactor. 2) Design and construct a pilot-scale denitrifying bioreactor based on the laboratory-scale design. 3) Assess the efficacy of the pilot-scale bioreactor. 4) Assess the feasibility of converting hydrocarbon pollutants to benign compounds in a bioreactor. Note: These objectives are a modification from previous objectives. Previous objectives included implementing the pilot-scale denitrifying bioreactor into a stream, assessing its efficacy during runoff events, and assessing its economics, aesthetic appeal, and social implications. Unfortunately, two of the driest summers on record in 2011 and 2012 (less than half of average rainfall with no significant runoff events) did not allow for the actual implementation of the pilot-scale bioreactor.1 This forced a re-evaluation of the objectives with the newly added Objective #4.
Summary/Accomplishments (Outputs/Outcomes):
The original bioreactor design was a simple packed bed reactor developed during Phase I. A 2.54 cm inside diameter (ID) and 55 cm long clear polyvinyl chloride (PVC) tube was filled with 3 mm diameter glass spheres. The bioreactor was inoculated with bacteria from Strouble’s Creek on the Virginia Tech campus, which is part of the Chesapeake Bay watershed and has high nitrate concentrations. This design was inadequate in that the loss of pressure from the inlet to the outlet was significant and did not allow for complete biofilm growth over the last 1/3 of the bioreactor. As part of Phase I, the students redesigned the bioreactor to have inlets along the bioreactor length (Figure 1a). This allowed for complete biofilm growth along the length. The design had good denitrification and was scaled up to 10.16 cm ID and 2.29 m long (Figure 1b). Denitrification results and pilot-scale bioreactor design criteria were reported in the last project report sent to EPA on September 20, 2011. Results presented henceforth represent data collected since the last project report.
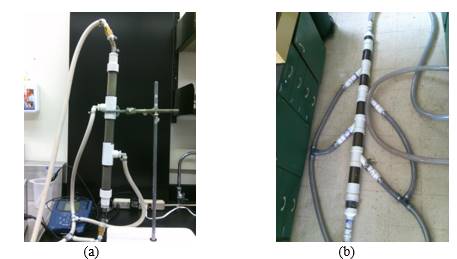
Figure 1. (a) Laboratory-scale (“in-series”) and (b) pilot-scale bioreactors.
The pilot-scale bioreactor could denitrify in one pass with a denitrification rate of 28.3 (mg/L)/min at a Reynold’s Number of NRe=1,844. The increase in the denitrification rate with scale-up was attributed to three factors: 1) a larger biofilm because there was bacteria growing on the much larger piping system feeding the bioreactor, 2) significant recirculating, or secondary, flow near each inlet that kept water inside the bioreactor longer, and 3) improved mass transfer in the turbulent region not captured in our original model, which was based on laminar flow.2 However, the lack of runoff events during summer 2011 and 2012 did not provide the opportunity to perform actual field evaluations on the bioreactor. To keep the project moving forward, the students decided to focus on two new aspects of the bioreactor: 1) a new design to eliminate the secondary flow and 2) feeding other pollutants into the bioreactor and looking for valuable co-products.
Although it was hypothesized that the recirculating flow was partially responsible for the increased denitrification rate in the pilot-scale bioreactor (in 1 pass), it was desired to eliminate it because of the larger potential to remove the biofilm from the packed bed surface with longer term use. The new design divided the bioreactor into small sections that were now placed in parallel rather than in-series (Figure 2). The secondary flow was eliminated and allowed for complete biofilm growth along the reactor length while maintaining the same overall bioreactor length. Unfortunately, this bioreactor had a modest denitrification rate of 0.13 (mg/L)/min at NRe=45, which was lower than the 0.22 (mg/L)/min at NRe=45 denitrification rate measured in the in-series bioreactor. This was attributed to difficulties inoculating the bioreactor.
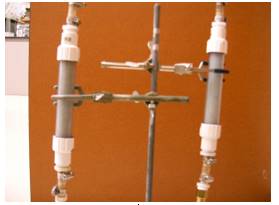
Figure 2. Laboratory scale, “in-parallel” bioreactor eliminates secondary flow from multiple inputs.
At this point, the students decided to look at remediating hydrocarbons and to look for valuable co-products. A bioreactor was designed for compatibility with the Western Virginia Water Authority (WVWA) Regional Water Pollution Control Plant and can process the hydrocarbon fraction of wastewater to acceptable discharge levels. The desired outcome was to construct an efficient biodegradation and biochemical recovery system to degrade waste hydrocarbons to a biochemical product with a selling price that offset the process costs. Figure 3 shows a flow chart of the proposed process.
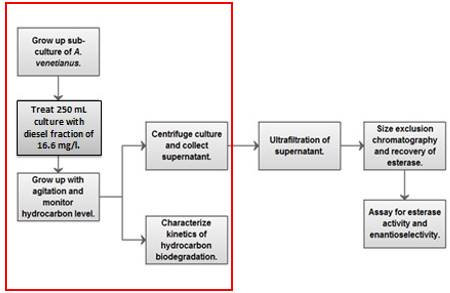
Figure 3. Designed bench-top batch process presented as flowchart with design focus outlined in red.
WVWA provided data concerning effluent concentration, flow-through, and diesel fraction of a typical waste stream, which is presented in Table 1. The flow through of the plant was roughly 40 MGD, the effluent concentration of hydrocarbon was roughly 6 mg/L, and the diesel fraction of the wastewater was 40 mg/L. Analysis resulted in an estimated total daily hydrocarbon load of 7,189 L/day (using diesel density of 0.832 kg/L) that must be reduced to 898 L/day. The WVWA hydrocarbon data was selected to model the feed stream for the design.
Table 1. Effluent flow and composition data from WVWA.
| Parameter | Average Daily Value |
| Flow (MGD) | 39.5 |
| BOD (mg/L) | 1.00 |
| TSS (mg/L) | 0.82 |
| TKN (mg/L) | 1.19 |
| Phosphorus (mg/L) | 0.08 |
| Diesel fuel* (mg/L) | 40.0 |
BOD is biological oxygen demand; TSS is total suspended solids; TKN is total Kjeldahl nitrogen; *denotes the diesel fraction before oil-water separation
This part of the design project focused on identifying suitable hydrocarbon-utilizing bacteria, measuring hydrocarbon reduction, identifying co-products, and providing recommendations for scale-up that would be suitable for WVWA. It was decided to use Acinetobacter venetianus (ATCC 31012) because it is a gram negative, nonmotile, aerobic bacterium that is also capable of reducing nitrate, so any bioreactor could simultaneously denitrify and remediate hydrocarbons.3 A. venetianus has been isolated from tar on the beach. It has been studied and found to produce esterases and bioemulsans extracellularly.4 The esterases and emulsans produced help mix the crude oil feedstock into the culture and break down fatty acids.4 These products are growth associated and increase the availability of hydrocarbon for degradation, thereby allowing for a larger feed concentration.5 The esterases and emulsans produced are secreted extracellularly and are not destroyed during the biodegradation process, making them well suited for economical recovery.
The esterase is the main product being investigated because of the ease of recovery and many potential uses. The esterase produced by A. venetianus is a roughly 34.5 kDa globular protein secreted into the culture media continuously as the culture grows, resulting in a large build-up.5 Cell mass can be easily removed from the final culture through centrifugation, and then the esterase still present in growth media can be concentrated using ultrafiltration. The esterase can then be isolated through size exclusion chromatography and utilized for other applications.4 Esterase produced by A. venetianus has been shown to perform enantioselective reduction on certain esters, including organosilicon compounds.6 Similar esterases have also been shown to optically resolve other ester compounds, such as 2-benzyloxypropionic acid ethyl ester.
While the utility of the esterase has been shown, the selling price of the enzyme is a critical factor in designing the process. The specific esterase produced by A. venetianus is not commercially available, but two other enantioselective esterases produced by the Bacillus range in selling price from 2,500 to 5,700 $/g based on Sigma-Aldrich pricing. This price range is rather broad, but is very high when compared to a common industrial lipase enzyme that sells for 20 $/kg such as that from Candida antarctica. The selling price of the methane that a wastewater treatment process would typically produce from the hydrocarbon waste is 0.182 $/kg. Both of these selling prices are very low and the esterase has a high potential to generate enough revenue to make the process profitable.
A. venetianus received in freeze-dried form was resuspended using ATCC Nutrient Broth 3 following the manufacturer’s instructions. The culture was grown up at 37˚C and 200 rpm agitation for 20 hours and T-streaked onto ATCC Nutrient Broth 3 agar plates. The resulting Tstreak of A. venetianus is shown below in Figure 4. The colonies appeared similar to the colony description and the culture followed the expected results of McConkey agar, catalase activity, and gram-staining tests.
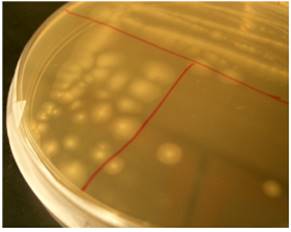
Figure 4. A. venetianus isolated as individual colonies on an ATTC Nutrient Broth 3 agar plate.
The initial diesel (hydrocarbon) biodegradation process was tested with trials varying volume, initial diesel fuel concentration, and agitation speed. The results of the initial tests led to the biodegradation process being carried out with ATCC Nutrient Broth 3 half-strength medium at a volume of 250 mL. The 250 mL culture was inoculated with a seed culture of A. venetianus. Diesel fuel was added to a concentration of 16.6 mg/L after the 250 mL culture was grown up to an optical density at 600 nm, OD600, of 0.7. The culture was allowed to ferment and the thin oil layer could be visibly observed turning white and becoming heavily emulsified into the aqueous layer. The culture was sampled at 22 and 38.6 hours after addition of diesel and the hydrocarbon level was measured using the Hanby Test Kit. This process was repeated for a total of three replicates and the same level of hydrocarbon degradation was measured for each replicate. The culture was streaked on ATCC Nutrient Broth 3 agar plates after 38.6 hours to ensure culture viability. The results of the initial biodegradation tests with varying parameters are given in Table 2.
Table 2. Initial diesel biodegradation results.
| Volume (ml) | OD600 at diesel addition | c0 (mg/l) | Reduced c (mg/l) | Time to reduction (hr) | Speed of agitation (rpm) |
| 250 | 0.7 | 33.2 | 20 | 19 | 400 |
| 250 | 0.7 | 33.2 | >20 | 24 | 200 (shaking) |
| 500 | 0.5 | 66.4 | 20 | 18.5 | 200 (shaking) |
These results indicated that the biodegradation process could be improved by using magnetic stir bar agitation and lowering the initial diesel fraction added to the culture. The biodegradation rate was determined by plotting the natural log of the ratio of the concentration, c, to initial concentration, c0, versus time, assuming first-order kinetics. The resulting reaction rate was 0.00185 min-1, which was used for scale-up.
The determination of the volumetric mass transfer coefficient (kLa) was also relevant to the scale-up process. The unsteady state approximation was used to calculate kLa. A 250 mL ATCC Nutrient Broth 3 sample was prepared but not inoculated. The sample was briefly placed in a vacuum chamber and all air was removed. A dissolved oxygen (DO) probe was used to monitor the culture as the agitation was turned back on. The DO level was monitored for 7 minutes in 1 minute intervals. kLa was determined using the unsteady state method by plotting the natural log difference of the saturation DO concentration for the reaction temperature and the concentration at a time point versus time. The maximum saturation DO concentration was assumed to be 8.56 mg/L based on the reaction temperature. The kLa value determined from the regression was 0.331 min-1 and was in the correct order of magnitude for small-scale bioreactor kLa values.7 The kLa value was used in the scale-up to estimate the necessary oxygen transfer rate.
Finally, centrifugation is needed as part of the process to collect the cells and recover esterase.8
The centrifugation process was characterized by taking samples of culture after the full biodegradation and centrifuging in a laboratory scale centrifuge at different speeds and times. The effectiveness was evaluated using the OD600 reduction. The physical dimensions of the centrifuge were measured and used to scale the process up to an industrial size. A 250 mL culture that had undergone a 38.6 hour hydrocarbon degradation was sampled for the centrifugation. The OD600 of the original culture was measured to be 1.76. 2 mL samples were aliquoted into 2 mL Eppendorf tubes in duplicate. Angular velocity settings of 10,000 rpm and 5,000 rpm were tested and 2 samples were centrifuged at each velocity for 30, 60, and 90 seconds, respectively. The 5,000 rpm setting also had 2 samples centrifuged for 120 seconds. After centrifugation, 1 mL of the supernatant was removed and OD600 was measured using a spectrophotometer (Table 3). The results were analyzed assuming that the OD600 reading is representative of the cell concentration in the culture and that at least a 98% reduction in OD600 is indicative of sufficient cell removal. This gave a centrifugation time of less than 30 seconds for 10,000 rpm and 90 seconds for 5,000 rpm in the laboratory scale centrifuge geometry. The times and angular velocities can be used to estimate the settling velocity of the cells and scale-up the centrifugation process.
Table 3. Centrifugation parameters for cell separation.
| 10,000 rpm | 5,000 rpm | |
| Time (s) | % OD600 reduction | % OD600 reduction |
| 30 | 99.03 | 94.20 |
| 60 | 99.26 | 97.33 |
| 90 | 99.49 | 98.86 |
| 120 | N/A | 99.94 |
The underlying assumption for the scale-up is that designing the scaled-up bioreactor with the same geometric constraints as the small scale reactor will allow for the sizing of the larger scale reactor with similar kinetics. The scale-up calculations are theoretical and further empirical testing of the scaled-up system would be needed to compensate for any unforeseen effects of running the bioprocess in the larger system, similar to the scale-up anomalies found with the packed bed denitrifying bioreactor. However, these calculations form a good basis for the initial scale-up of the system. 80% headspace was assumed for the scale-up to ensure good gas diffusion in the system. The necessary culture volume and hydrocarbon to be processed was estimated as 25% of the total daily load and was 86,000 L/day. The scale-up was designed around a 20,000 L bioreactor because it is one of the largest industrial scale reactors available. Therefore, seven 20,000 L bioreactors are required to process the required volumes. For the estimated scale-up volume of 20,000 L per bioreactor, each bioreactor should be 2.10 m in diameter, 5.78 m long, and be mixed by an impeller of 1.31 m diameter. The geometric similarity should allow for similar mass transfer and reaction kinetics in the scaled-up process, but will require experimental measurements to verify the scale-up calculations. The best bioreactor design was determined to be a two-phase partitioning reactor (TPPR) because the diffusion rate between the two phases in the TPPR allows for a very concentrated waste feed to be handled relative to a packed bed reactor (PBR). A decision matrix shows that the TPPR presents the best balance between low equipment and maintenance cost, high degradation rate, and high load capacity (Table 4).
Table 4. Decision matrix for reactor design solutions with weighted totals.
| Criterion | Weight | PBR | CSTR | TPPR | TPFBR |
| Equipment Cost | 20 | 5 | 4 | 4 | 3 |
| Maintenance Cost | 20 | 2 | 3 | 4 | 2 |
| Rate of Degradation | 30 | 2 | 2 | 4 | 5 |
| Hydrocarbon Load Capacity | 30 | 4 | 4 | 5 | 2 |
| Total Score | 500 | 320 | 320 | 430 | 310 |
PBR is packed bed reactor; CSTR is continuously stirred tank reactor; TPPR is two-phase partitioning reactor; TPFBR is two-phase fluidized bed reactor
A flow rate of 3,200 L hr-1 was assumed based on industrial sized centrifuges and recommendations.8 The time to centrifuge the total batch liquid volume was estimated with a design of 5 centrifuge units in operation and was equal to 7.33 hours. The best centrifuge conditions were found to be l =1 m, D = 0.5 m, and ω = 11,500 rpm, which was the best compromise between sizing the centrifuge and the speed at which the centrifuge must be run.
Conclusions:
1. The pilot-scale packed bed denitrifying bioreactor is very efficient and can denitrify to EPA acceptable levels in 1 pass. The increased denitrification rate over the laboratory-scale reactor was attributed to secondary flow, turbulent flow, and increased biofilm on feed piping. In an actual stream runoff situation, there would be no excess feed piping and the turbulent flow may not be as great so the denitrification rate may be reduced but not to levels that would require more than 1 pass. This bioreactor can be built for about $350. For a small stream, 510 across the stream would cover the entire stream cross-sectional area. It is recommended to perform actual stream denitrifying experiments and to assess actual bioreactor maintenance costs, as per the original project objectives, if runoff conditions are right.
2. Running shorter packed bed bioreactors in parallel rather than in series can maintain high biofilm growth along the reactor length and eliminate secondary flow from multiple inlets. These bioreactors should perform as good, if not better than, the in-series bioreactor if inoculated properly.
3. There is a commercial need for hydrocarbon eliminating bioreactors in both oil spill remediation and in wastewater treatment. Acinetobacter venetianus can convert hydrocarbons, such as diesel fuel, to useful products like esterase. Esterase can be sold for ca. $2,500/kg and can cover the costs and return a profit for a hydrocarbon eliminating bioreactor introduced into a typical wastewater treatment process.
4. 7 20,000 L TPPR bioreactors would be needed at the WVWA facility. These should be 2.10 m in diameter, 5.78 m long, and be mixed by an impeller of 1.31 m diameter. 5 commercial tubular-bowl centrifuges should be used to separate cells at acceptable WVWA flow rates and should be l =1 m and D = 0.5 m when operating at an angular velocity of ω = 5500 rpm. The total capital cost is the sum of the capital costs for all pieces of equipment. The process consisted of 7 bioreactors and 5 centrifuges. The total capital cost calculation resulted in a total capital cost of $5,132,827.
5. This P3 project demonstrated benefits to people through improved health from pollution mitigation, prosperity indirectly from clean water and directly from the sale of high value esterase, and the planet through an improved environment from pollution mitigation.
References:
1 http://www.erh.noaa.gov
2 Geankoplis, C., Transport Processes and Separation Process Principles Pearson Education, Inc.: Upper Saddle River, NJ, 2003.
3 Abro, S. H.; Wagan, R.; Tunio, M. T.; Kamboh, A. A.; Munir, M., Biochemical activities of bacterial species isolated from frozen semen of cattle Journal of Agriculture and Social Sciences 2009, 5, 109-113.
4 Shabtai, Y.; Gutnick, D. L., Exocellular esterase and emulsan release from the cell surface of Acinetobacter calcoaceticus Journal of Bacteriology 1985, 161, 1176-1181.
5 Rosenburg, E.; Zuckerberg, A.; Rubinovitz, C.; Gutnick, D. L., Emulsifier of Arthrobacter RAG-1: isolation and emulsifying properties Applied and Environmental Microbiology 1979, 37, 402-408.
6 Syldatk, C. A.; Stoffregen, A.; Wuttke, F.; Tacke, R., Enantioselective reduction of acetyldimethylphenylsilane: A screening with thirty strains of microorganisms Biotechnology Letters 1988, 10, 731-736.
7 Shuler, M. L.; Kargi, F., Bioprocess Engineering: Basic Concepts. Prentice Hall PTR: Upper Saddle River, NJ, 2002.
8 Harrison, R. G.; Todd, P.; Rudge, S. R.; Petrides, D. P., Bioseparations Science and Engineering. Oxford University Press: New York, 2003.
Progress and Final Reports:
Original AbstractP3 Phase I:
A Sustainable Approach to Nitrate Reduction Combining a Riparian Zone with a Stream Denitrifying Biofilm | Final ReportThe perspectives, information and conclusions conveyed in research project abstracts, progress reports, final reports, journal abstracts and journal publications convey the viewpoints of the principal investigator and may not represent the views and policies of ORD and EPA. Conclusions drawn by the principal investigators have not been reviewed by the Agency.