
Grantee Research Project Results
2011 Progress Report: A Sustainable Approach to Nitrate Reduction Using a Stream Denitrifying Biofilm
EPA Grant Number: SU834756Title: A Sustainable Approach to Nitrate Reduction Using a Stream Denitrifying Biofilm
Investigators: Barone, Justin Robert
Current Investigators: Barone, Justin Robert , Fahs, Ryan , Harvey, Kate , Hise, Adam , Kittur, Harsha , Langellotti, Kelsey , Lee, Parker , Mayo, Charlie , Neighbors, Daniel , Umberger, Ashley , Vaught, Daniel
Institution: Virginia Tech
EPA Project Officer: Page, Angela
Phase: II
Project Period: August 15, 2010 through August 14, 2012 (Extended to August 14, 2013)
Project Period Covered by this Report: August 15, 2010 through August 14,2011
Project Amount: $74,152
RFA: P3 Awards: A National Student Design Competition for Sustainability Focusing on People, Prosperity and the Planet - Phase 2 (2010) Recipients Lists
Research Category: Pollution Prevention/Sustainable Development , P3 Awards , P3 Challenge Area - Safe and Sustainable Water Resources , P3 Challenge Area - Chemical Safety , Sustainable and Healthy Communities
Objective:
- Design and construct a large-scale bioreactor and implement it into a stream.
- Assess the efficacy of the bioreactor under optimum and non-optimum operating conditions.
- Assess the economic feasibility of the bioreactor technology by gathering actual construction, implementation, and maintenance costs. 4) Assess the aesthetic and social aspects of the bioreactor technology.
Progress Summary:
Undergraduate student design teams will again be assembled to build and test prototype bioreactors based on our original laboratory design.
First, we validated our theoretical bioreactor model by:
- Experimentally determining the denitrification rate, k, as a function of Reynolds number, NRe.
- Verifying the amount of nitrate entering the biofilm, cb, as a function of NRe.
An inoculum was prepared with soil collected from the Duck Pond/Strouble’s Creek confluence, the area we determined to have the highest denitrifying bacteria concentration in Phase I, LB Broth, and nutrients. The carbon to nitrogen ratio, C/N, was 2, to provide enough carbon to support cell growth during the initial seeding of the bioreactor. A good inoculum will show gas production and smell, which was observed over 3 days. After 3 days, the liquid portion above the soil was decanted. This was approximately 800 ml of inoculum. 150 ml of leftover LB broth was added and then supplemented with 0.95 g KNO3 and 0.48 g ethanol. Measured dissolved oxygen, DO=0.13 mg/L so no Na2SO3 was added. The inoculum was now pumped through the bioreactor at ambient conditions. 2 drops of ethanol was added every 2 days. Biofilm formation was observed on the spherical media within a day. 0.25 g KNO3 was added after a week. Another inoculum similar to the one described above was prepared. After decanting, DO=0.11 mg/L so no Na2SO3 was added. The 1st inoculum was replaced with the 2nd after 9 days. The bioreactor was inoculated with the 2nd inoculum for 4 days. After 4 days, the bioreactor was flushed with 1 L of “dirty water” (1 L DI H2O, 200 mg KNO3, 53.4 mg ethanol, C/N=1, the lower C content can maintain the existing biofilm). DO=4.5 so 31 mg Na2SO3 was added, which reduced DO to 0.13 mg/L. Each preparation of “dirty water” showed the same thing so Na2SO3 was added each time. More than likely, mixing the solutes allowed dissolved oxygen to propagate into the water, which did not leave in a reasonable time.
Denitrification experiments were conducted by pumping “dirty water” through the bioreactor at v’=0.004 m/s, 0.045 m/s, and 0.175 m/s. After the highest flow velocity experiment, the bioreactor media was swabbed and cultured on agar plates. The plates were incubated at 37oC and visually monitored for 3 days. The results are shown in Figure 1.
| | |
| Figure 1. (a) 24, (b) 48, and (c) 72 hr culture of bioreactor media.
| |
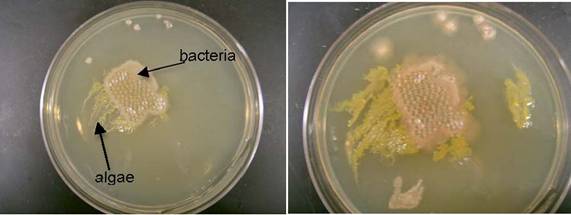
As in previous experiments, bacteria and algae growth were observed. On a volume basis, the bacteria were more prevalent than the algae. This meant the algae that survived the inoculation process were able to adjust to high nitrate conditions and more than likely aid in the denitrification process. It did not appear that the algae growth clogged the bioreactor. We proved this by measuring flow rates with and without the biofilm and they were the same.
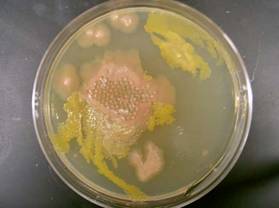
The concentration of nitrate, NO3-, as a function of time at the three experimental velocities is plotted in Figure 2. Nitrate was measured according to EPA Method 353.2 on a Lachat® QuickChem 8500 Flow Injection Analysis instrument. The theoretical amount of initial NO3-was c0=27.8 mg/L, which was very close to that measured. There were 3 pertinent features in the data:
- The initial NO3- concentration, c0 (mg/L), at time=0 min.
- The denitrification or catalytic rate, k (mg/L)/min, represented by the changing portion of the curve over about the first 100-150 min.
- The final NO3- concentration, c_ (mg/L), at long times (the asymptote).
y = 27.98 - 0.23697x R2= 0.96123
y = 25.728 - 0.19367x R2= 0.94229
y = 22.392 - 0.15004x R2= 0.94738
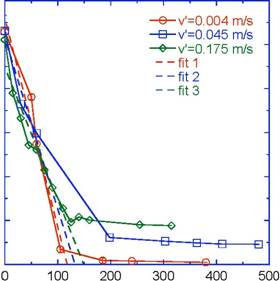
Figure 2. Experimental denitrification data for 3 experimental velocities in lab scale bioreactor.
The denitrification rate, k, was found by fitting the initial, time-dependent portion of the data to a linear regression and the results are shown in Figure 2. Error bars are on the graph and are within the symbols. However, the error represents multiple tests from the same velocity experiment. We have repeated the experiment multiple times and are in the process of analyzing that data. The r2 values were good and the rates as a function of NRe are plotted in Figure 3.
Finally, the lab scale bioreactor was modeled using the model outlined in the Phase I report.
The model is shown in Figure 4 where c0=cAi and cb=c0-c_ . Two values for c0 were used, the theoretical value of 27.8 mg/L and an average of the 3 experimental values, 26.2 mg/L. There was very good agreement between the theoretical prediction and the experimentally observed value of how much nitrate entered the biofilm at a given flow condition, cb. This will aid in design by showing how much nitrate actually makes it into the biofilm and how much completely bypasses it.
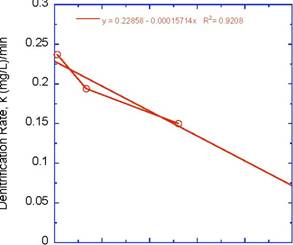
Figure 3. Bioreactor denitrification rate, k, versus Reynolds number, NRe.
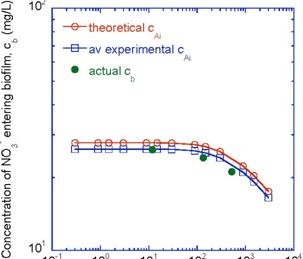
Figure 4. Concentration of nitrate entering biofilm, cb, versus Reynold’s number, NRe.
Construction of a pilot scale bioreactor was completed in May 2011, which was right on schedule. Figure 5 shows a comparison of the lab scale bioreactor (2.54 cm ID, 55 cm long), which was used to gather the Phase I and the data in Figures 1-4 here and the pilot scale bioreactor (10.16 cm ID, 2.29 m long). Once our bioreactor model was validated, we designed the pilot scale bioreactor by scaling up the model. Figure 6 shows the concentration of NO 3entering the biofilm as a function of bioreactor size and flow conditions for a 3 mm packed bed particle size and void fraction of 40%. The arrows indicate the anticipated NRe so the length of the bioreactor was chosen to be between 2 and 3 m, which would allow nearly all of the NO 3-to enter the biofilm in one pass. It was also very easy to build this size bioreactor with supplies purchased through an industrial plumbing supply. The major decision was what kind of media to use so that the bioreactor was not very heavy and could still be moved around. We chose lava rock that we then crushed to a smaller size but not 3 mm. Our initial assumption was that particle surface area was similar but this still needs to be validated. Next, we spent the better part of May and June fine tuning the bioreactor, fixing leaks, and determining the void volume, flow rates, and Reynold’s numbers through the bioreactor. We then inoculated the bioreactor but could not get denitrification after several attempts. It was determined that denitrifying bacteria could not be cultured from soil collected in May, which is when we collected it, even with high nitrate feeding. Previously, we collected bacteria in the summer. We re-collected the bacteria in July and were able to culture the denitrifying bacteria. The pilot scale bioreactor was inoculated and denitrifying experiments run. We are currently analyzing this data. The bioreactor is designed to handle high nitrate flows during runoff. Summer of 2011 was particularly dry with only 48% of average rainfall in July and August and no significant runoff event (www.erh.noaa.gov). Therefore, there was never ample opportunity to field test the bioreactor when runoff events were the most severe and nitrate levels were the highest, i.e., when they were applied in high concentrations on the golf course and farm adjacent to the Duck Pond and Strouble’s Creek on the Virginia Tech campus. We have been working with a water network composed of watershed groups, environmental consultants, and government agencies (Army Corps of Engineers, State Environmental Agency, State Wildlife Agency, USGS, etc.) who suggested that we put the bioreactor in the runoff ditches adjacent to the golf course and farm to mitigate the nitrate at the source. In addition, the bioreactor would be less visible there as opposed to the stream and we could keep it hydrated by pumping groundwater through it during dry periods.
| | |
| (a) | (b) |
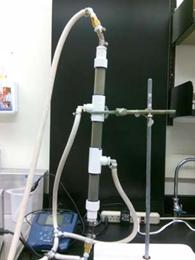
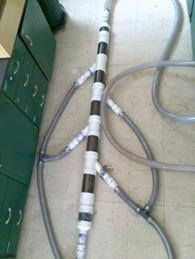
Figure 5. (a) Lab scale and (b) pilot scale bioreactors.
Next steps:
- Attempt to denitrify a runoff event before severe temperature drops occur.
- Finish analyzing lab scale data.
- Determine biofilm consortium.
- Analyze pilot scale data and run several more trials.
- Publish results to date, especially detailed lab scale results.
- Prepare for outside runoff trials next summer.
- Work with environmentalists to determine impression of bioreactor and the reaction to it in the stream vs. in the drainage ditch because each has its relative advantages and disadvantages.
- Finish cost analysis by determining labor costs to maintain bioreactor.
Concentration of NO -Entering Biofilm
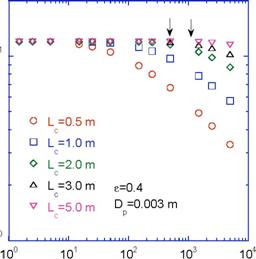
Figure 6. Concentration of NO3- entering biofilm for various bioreactor lengths.
Future Activities:
Upon completion of the project, we will have discovered: 1) the optimum overall size and type of packed bed for the large-scale bioreactor, 2) under what conditions the bioreactor performs the best and worst, and 3) the aesthetic and social value of the concept.
Conclusions:
- Culture bacteria during summer. These bacteria can be refrigerated and expanded at any time.
- A simple model relying on NRe and NO3- flux can be used to model NO3- concentrations in the bioreactor and to scale up.
- The bioreactor is very efficient and can denitrify significantly in a short amount of time. We are attempting to design a bioreactor to denitrify to EPA acceptable conditions in 1 pass.
Progress and Final Reports:
Original AbstractP3 Phase I:
A Sustainable Approach to Nitrate Reduction Combining a Riparian Zone with a Stream Denitrifying Biofilm | Final ReportThe perspectives, information and conclusions conveyed in research project abstracts, progress reports, final reports, journal abstracts and journal publications convey the viewpoints of the principal investigator and may not represent the views and policies of ORD and EPA. Conclusions drawn by the principal investigators have not been reviewed by the Agency.