
Grantee Research Project Results
Final Report: Innovative Management Options to Prevent Loss of Ecosystem Services Provided by Chinook Salmon in California: Overcoming the Effects of Climate Change
EPA Grant Number: R833017Title: Innovative Management Options to Prevent Loss of Ecosystem Services Provided by Chinook Salmon in California: Overcoming the Effects of Climate Change
Investigators:
Institution:
EPA Project Officer:
Project Period: October 1, 2007 through September 30, 2010 (Extended to September 30, 2011)
Project Amount: $722,963
RFA: Nonlinear Responses to Global Change in Linked Aquatic and Terrestrial Ecosystems and Effects of Multiple Factors on Terrestrial Ecosystems: A Joint Research Solicitation- EPA, DOE (2005) RFA Text | Recipients Lists
Research Category: Aquatic Ecosystems , Climate Change
Objective:
This has been an interdisciplinary study to investigate the implications of climate change for spring-run Chinook salmon and terrestrial ecosystems adjacent to spawning grounds, based on modeled changes in water temperature and flow conditions. Chinook salmon are a keystone species that link aquatic and terrestrial ecosystems and support directly or indirectly many ecosystem services in California watersheds. Annual runs of Pacific salmon historically transferred large quantities of marine-derived nutrients into the California interior through the direct consumption and decomposition of salmon carcasses, supporting forests, terrestrial animals, and other aquatic species (Merz and Moyle, 2006). The geographic focus of the study was Butte Creek, which was selected because of its critical role in plans for the protection of threatened spring-run Chinook populations and the apparent vulnerability of the system to climate change. This vulnerability stems from the fact that the low elevation headwater regions of Butte Creek, and the West Branch Feather River from which water is transferred into the Butte Creek watershed, could potentially limit snow accumulation and melt, which are important for the maintenance of suitable water temperature conditions for salmon. The complex set of non-linear interactions between habitat and ecosystems was represented by coupling models of physical and biological processes. The integrated watershed hydrology, water management, and water quality model, WEAP (Water Evaluation and Planning System), was being applied to address: a) rainfall-runoff watershed processes; b) water supply, use, withdrawal, return flows, outflows, and reservoir operations; and c) water quality, most notably water temperature in streams and reservoirs, which will be a critical determinant of the presence of the cold water conditions required by salmonids. WEAP outputs of water temperature and streamflow were passed to the SALMOD model, which simulates the population dynamics of anadromous and resident freshwater salmonid populations under variable ecological conditions. To take advantage of and extract additional value from ongoing reconnaissance visits to Butte Creek, we added two additional project elements to quantify the Butte Creek salmon nutrient footprint (salmon-based food web). In 2007, 2008, and 2009, motion detector scouting cameras were installed to document the identity and activities of salmon consumers. In 2008, stable isotope analysis (δ15N and δ13C ) was performed on selected plant and animal tissues to document the relative proportion of marine derived nutrients supplied to the system by salmon. Sampling for isotopes was expanded to include additional sites and biota in 2009. Results from these analyses were used to refine and validate the conceptual salmon-based food web model and to document the relative contribution of marine-derived nutrients supplied by spring-run salmon to the productivity of the system. In June 2010, we presented our preliminary results to an expert panel: WEAP and SALMOD results related to salmonid survival in Butte Creek under a range of future climate scenarios, as well as information from food web and isotope analysis. The expert panel was asked to assess the plausible implications of these results for terrestrial ecosystem services in the communities adjacent to spring-run spawning grounds. Using model runs that assume alternative water management arrangements, the expert panel also was asked to comment on the potential utility of strategies designed to better manage cold water resources and to increase the resilience of the ecosystem in the face of climate change. In August 2010, we presented the WEAP and SALMOD results to a stakeholder workshop with participants from resource agencies, hydropower utilities, and local environmental groups. We used feedback from the two workshops, plus multiple presentations of our work at scientific meetings, to make further refinements to the models and to refine the suite of management options we evaluated.
Our research objectives were formulated as a set of questions, first for the aquatic and then for the terrestrial system. For the aquatic system:
- Could gradual climate change lead to abrupt change in the Butte Creek ecosystem through severe reduction or even extinction of its spring-run Chinook salmon population?
- If the spawning habitat of the spring-run was restricted to the upstream portion of the watershed, would salmon populations remain viable? How often would this restriction occur under climate change and what would this mean for the spawning spring run?
- In light of climate change and other stressors, how would suitable habitat for the salmon shift under the assumption that there were to be no management interventions (e.g., the “natural” watershed)?
- What management options are available to ameliorate climate change impacts on the spring-run Chinook, and at what cost to other ecosystem services (municipal and industrial water supplies, irrigated agriculture, hydropower, and recreation)?
For the terrestrial system:
- What would be the implications for the terrestrial ecosystem, particularly wildlife communities in the riparian corridor, if the spring-run Chinook salmon population was abruptly lost as the result of climate change?
- Are there longitudinal attributes of the riparian ecosystem of Butte Creek that make particular reaches more or less suitable for enhanced biodiversity with salmon present (e.g., are there local access restrictions due to physical landscape attributes such as extreme slopes)?
We assembled a multidisciplinary team to answer these questions. Peter Moyle is a leading fish biologist in California whose recent work includes a study of the Mokelumne River where he found that riparian vegetation adjacent to spawning sites typically receives more than 20% of its foliar nitrogen (N) from marine sources and demonstrated that salmon are key players in transferring nutrients inland, supporting a wide variety of wildlife (Merz and Moyle, 2006). David Purkey has been assisting in the development of an innovative water resource modeling tool to address freshwater ecosystem services in the heavily managed watersheds of California, and has garnered important credibility with relevant stakeholders throughout the proposed region (Yates, et al., 2005 a,b). Lisa Thompson is an experienced population dynamics modeler of fisheries and lake ecosystems, and conducts studies of fish response to environmental factors such as flow and temperature in California rivers. The team’s terrestrial ecosystem expertise is found in Melanie Truan and Andrew Engilis Jr. Melanie Truan has conducted research on the riparian ecosystems of Northern California since 1997, and currently is involved in the development of multitaxonomic biotic indicators for models of riparian structure and function. Mr. Engilis, curator of the UC Davis Museum of Wildlife & Fisheries Biology, is an avian expert, with experience in avian-habitat relationships and in developing monitoring plans for terrestrial wildlife management.
Task A (WEAP Butte and Feather Watershed Model) and Task B (Spring Run Chinook)
Summary
Spring-run Chinook salmon (Oncorhynchus tshawytscha) are particularly vulnerable to climate change because adults over-summer in freshwater streams before spawning in autumn. We examined streamflow and water temperature regimes that could lead to long-term reductions in spring-run Chinook salmon (SRCS) in a California stream and evaluated management adaptations to ameliorate these impacts. We used bias-corrected and spatially downscaled climate data from six General Circulation Models and two emission scenarios for the period 2010–2099, as input to two linked models: WEAP to simulate weekly mean streamflow and water temperature in Butte Creek, California that were used as input to SALMOD, a spatially explicit and size/stage structured model of salmon population dynamics in freshwater systems. For all climate scenarios and model combinations, WEAP yielded lower summer base flows and higher water temperatures relative to historical conditions, while SALMOD yielded increased adult summer thermal mortality and population declines. Of management adaptations tested, only ceasing water diversion for power production from the summer holding reach resulted in cooler water temperatures, more adults surviving to spawn, and extended population survival time, albeit with a significant loss of power production. The most important conclusion of this work is that long-term survival of SRCS in Butte Creek is unlikely in the face of climate change and that simple changes to water operations are not likely to dramatically change vulnerability to extinction.
Introduction
The literature on aquatic ecosystem services in freshwater systems has converged on three service categories: provisional, regulatory, and cultural (Millennium Ecosystem Assessment 2005). Within the first set of services, the provision of water for consumptive use (e.g., drinking water), non-consumptive use (e.g., hydropower) and aquatic organisms (e.g., fish for food) are typically combined. This combination points out the difficult tradeoffs inherent in the management of freshwater ecosystem services because these services often conflict. In California, for example, service provision rests on a complex and shifting balance of natural and human forces. Climatic variability and watershed response are critical determinants of flow regime and water quality of streams, but these hydrologic signals are dramatically altered by land management decisions and the operation of hydraulic infrastructure (Graf, 1999; Yates, et al., 2008; Zalewski, 2002; Yates, et al., 2009).
After decades of such alteration, provisional services related to aquatic organisms in California have experienced marked decline, most acutely for Pacific salmon (Salmonidae). Historical Chinook salmon (Oncorhynchus tschawytcha) runs in the Sacramento-San Joaquin (Central Valley) drainage were 1-3 million fish per year (Yoshiyama, et al.,1998; 2000), but in recent years runs usually have totaled less than 100,000 fish annually (Lindley, et al., 2009). There are myriad reasons why this service may be experiencing such a dramatic decline, but the social importance of salmon runs is revealed by the enormous regulatory and restoration investments being made to arrest their decline (Bernhardt, et al., 2005). In 2008 and 2009, prompted by declining runs, the lucrative commercial salmon fishing industry was shut down completely (Pacific Fishery Management Council, www.pcouncil.org/decisions/archivedecisions.html).
Wild Pacific salmon populations in California, Oregon, and Washington are in a long-term decline due to factors including overfishing, changes in ocean conditions, water quality and habitat degradation, genetic introgression with hatchery stocks, and impassable barriers to migration (Noakes, et al., 2000; Lackey, et al., 2006; Moyle, et al., 2008). The loss of holding, spawning and rearing habitat in California rivers and streams contributes substantially to the decline in provision of services provided by Chinook salmon (Yoshiyama, et al., 2001), largely related to the vast hydraulic manipulation of rivers in the Central Valley. Salmon currently are limited to a small portion of their former range, increasing their vulnerability to climate change. Both young and adult salmon are extremely sensitive to elevated water temperature and associated increases in energy expenditure that can compromise reproductive performance (Torgersen, et al., 1999).
Of particular interest are the few remaining populations of the Central Valley spring-run Chinook salmon (SRCS) evolutionarily significant unit (ESU), a species listed as threatened under both the state and federal endangered species acts. SRCS travel from the ocean to spawning sites during the peak snowmelt period of March-April, hold in coldwater pools during the hot, dry summer months, and spawn in autumn. Historically SRCS were the dominant run in the Central Valley and included 18 independent populations (Lindley, et al., 2007). Presently their distribution is limited to three watersheds with small numbers appearing intermittently in seven other watersheds where access to coldwater pools remains unobstructed. Annual SRCS runs used to number approximately 1 million fish, but they have declined to approximately 16,000 in the Central Valley.
Recently researchers have used downscaled climate data from one or more General Circulation Models (GCMs) to drive a habitat model, with the resulting data passed to a biological model (Battin, et al., 2007; Crozier, et al., 2008; Isaak, et al., 2010; Matulla, et al., 2007; Tung, et al., 2006; Yates, et al., 2008). These models fall primarily into two types of frameworks: those that use bioclimatic envelopes, and those that simulate life history. Bioclimatic models are used to estimate future habitat availability as a function of future climate predictions without specifically modeling life history. Lindley, et al. (2007) modeled the potential spatial distribution of Central Valley SRCS under different expectations of the increase in mean August air temperature; they found that some Central Valley SRCS populations disappear with as little as a 2°C increase in mean August air temperature and most populations are extirpated from historic habitat at an increase of 6°C in mean August air temperature (Lindley, et al., 2007). A similar model for Idaho mountain streams predicted that rainbow trout (O. mykiss) would have an upstream range shift, but not necessarily a loss of total available habitat, while bull trout (Salvelinus confluentus) would have an 11-20% range of available habitat contraction (Isaak, et al., 2010). Tung, et al. (2006) investigated the change in available habitat for a population of O. masou formosanus, a landlocked salmon on Taiwan Island. They report that annual average available habitat was reduced for the climate models and thermal criteria tested; available habitat during summer was reduced or eliminated entirely for most modeled scenarios.
Life history models for salmonid resilience relate life history characteristics to climate variables (water temperature, flow) or climate indices such as the Pacific Decadal Oscillation (PDO); for example, juvenile survival as a function of water temperature or state of the PDO (Battin, et al., 2007; Crozier and Zabel, 2006; Rand, et al., 2006; Zabel, et al., 2006). The relationship between climate and life history then is applied to future climate projections to investigate population response to climate change. Matrix models estimate the probability of quasi-extinction (sensu Ginzberg, et al., 1982) in populations of SRCS under climate change projections and identify stage-specific parameter relationships that might be of interest with respect to climate change (Crozier, et al., 2008; Zabel, et al., 2006). In a different model framework, Battin, et al. (2007) used the spatial population model Shiraz to characterize changes in the physical characteristics of a watershed as function of climate. They explicitly modeled effects of climate change on water temperature and flow and how changes in them affected population dynamics.
These modeling efforts have been consistent in their predictions of negative impacts of climate change on salmonids, including loss of habitat, decreased abundance, and increased risk of extinction. However, they also have called attention to the shortage of analytical frameworks that test the effectiveness of management actions to mitigate for negative effects of climate change (Bryant, 2009; Mote, et al., 2003; Wilby, et al., 2010). In a rare attempt to consider the effectiveness of management responses to climate change, Battin, et al., (2007) found that habitat restoration actions, such as changes in land use can partly offset the effects of climate change, but may not be adequate to mitigate these effects entirely. A key point here is that management responses were limited to modifying the hydrologic response of a watershed to changing climate but did not consider opportunities offered by alternative, adaptive operating regimes associated with building new or managing existing hydraulic infrastructure. For example, cold water could be stored in reservoirs for release to reduce water temperatures downstream; this cold water could be transferred to the salmon habitat via canals, forebays, and powerhouses.
Climate change scenarios for California predict warming atmospheric temperatures, reduced snow pack and snow melt runoff, and lower dry season flows (Hayhoe, et al., 2004). The hydrologic responses of a watershed to climatic forcing are the result of multiple non-linear physical processes that unfold within a system. These responses can be substantially manipulated by operation of hydraulic infrastructure that is governed by discontinuous conditional rules and agreements. The complex, non-linear nature of these systems makes it extremely difficult to understand the relationship between increasing atmospheric temperature and the future viability of salmon populations. It is even more challenging to determine what management actions might be able to mitigate for climate change effects when human population growth and other factors are having increased impacts on management of water resources (Cifaldi, et al., 2004; Field, et al., 1999; Hayhoe, et al., 2004). To address this issue, we developed an analytical framework that incorporates: 1) climate scenarios, 2) a model of watershed response to climate change, including the capacity to model water management adaptations, and 3) a model of salmon population dynamics (Fig. 1). Here, we use the framework to examine the viability of the SRCS population in Butte Creek under current management and under two relatively simple management changes within the system, across a range of climate predictions.
Geographic and Management Settings
Butte Creek (Fig. 2) is characterized by hydrologic and geomorphic conditions that provide one of the last remaining favorable habitats for SRCS, supplemented by coldwater transfers from the adjacent Feather River. The aquatic ecosystem of Butte Creek is vulnerable to climatic change because the watershed resides at a climatological margin for coldwater species. Its headwaters emanate from lower elevations within the Sierra Nevada where snow accumulation is limited. During the spring, summer, and early fall months, adult SRCS occupy approximately 17 km of holding and spawning habitat (Ward, et al., 2004): their habitat in this reach is influenced by operation of the DeSabla-Centerville hydroelectric project operated by Pacific Gas and Electric (PG&E).
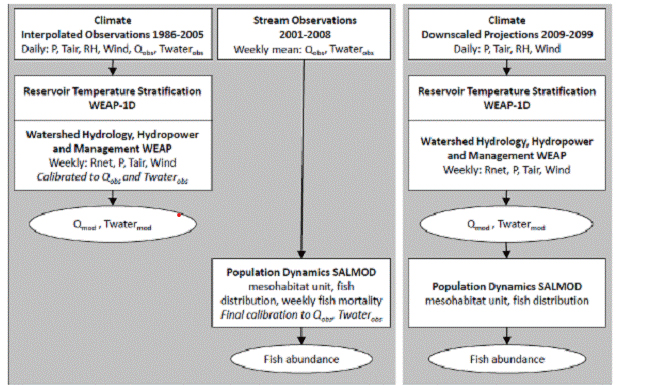
Figure 1. Assemplage of analytical framework model coupling and dta transfer, used to model historical conditions.
P=precipitatin, Tair=air temperature, RH=relative humidity, Qobs=observed streamflow, Twater obs=observed water
temperature, Rnet=net radiation, Qmod=modeled streamflow, Twater mod=modeled water temperature. Right:
Analytical framework used to model future conditions.
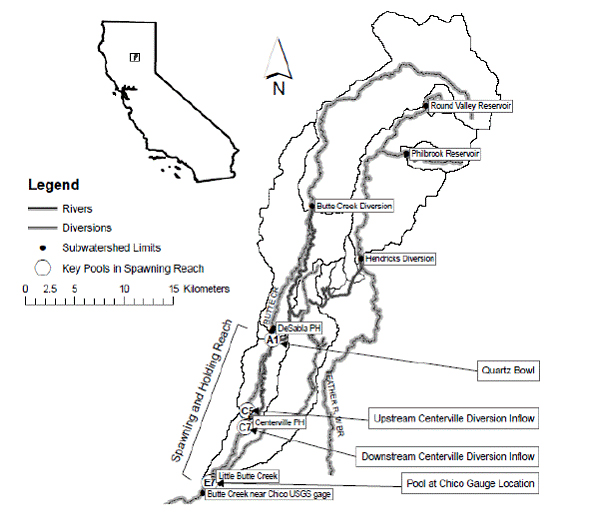
Figure 2. Location of Butte Creek watershed in California and watershed model domain with rivers,
diversions, and management points used for subwatershed and catchments deliniation. Highlighted
in white circles in the lower Butte Creek river are CDFG spring-run Chinook salmon holding and
spawning reach pools numbered as A2 (Quartz Bowl), C5 (above the inflow from Centerville Diversion)
, C7 (below inflow from Centerville Diversion) and E7 (location of USGS Chico guage). The total
length of the spawning and holding reach is 17 km, starting at Quartz Bowl and ending at USGS
Chico Gauge.
Recently the National Marine Fisheries Service issued a Biological Opinion on the Central Valley Water Project that gives numerous directives aimed at salmon recovery (NMFS, 2009). While some of the restoration actions recommended may be beneficial for SRCS, there currently is no formal management plan for Butte Creek. Most future management changes for Butte Creek are likely to come from the ongoing Federal Energy Regulatory Commission (FERC) relicensing process for the DeSabla-Centerville hydroelectric project (PG&E, 2007). At this point in time proposals include cooling the water in the DeSabla Forebay above the DeSabla Powerhouse and experimenting with different flow regimes through the holding habitat by reducing water diversion at the Centerville Diversion Dam. Other management options include intentionally managing cold water in upstream reservoirs to counteract water temperature increases in critical SRCS holding reaches. These are examples of the type of water management adaptation that can be explored through the application of the proposed analytical framework.
Task C (Conceptual Model/Food Web/Expert Panel) Introduction
The focus of this task was to: 1) document the presence of salmon consumers in the Butte Creek watershed; 2) develop a conceptual model of nutrient flows through the riparian food web; 3) trace the signature of marine-derived nutrients (δ13C, δ15N) through the food web; and 4) convene an Expert Panel to review modeling results, assess plausible implications of these results to delivery of ecosystem services in the face of salmon extirpation, and comment on the potential utility of strategies to better manage cold water resources and increase ecosystem resilience in the face of climate change.
Anadromous Pacific salmon (Oncorhynchus spp.) spend more than half their lives at sea before returning to spawn and die in natal streams. Their annual spawning migrations provide a mechanism for transporting nutrients from the fertile northern Pacific Ocean to freshwater and riparian ecosystems on the Pacific slope. In this way, salmon can deliver large quantities of marine-derived nutrients (MDN) to freshwater systems, contributing to an integrated network of nutrient pathways and cycling processes. Loss of these nutrient subsidies can have profound cascading effects on riparian ecosystems (Naiman, et al., 2002).
Stable isotopes move in predictable ways through food chains. They can be used to identify dietary sources at the base of food webs and to track these sources through successive trophic levels (Chaloner, et al., 2002). Marine sources generally are enriched in the heavy isotopes of nitrogen (15N) and carbon (13C) and can be used to trace marine inputs to freshwater systems.
Summary/Accomplishments (Outputs/Outcomes):
Work on this project progressed according to our original schedule of tasks. We did not encounter difficulties in carrying out the originally planned project. The aims of the project did not change from the original application. As noted in our Year 2 annual report, we moved the Expert Panel to Year 3, to allow ample time to write up the results of panel deliberations before the completion of the project.
Our tasks for the overall project fell into three categories:
A. Integrated Water Resource Modeling to determine habitat condition under current and future conditions.
B. Population dynamics modeling to explore the ecological role of spring-run Chinook salmon in Butte Creek.
C. Convene an Expert Panel on possible terrestrial ecosystem impacts; run alternative management scenarios with select stakeholders (management agency workshop)
In the first year of the project our tasks involved site surveys, data collection, database creation, and model development:
Task A- Butte Creek and Feather River Watershed Model
A1- Refined delineation of all sub-catchments of Feather and Butte Creek; described hydraulic and hydrologic infrastructure and water resource demands and operation; collected weekly watershed scale climate data; and began model calibration for period 1960 to 2000.
Task B- Spring-run Chinook
B1 - Assembled existing fish and habitat data for Butte Creek.
B2 - Defined additional data gathering objectives through initial field site visits and discussions with California Department of Fish and Game (CDFG) biologists; participated in CDFG field surveys to verify appropriateness of data for use in calibrating the SALMOD model.
B3 - Developed statistical relationships between observed fish occurrence within each meso-habitat unit and the habitat variables defined in those units; and developed a baseline SALMOD model of the Butte Creek spring-run Chinook life history.
Task C- Conceptual Model/Food Web/Expert Panel
C1- Began development of a site specific, conceptual model/food web diagram. Conducted literature review to prepare a target list of possible salmon consumers in the watershed; deployed motion detector scouting cameras during the spawning season to identify salmon consumers present in the watershed; and collected plant and animal tissue samples, at different taxonomic, temporal and spatial scales, for stable isotope analysis to quantify the relative importance of spring-run Chinook salmon in transmitting marine derived nutrients to the riparian community.
In the second year of the project our tasks involved model calibration and validation, scenario generation, advance awareness, fieldwork to quantify the salmon-based foodweb, and stable isotope analysis:
Task A- WEAP Butte and Feather Watershed Model
A1- Refined water quantity and quality simulations of Butte and Feather systems, including stream and reservoir simulations of water quantity and temperature. Meso-habitat defined in Task B were used as the channel reaches for WEAP model of Butte Creek. Refined water management operations in system to be sure water is being appropriately allocated and reflects hydrologic realities.
A2- Began assembling climate change scenarios that will be downscaled to the sub-catchments and aggregated to a weekly time step. Ran model scenarios for simple 2oC, 4oC, and 6oC temperature increases in WEAP and SALMOD in order to provide a preliminary test of WEAP-SALMOD climate change predictions. Acquired the more detailed California Climate Change Center scenarios (http://meteora.ucsd.edu/cap/cccc_model.html), which already are downscaled to the sub-catchment level. These will be run in Year 3.
Task B-Spring Run Chinook
B3- Based on lessons learned from statistical analysis of fish and habitat data, evaluated the appropriateness of SALMOD relationships for spring-run Chinook in Butte Creek. Where appropriate, modified SALMOD to reflect appropriate bio-dynamics; and ran and evaluated model simulations of spring-run Chinook populations.
B4- Began to extract flow and water temperature data from WEAP simulations of current and future conditions, and passed them to the SALMOD model for simulating population dynamics.
Task C- Conceptual Model/Food Web
C1- Continued deployment of motion-sensing scouting cameras during the spawning season to identify salmon consumers present in the watershed; collected plant and animal tissue samples, at different taxonomic, temporal and spatial scales, for stable isotope analysis to quantify the relative importance of spring-run Chinook salmon in transmitting marine derived nutrients to the riparian community. Analyzed plant and animal tissue samples for marine-derived nutrient (15N) content. Finalized draft conceptual model of impacts of climate change to salmon and salmon nutrient footprint (food web diagram).
In the third year of the project our tasks involved comprehensive model simulations, report writing, and project presentations:
Tasks A (WEAP Butte and Feather Watershed Model), B (Spring Run Chinook), C (Conceptual Model/Food Web)
Finalized integrated modeling results and prepared results for synthesis of expert panel. Began to develop Final Report on hydrological, fish population, and conceptual modeling; pursued opportunities to show results in public fora (including a Stakeholder Workshop) and professional meetings; Prepared and submitted manuscripts for peer review.
Task C- Conceptual Model/Food Web/Expert Panel
Conducted additional analyses of plant and animal tissue samples for marine-derived nutrient (15N) content. Held meeting of Expert Panel to review the results of all modeling to improve predictions of impacts of salmon extirpation on the terrestrial ecosystems and formulate recommendations for model testing.
In the final year of this project we conducted final comprehensive model simulations, analyzed stable isotope data, wrote our Final Report, and gave project presentations.
Tasks A, B, C
Finalized integrated modeling results. Analyzed stable isotope data. Developed final report on hydrological, fish population, and conceptual modeling; pursued additional opportunities to present results at public fora and professional meetings; and prepared and submitted additional manuscripts for peer review.
Task A (WEAP Butte and Feather Watershed Model) and Task B (Spring Run Chinook)
Description of Approach
Climate change does not act on biophysical processes in isolation from infrastructure that redistributes water spatially and temporally. Furthermore, infrastructure may provide management adaptation options. As a consequence, the analysis of management adaptations to climate change impacts on spring-run Chinook salmon in Butte Creek required linking physical, ecological, and water management processes into a single framework (Fig. 1).
WEAP Model
Our framework begins with the Water Evaluation and Planning (WEAP) system to simulate potential changes in streamflow and water temperature in response to climate inputs under a given water management scenario (Null, et al., 2010; Purkey, et al., 2007; Yates, et al., 2005a; Yates, et al., 2009; Young, et al., 2009). The WEAP hydrologic model uses an empirical, 1-D, 2-store soil moisture accounting scheme to estimate evapotranspiration, surface runoff, and sub-surface flow within a hydrologic unit, or catchment. WEAP also models snow accumulation and melt based on a temperature index formulation. For a full description of the model, the reader is referred to Yates, et al. (2005a) and Young, et al. (2009) where the algorithms for each hydrologic component are described. WEAP models physical hydrologic processes within a water management context, as opposed to the Variable Infiltration Capacity (VIC) model (Liang, 1994), for example, that simulates only hydrology (Maurer and Duffy, 2005), and from CALSIM (Water Resources Simulation Model 2000, Sacramento, CA) that describes complex operational criteria but requires hydrologic inputs as boundary conditions.
Butte Creek (512 km2 down to the USGS Chico gage) was divided into catchments with an average spatial resolution of 15 km2±15km2 (Fig. 2) and a water balance calculated on a weekly time step. We used an interpolated weather product with a spatial resolution of 12 km between 1986 and 2005 as climatic boundary conditions (Maurer, et al., 2002). Water management was modeled by assigning operating rules to system reservoirs and in-stream flows in accordance with the existing FERC license (PG&E 2007). Hydropower operations logic was based on the 1986-2005 weekly average operations composite developed for the FERC license application (PG&E 2007). We adjusted WEAP’s allocation routines in order to capture the observed operation of the DeSabla-Centerville Project.
We used PEST (Doherty, 2002) to guide calibration of snow, streamflow and water temperature parameters, minimizing the weighted sum of squared differences between simulated values and field observations. To assess model fit, we used root mean square error (RMSE) and BIAS previously used to assess WEAP model fit in Sierra watersheds (Young, et al. 2009) and added the Nash-Sutcliffe efficiency criteria (E).
For snow accumulation we compared two snow gages (Commission California Data Exchange Center (CDEC) FOR (Four Trees) and HMB (Humbug)) located in the Feather River watershed at 1570 m and at 1981 m elevation to model results at the corresponding elevation bands (i.e., 1500-1750 m and 1750-2000 m). We obtained RMSE of 0.78 and 0.84 m water equivalent, BIAS of -10% and -33%, and E of 0.76 and 0.25, respectively. Modeled snowmelt contributes 15% to total annual streamflow. Consequently, the negative BIAS in snowmelt, when considered in the context of total streamflow volume, represents an error of only -1.5 to -4.4%, which was considered acceptable.
To calibrate streamflow, we used a split time series approach in which the calibration period was 1996-2005 and the validation period was 1986-1995, focusing calibration statistics on data from June to September, the critical period for species survival. We compared the USGS Butte Creek gauge (USGS 11390000) located at the watershed outlet (a composite of natural and managed hydrology) to simulated streamflow (Fig. 3A). We obtained RMSE of 0.46 and 0.73 m3/s, BIAS of -2% and 12%, and E of 0.74 and 0.66 for the calibration and validation periods, respectively.
To assess stream water temperature we used WEAP’s internal heat balance equation (Yates, et al., 2005b) for stream segments defined by a length and a stage-discharge relationship. The water temperature in each segment is assumed to reach steady state within a time step. In all areas outside the spawning reach, all stream segments were assumed to have a single, representative cross section and flow-stage-width relationship. Within the spawning reach (A1 to E7 in Fig. 2), 40 subreaches were defined by the California Department of Fish and Game (CDFG). We further divided each subreach into a pool, riffle, and run for a total of 120 habitat units. Habitat unit stage-discharge relationships were derived from 14 cross sections and flow-stage-width relationships available from Gard (2003).
To account for water temperature stratification in upstream Philbrook Reservoir on the West Branch Feather River, we integrated a 1-D temperature model within WEAP to solve the one-dimensional heat flux equation (Chapra, 1997). The solutions were based on reservoir volume-area-elevation curves, meteorological information, flows in and out of the reservoir, and the vertical location of reservoir outflow. The routine estimates surface layer temperature of the reservoir and the energy available to warm subsurface layers; it updates the previous temperature profile once the input energy has been diffused. The routine checks for profile stability, and if dense water is overlaying less dense water, convective mixing occurs. Model parameters include: surface radiation absorption, extinction depth, and effective diffusivity. The parameters were adjusted to obtain the best fit to seven available temperature profiles measured in 2004 and 2005.
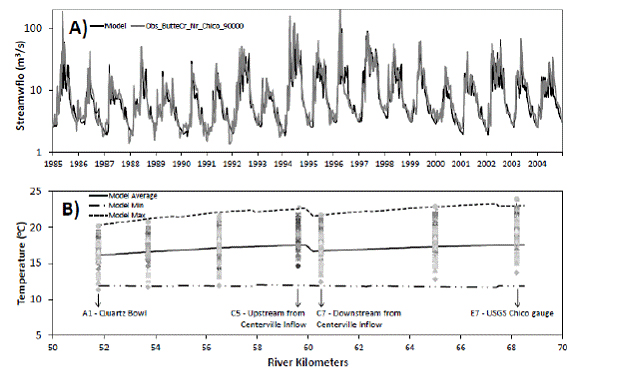
Figure 3. Streamflow and water temperature calibration. A) Observed (gray line) and simulated
(black line) streamflow for 1986 - 2005. Calibration was focustd on summer flow periods. B) Observed
(gray symbols) and simulated water temperatures (black solid and dashed lines) for spawning
reach from Quartz Bowl to USGS Chico Gauge. Calibration focused on hot summer weeks, obervations
are weekly average water temperatures available at 7 different pools in the spawning reach, and
simiulated are average, minimum, and maximum weekly average water temperatures from July
to September 2000 - 2005. River kilometers in teh x-axis refers to the distance from Butte Creek headwaters.
In catchments higher than 1750 meters above sea level, we assigned a snowmelt water temperature of 0oC. We estimated surface runoff temperature by assuming a linear relationship between runoff temperature and a lagged air temperature, with the slope, intercept and time lag serving as calibration parameters. We assigned a constant temperature to subsurface flows that was used as a calibration parameter. In order to stabilize the numerical routines for the short length scales relative to the time scales, we introduced a length scale multiplier factor that also was used as a calibration parameter. We obtained linear regression coefficients of 4.5 and 4.4, slopes of 0.3 and 0.6 and time lags of 2.4 and 3.4 weeks for the runoff/air temperature relationship in Butte Creek and the West Branch Feather River, respectively. We also obtained 17oC as the subsurface temperature and a reach length factor of 3.7 with 95% confidence interval of 3.05-4.42. With this calibration, we obtained a reasonable upstream-downstream water temperature profile in the habitat reach (Fig. 3B) as compared to observations with a RMSE range of 0.09 to 0.14oC, BIAS range of -0.02 to -0.10 and an E range of 0.36 to 0.49.
WEAP outputs weekly mean water flow and weekly mean water temperature to a csv file, which is modified manually in Excel into the format required by the salmon population dynamics model, then used as an input data file for that model.
SALMOD Fish Population Dynamics Model
Our framework continues with SALMOD - a population dynamics model that simulates the freshwater life stages of the salmonid life cycle including threshold effects on survival in response to environmental conditions (Bartholow, 1996). It is deterministic, spatially explicit, operates on a weekly timestep, and relates stage-based demographic parameters (e.g., growth and mortality) and biological processes (e.g., migration and spawning) to habitat units and climatic variables (e.g., water temperature and flow) (Bartholow, et al., 1993). For a full description of the model, see Bartholow, et al. (2002). We chose SALMOD because it has been used in other California watersheds (Bartholow, 2004; Bartholow and Heasley, 2006; Campbell, et al., 2010), making it familiar to local water managers. In addition, SALMOD’s basic features include the ability to model SRCS distribution across the 120 habitat units, which was important because in most years SRCS were concentrated in the upstream habitat units. SALMOD’s ability to model multiple life stages also was important, because we wanted to investigate adult over-summering mortality, egg mortality (in vivo and in situ), and juvenile mortality, and we did not have an a priori way to determine the life stage that would be most affected by climate change. Additionally, starting off with a framework designed for the complete freshwater life history allows for future research to include other life history stages in a relatively seamless manner.
SALMOD requires an input file with parameters for each age class of salmon. For example, for adult salmon this includes a water temperature-mortality relationship, base mortality, density-related mortality and movement, length:weight regression, weight:fecundity regression, sex ratio, spawning habitat capacity, and water temperature-based timing of spawning. Parameter estimates were obtained from agency reports, primary literature, and books, and previous SALMOD implementations. We included parameters for all age classes in SALMOD in model calibration, but because of the strong influence of adult summer mortality on population persistence, model results were largely insensitive to parameters for other age classes. The SALMOD model code files used for the analyses are included in our products submitted.
Preliminary model runs indicated that in many instances few adult SRCS survived the over-summering period in order to spawn, making conditions for in situ egg survival and juvenile survival less relevant, and indicating that the temperature-mortality relationship for over-summering adults was critical to our SALMOD calibration. We estimated a relationship based on field data specific to Butte Creek SRCS. Eight years (2001-2008) of overlapping data from pre-spawn carcass surveys, summer snorkel surveys, spawner abundance estimates, and water temperature data from 6 of the 40 CDFG reaches were used (Garman and McReynolds, 2009; Ward, et al. 2004; California Department of Fish and Game, unpublished data). Rather than applying a constant temperature across all intermediate habitat units (stream segments) as has been done in some previous SALMOD implementations, a linear interpolation was performed so that temperature would gradually change between points of known temperature. Fish were spatially distributed in SALMOD each calibration year according to the estimated spatial distribution from the annual snorkel survey. The total number of fish in the system each year was based on estimated number of spawners, and pre-spawn mortality for that particular year. The water temperature-mortality relationship for summer holding adults was described by a logistic function, similar in its final form to that used by Baker, et al. (1995). The logistic function was chosen because it is a natural model for dose-response relationships, such as temperature and mortality rate, where weekly mortality rate is bounded by 0 and 1. The relationship was calculated within SALMOD using the PEST PAR2PAR routine (Doherty, 2002) and was achieved by minimizing the sum of squared error between annual modeled mortality versus annual observed mortality. The resulting temperature-mortality relationship (Fig. 4A) had parameter estimates (95% confidence intervals) α = 115.08 (100.178, 129.982) and β = -5.421 (-5.99, -4.86), respectively. The most sensitive range of weekly mean temperature lies between 20°C and 22°C, which is consistent with values found in the literature (see review in McCullough, 1999). However, it should be noted that this temperature-mortality relationship may be specific to Butte Creek SRCS, since it implicitly incorporates the effects of Butte Creek-specific water flow (including the instream flow requirement above the Centerville Powerhouse), the weighted usable area of each habitat unit, the spatial distribution of the SRCS in the years for which historical data were available, and any disease-related mortality that may have occurred.
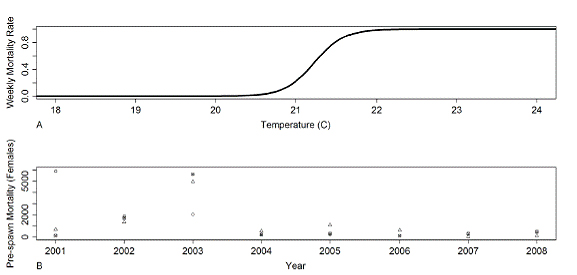
Figure 4. SALMOD Calibration: A) Water temperature-mortality relationship based on Butte Creek
spring-run Chinook salmon data (2001 - 2008), using weekly mean temperature ane weekly mortality,
B) Comparison of observed summer pre-spawn mortality (2001 - 2008) (squares), simulated
mortality using observed weekly mean flow and water temperature data (2001 - 2008) (triangles),
and simulated mortality using WEAP-simulated weekly mean flow and water temperature data
(2001 - 2005) (circles).
(2001 - 2005) (circles).
We could have calibrated SALMOD using either mean or maximum weekly water temperature. We chose to use the mean because we were concerned that prolonged warm periods would stress fish and increase their metabolic rates (and in the case of juveniles, food requirements). A few hot days followed by cool nights may have been less likely to cause mortality than a sustained period with days almost as hot, but followed by warm nights. It also was not clear whether the weekly mean, weekly mean of daily maximums, or the weekly maximum would be the most appropriate metric to use, because each potentially could play a role.
We calibrated SALMOD to annual estimates of adult pre-spawn mortality from pre-spawn carcass surveys. We attempted to calibrate SALMOD using two different habitat data sources: 1) observed water flow and observed water temperature, and 2) modeled water flow and observed water temperature generated by WEAP for the five years when historical climate forcing data overlapped the eight years of ecosystem observation data (2001-2005). During the summer months water flow varied little in the upstream half of the SRCS holding area, due to the minimum flow requirement of 1.13 m3/s that applies during this period between DeSabla Powerhouse and Centerville Powerhouse, where the majority of SRCS hold. As a result, water temperature dominated the SRCS pre-spawn mortality calibration. The modeled water temperature captured the overall structure of the historical temperature data well, and the modeled data displayed reasonable accuracy and bias across the summer season, as well as across years. However, modeled water temperature differed from observed by ±2oC in a few key weeks (week 27 of 2001, and week 29 of 2003) reducing the SALMOD performance in simulating adult pre-spawn mortality. For comparison, we present the observed salmon mortality and the simulated salmon mortality 1) using observed flow and water temperature data and 2) using modeled flow and water temperature data (Fig. 4B).
SALMOD clearly performs better when observed environmental data, rather than when data modeled using WEAP, are used to guide the calibration. To evaluate model fit, a linear regression of model output (X) on observation data (Y) of the form Y = A + BX was created. The coefficient of determination, or R2, had a value of 0.9252 for the observed historical climate data, but R2 = 0.0017 for the WEAP-generated historical data. The regression estimates for A and B would equal 0 and 1, respectively, if model predictions perfectly matched observations. When this is not the case, differences between model output and observed data are due to unexplained variance rather than to a systematic bias or inconsistency (Pineiro, et al., 2008). Use of observed environmental data yielded P-values for the tests for intercept and coefficient of 0.338 and 0.21, respectively, suggesting that SALMOD provides an adequate prediction of adult salmon summer mortality based on observed spawner abundance and spatial distribution, water temperature and flow. We opted to calibrate SALMOD based on observed water flow and water temperature data, and, by necessity, to use model output as the unknown environmental conditions under future climate scenarios. This gave us a salmon model that is calibrated to have the best possible fit to historical conditions.
Given the errors inherent in the WEAP calibration, we acknowledge that a number of factors may reduce the accuracy of our predictions. (1) In any particular year of the future scenarios, modeled water temperatures may not be perfectly accurate, so the salmon survival may be under or overestimated. (2) Climate scenarios currently available may not accurately reflect future climate, particularly if emissions continue to exceed those in any of the available scenarios. (3) Over the 90-year timeframe of our predictions, other factors not included in this modeling exercise, such as ocean conditions, may have large climate-related impacts on adult salmon survival before their return to freshwater to spawn. Nevertheless, modeled long-term trends in salmon survival should be representative, as should the effects of management actions undertaken to decrease temperatures given WEAP’s ability to accurately capture broader trends in water temperature. This is because the key aim of our research was to identify environmental tipping points beyond which salmon could go extinct, not the exact year in which this would occur.
To model effects of future climate and management actions on the summer survival of adult SRCS we used the parameter set from the SALMOD calibration based on observed environmental data. Because SALMOD does not include an ocean habitat component to calculate the number of returning adults for a given cohort, we seeded the system each year with 15,000 holding adults, the approximate annual spawner abundance in the last decade. It should be stressed that this accommodation likely causes our results to over-predict the time that salmon will persist. Also, in the historical dataset the initial spatial distribution of adult salmon along the creek is quite variable from year to year. We have no way to know what initial distribution would occur in the future. Therefore, we used the mean initial spatial distribution from the eight years of historical data (2001-2008) as the initial distribution in all future scenarios.
Implementation of Analytical Framework for Future Climate Scenarios and Management Adaptations
Our experimental design relied upon identification of a set of GCMs run under a pair of emission scenarios that would allow for estimation of the uncertain fate of SRCS in the system. While this approach is not sufficient to characterize the probability of any potential future state of the system, it provides a first estimation of system vulnerability to progressive climate change while considering possible changes in the hydrologic regime (e.g., change time and duration of dry periods) over the course of the entire 21st century. We used multiple GCMs and emissions scenarios because we had no a priori method to know how variable their predictions would be for the Butte Creek watershed, nor which would be most accurate. Our intention is to show that the group of models and scenarios we used provide a reasonable “predictive envelope” of the future climate.
We used 6 GCMs (cnrmcm3, gfdlcm21, microc32med, mpiecham5, ncarccsm3 and ncarpcm1) that have been selected for California’s 2008 Climate Change Impact Assessment (http://meteora.ucsd.edu/cap/scen08.html) and two emission scenarios, A2 and B1 (IPCC 2007), for the analysis. Downscaling to the Butte Creek system was accomplished using the bias correction and spatially downscaling method (Maurer and Hidalgo, 2008), which generated continuous daily fields of key climate variables on a 12 km x 12 km grid scale over the system. This method uses statistical transformations to match observed climate data to outputs from GCMs during the historical period that then are applied to future climate projections. These daily values were converted to weekly averages for use in WEAP. There is a general consensus among models that conditions in Butte Creek will become drier and hotter over the course of the 21st century with obvious negative implications for SRSC in the system (Cayan, et al., 2008).
In order to assess the vulnerability of the system under these potential climate futures, the Butte Creek WEAP application was first run assuming that current management arrangements remain in place. Having established baseline vulnerability, three simple management adaptations were considered: (i) eliminate the diversion of water from Butte Creek at the Centerville diversion dam during the critical July-September holding period, with all flow in the creek released into the SRCS summer holding reaches, (ii) release water from Philbrook Reservoir from the warm top layer prior to week 30 (July 23-29) and after week 40 (October 1-7) while releasing from the cooler bottom of the reservoir between these dates (in actuality releases currently are possible only from the bottom of the reservoir); and (iii) combine adaptations 1 and 2. Options 1 and 3 result in loss of power generation from Centerville Powerhouse. Neither current nor upcoming climatic conditions nor the actual water temperature conditions in critical reaches of Butte Creek were used to condition these management actions.
These changes in operations (adaptations) are being considered as part of ongoing FERC relicensing of the DeSabla-Centerville Project, based on recognition that even under historical climatic and hydrologic conditions, SRCS in Butte Creek are vulnerable to water temperature conditions in excess of critical thresholds during the summer holding period. One potential advantage of the current analysis is the focus on understanding how these adaptations may perform under future climatic and hydrologic regimes that depart from conditions observed in the recent historical past.
Climate Scenario Analysis
Weekly mean precipitation, air temperature and wind speed for the 12 GCM-emission scenario combinations for the 2009-2099 period were used in the WEAP model. Streamflow predictions were made for June, July and August (JJA) and December, January and February (DJF) for three periods (2009-2034, 2035-2069, and 2070-2099). These predictions indicate that, although some scenarios may have greater streamflow in the winter, all scenarios have a 20-50% reduction in summer streamflow (black bar in Fig. 5A) for the 2070-2099 period relative to historical averages. Summer water temperatures are predicted to increase 2-5oC for the 2070-2099 period, relative to historical averages (Fig. 5B). This range of variability in the results highlights the inherent uncertainty of this sort of analysis and the need to evaluate a range of plausible future conditions.
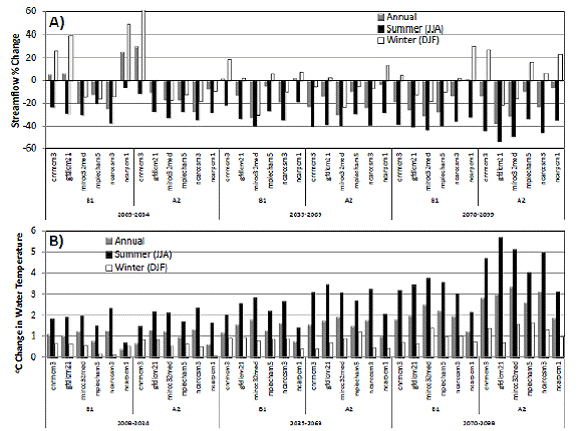
Figure 5. Simulated (A) streamflow and (B) water temperature change for periods 2009 - 2034, 2035 - 2069
and 2070 - 2099 for six General Circulation MOdels under A2 and B1 greenhouse gas emission scenarios,
relative to 1986 - 2005 historical averages for annual (10 m3/s, 11ºC), summer (6 m3/s, 18ºC) and winter
(15 mm, 5ºC) simulated streamflow and water temperature, respectively. The 30 year mean changes
are shown for visualization; weekly mean streamflow and water temperature was actually generated by
WEAP and passed to SALMOD. For detailed explanations of the greenhouse gas emissions scenarios
we refer readers to IPCC (2007, Figure 3.0) and for information regarding the General Circulation Models,
to the California Applications Program / California Climate Change Center website on California's 2008
Climate Change Impact Assessment.
To observe the spatial effect of these climate scenarios throughout the spawning reach we plotted the aggregated water temperature distribution of all six A2 scenarios and all six B1 scenarios for pools A1, C5, C7 and E7 and compared them to the historic modeled temperature distribution (Fig. 6). These box plots represent the range of uncertainty. The results indicate a consistent increase in temperature in all pools for the analyzed climate scenarios. The increase in the median rises linearly from 1.42 to 2.33oC from pools A1 to C7 for A2 scenarios and from 1.04 to 1.65oC for B2 scenarios.
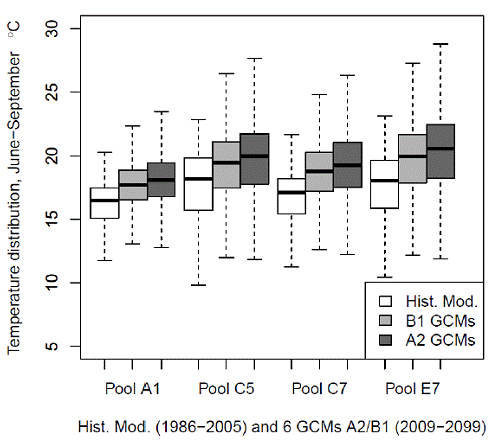
Figure 6. Water temperatures predicted for six General Circulation Models under A2 and B1
greenhouse gas emission scenarious (distribution of all General Circulation Models for
2009 - 2099 are graphed together for each scenario and pool) and historical modeled
(1986 - 2005) weekly average water temperature distribution for weeks 24-39 for pools A1, C5,
C7 and E7.
We defined SRCS extinction as four consecutive years of zero pre-spawn survival of adult salmon. Because most Butte Creek SRCS spawn at three and four years of age (McReynolds, et al., 2007), after four years in which no adults survive to spawn there would be no fish alive to return from the ocean to reproduce. We reiterate that this survival rate is based on an initial seeding of 15,000 adult salmon each year, because of the inability of SALMOD to estimate the number of returning adults for a given cohort. This prevented us from allowing population declines to accumulate over years, suggesting the population extinction is likely to occur before there are four consecutive years of simulated zero pre-spawn survival. For three of the six B1 scenarios, salmon were able to survive the full 90-year simulation without meeting the extinction criterion, whereas none of the A2 scenarios saw salmon survive for the full 90-year simulation. The shortest time to extinction was 49 years and occurred for the A2 cnrmcm3 model-scenario combination. There is a distinct difference between the extinction times predicted by the A2 and B1 emission scenarios, averaging 63.5 and 84 years, respectively (Fig. 7).
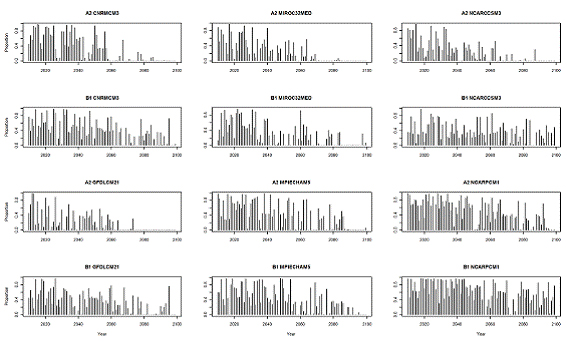
Figure 7. Proporation of adult salmon that survived the freshwater summer holding period, predicted
for six Generational Circulation Models under A2 and B1 greenhouse gas emission scenarios for
2009 - 2099. Salmon were assumed to be extirpated when there were four consecutive years with
no adult summer survival.
There is considerable variation and uncertainty among predictions for the 12 GCM-emission scenario combinations in terms of the proportion of adult salmon that survived the freshwater summer holding period and spawned each year, ranging from years where most fish survived the summer to years where no fish survived (Fig. 7). Over the full 90-year simulation the average proportion of fish that survived to spawn each year was similar for the A2 and B1 emission scenarios, 0.29 and 0.39, respectively. When counting only years in which there were surviving fish, these values increase to 0.43 and 0.46, respectively.
Management Adaptation Analysis
To observe the spatial effect of the management adaptations throughout the spawning reach, we plotted the aggregated water temperature distribution of all 12 GCM-climate scenario combinations for each management adaptation for pools A1, C5, C7 and E7 and compared them to the aggregated temperature distribution of all climate scenarios for business-as-usual (baseline) management (Fig. 8). The temperature distribution is a range that represents the uncertainty of all 12 GCM-emission scenario combinations. The results indicate slight decreases of <0.01oC in water temperature for all quartiles of all management adaptations in pools C7 and E7. Management adaptation 1 and management adaptation 3 indicate a reduction in the median temperature in pool A1 of 0.2-0.3oC and a reduction in the median temperature in
pool C5 of 0.8-1oC.
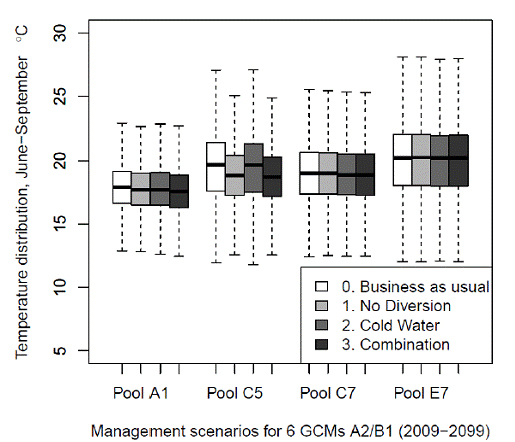
Figure 8. Water temperatures are predicted for six General Circulations Models under A2 adn B1
greenhouse gas emission scenarious and three management adamptations: 1-no diversion, 2-cold
water savings, and 3-combination of both The data for the twelve model and climate scenario
combinations for 2009 - 2099 are graphed together for each pool A1, C5, C7 adn E7.
Y-axes show weekly average temperature distrubution for weeks 24 - 99.
Across the 12 GCM-emission scenario combinations, management adaptation 1 increased the estimated time to extinction of salmon by 0 to 17 years over the respective baseline values (Fig. 9). The mean increase in time was 4.75 years (for all comparisons we considered all 12 model-climate scenario combinations, including those where salmon survived to 2099). Management adaptation 2 was not effective for any of the 12 model-climate scenario combinations and in fact in some cases made extinction occur sooner. The range of changes in extinction time was 0 to 6 years sooner. The average change in extinction time was 0.58 years sooner. For management adaption 3 the range of changes to extinction time are from 1 year sooner to 17 years later. The mean change in extinction time was 3.4 years later. The effects of management adaptations 1 and 2 appear to be cumulative in management adaptation 3, with any net benefit being caused by management adaptation 1. Management adaptation 2 appears to be counter-productive.
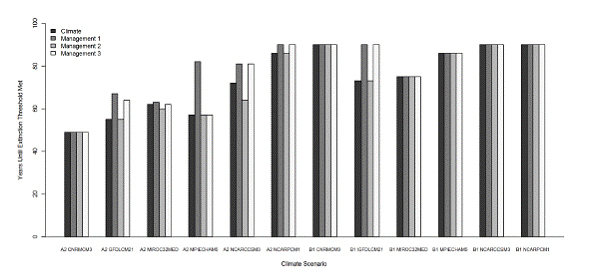
Figure 9. Survival time of spring-run Chinook salmon in Butte Creek predicted by SALMOD for six
General Circulation Models and A2 and B1 emission scenarios, for the baseline climate change case,
and three management adaptations. Model was run for 90 years (October 2009 - September 2099).
The management adaptations changed the proportion of adult salmon that survived to spawn each year over the duration of the simulation (Fig. 10). For management adaptation 1, there was a mean increase of 0.52 (range: 0.32 to 0.64), with emission scenarios A2 and B1 having similar mean values of 0.51 and 0.52, respectively. As was the case for extinction time, management adaptation 2 was ineffective in improving survival of fish. It had a mean proportional decrease of 0.08 (range: -0.04 to -0.12), with emission scenarios A2 and B1 having similar values of 0.08 each. Management adaptation 3 had a mean proportional increase of 0.42 surviving fish (range: 0.30-0.53). The A2 and B1 scenarios had similar mean values of 0.41 and 0.43, respectively.
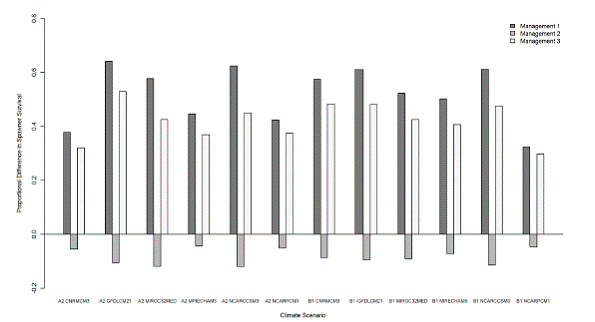
Figure 10. Proportional difference in annual survival of spring-fun Chinook salmon in Butte Creek
predicted by SALMOD for six General Circulation Models adn A2 and B1 emission scenarios, for
the three management adaptations, relative to the baseline and climate change case.
Costs to Other Ecosystem Services: Example of Hydropower
While management adaptation 1 resulted in cooler water temperatures, more successful spawning, and extended population survival time, this came at the expense of a reduction in hydropower production on the order of 10-20% annually (Figure 11). Although management adaptation 2 did not reduce hydropower production, it did not dramatically improve fish survival either. These results imply that management options available with current infrastructure would need to be fine tuned to obtain the maximum benefit from power production while significantly reducing spring-run Chinook salmon vulnerability.
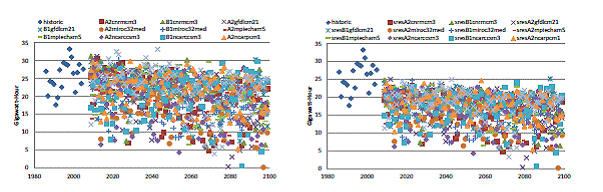
Figure 11. Total Annual Hydropower Production by Centerville PH for historic conditions (1985 - 2005;
dark blue symbols). A. The business as usual and cold water storage management options continue
diversion of water for hydropower; however climate scenarios indicate a reduction in hydropower
production due to low water availability. B. Ceasing the diversion of water during summer weeks decreases
hydropower further than do climate scenarios alone.
Uncertainty in the Analyses
Each of the components in the analytical framework contributes unique errors and uncertainties that have implications for our results. This raises the issue of how best to represent uncertain future climate conditions in the framework. Key sources of uncertainty at this stage of the analysis are model inputs and parameter choices (Van Asselt and Rotman, 2002). We worked from the premise that a method is useful if it produces a plausible set of expectations about what is an inherently uncertain future and also is appropriate to the question at hand. This was the standard used to select a set of climate projections used to derive insights on the possible trajectory of SRCS in Butte Creek.
Uncertainty in precipitation and air temperature input data obtained from GCMs and emission scenarios translates into greater uncertainty in the climate and management predictions we generate. Given the wide variability of possible future scenarios, our approach to incorporating this uncertainty in our analysis was to run multiple GCMs and two emission scenarios, in order to generate a comprehensive ensemble of potential future climates. By selecting this approach, our future projections provide a range of possible responses of the system to climate and to potential management adaptations.
The set of parameters used to calibrate models for historic conditions have ranges of uncertainty provided by the confidence intervals found during calibration. These parameters may change in the future; however, it is not possible to know how they will change, and consequently, using them for estimates of future fish abundance adds additional uncertainty to the predictions. In the future, the spatial distribution of adult SRCS along Butte Creek may differ from past observations. We explored how sensitive the model results are to uncertainty in this distribution. Using the most extreme GCM-climate scenario combination (A2 cnrmcm3), we bootstrapped from our known spatial distributions to create 20 different fish distributions. After inspection of the output, it appeared that only 3 of the 20 scenarios resulted in extinction at the same time as the initial simulation, while in the rest the salmon made it to the end of the 90-year simulation. However, if the threshold criterion for determining extinction is increased from 4 consecutive years of zero surviving fish to 4 consecutive years of 20 or fewer fish, all 20 bootstrapped scenarios are consistent in that extinction occurs at the same time as in the initial simulation. A re-inspection of the initial scenario showed that the same extinction time is predicted by a minimum threshold population size of 20 fish as when the threshold is at 0 fish for all 12 GCM-climate scenario combinations. This result indicates that model performance is relatively robust with respect to the spatial distribution used. Furthermore, the most upstream habitat unit always will be the coldest, so, assuming that some SRCS will always hold in this habitat unit, the year of extinction for a given model run will depend ultimately on water temperature in this unit. The spatial distribution of fish in other habitat units, and the temperature gradient along the creek, will affect the abundance trend over years of the simulation, but when no SRCS adults can survive the summer in the upstream habitat unit, all SRCS adults in all other units would also not survive.
Ecosystem modeling must make simplifications relative to the complexity of the real world. Our models were simplified by the exclusion of processes such as hyporheic flow, potential pool stratification, changes in channel morphology or land use, ocean conditions, fish disease dynamics, and metapopulation dynamics between Butte Creek and other SRCS watersheds. However, because these factors would have both positive and negative effects on abundance, we made the assumption that any resulting errors would cancel each other out. Excluding some relevant processes from the analytical framework increases uncertainty in model predictions, although we suspect changes in fact would be small. The analytical framework may be improved by adding one or more of these influences, but at the cost of increased complexity and reduced comprehension of results.
Task C (Conceptual Model/Food Web/Expert Panel) Introduction
Methods
We assembled data on the Butte Creek ecosystem and identified possible consumers of spring- run Chinook salmon (SRCS) (Task B1) through review of California Department of Fish and Game reports, peer-reviewed literature, and the Pacific Gas and Electric (PG&E) studies conducted on Butte Creek for the recent Federal Energy Regulatory Commission (FERC) relicensing of the Butte Creek hydropower project DeSabla-Centerville Project. However, some of the PG&E-sponsored studies had been cancelled prior to our review, creating substantial information gaps for a variety of taxonomic groups. We attempted to fill some of these gaps through additional field surveys. We also collected field samples for stable isotope analysis as part of our effort to augment the secondary data available for the Butte Creek food web.
Camera Traps
To identify possible spring-run salmon consumers, we placed motion sensor cameras (Moultrie Game Spy® 4.0, StealthCam Sniper Pro®, Trailmaster® 1500) at salmon-baited camera trap stations at spawning sites. We installed 9-12 cameras, spread among three main locations along the creek where we had access and salmon carcasses were available to bait the traps. We monitored these traps at regular intervals and amassed a large collection of digital photographs of animals that were attracted to the carcasses. These data allowed us to confirm the presence of certain species, but they did not rule out the presence of other species. Presence of an animal near a carcass did not necessarily imply that the animal was consuming salmon-derived nutrients; we relied on nutrient isotope data for this information.
Stable Isotope Analysis
To source and track marine-derived nutrients in Butte Creek’s riparian food web, we compared δ15N and δ13C stable isotope ratios in selected organisms at spawning sites (subreach C2) and at control sites above barriers to salmon migration (Forks of the Butte). Our aim was to estimate the extent of the nutrient subsidy provided to the Butte Creek food web by SRCS. Following designs in the peer-reviewed literature, we compared the amount of marine-derived nitrogen and carbon isotopes originating from salmon carcasses with the same nutrients present in different components of the food web (such as aquatic algae, terrestrial plants, aquatic and terrestrial invertebrates, amphibians, bird feathers, small mammals, and bear fur). We compared stable isotope values sampled from organisms in the lower section of Butte Creek, where Chinook salmon are present, with stable isotope values sampled from the same suite of organisms in an upstream section of Butte Creek to which SRCS do not have access due to the presence of a waterfall and dam. Samples were collected prior to and during the spawning period 2008-2010. Plant and animal tissues (plant and animal muscle tissue, whole bodies, hair, and feathers) were collected using a variety of established sampling methods. To compare different routes and outcomes of nitrogen uptake, plant samples were collected from both nitrogen-fixing plants (Alnus rhombifolia) and non-nitrogen fixers (Salix spp., Vitis californica, Quercus wislizenii, Heteromeles arbutifolia, and Darmera peltata). Samples were dried, homogenized, and encapsulated, then analyzed for δ13C and δ15N (enriched relative to nonmarine sources) using an elemental analyzer interfaced to a continuous flow isotope ratio mass spectrometer (IRMS) at the UC Davis Stable Isotope Facility (http://stableisotopefacility.ucdavis.edu/). Feather and hair samples were soaked in ethanol prior to drying and encapsulation. Lipid extraction was not performed on salmon tissue prior to analysis. We analyzed 3-5 replicates per sample, based on results from other peer-reviewed studies. Paired statistical comparisons were made between δ15N and δ13C stable isotope ratios for similar taxonomic groups in the upper versus lower locations. Our results allowed us to estimate which organisms in the food web contained nutrients derived from SRCS (obtained either directly, or through an indirect path through the food web). Results allowed us to test the hypothesis that organisms in locations with SRCS contain significantly more marine-derived nutrients than organisms where salmon are not present.
Expert Panel
We assembled a team of local and regional experts in Pacific salmon ecology, conservation, and economics to convene at UC Davis for 3 days to review modeling results, assess plausible implications of these results to delivery of ecosystem services in the face of salmon extirpation, and comment on the potential utility of strategies to better manage cold water resources and increase ecosystem resilience in the face of climate change. The event also included an opening-day field trip to the Butte Creek watershed to orient the panelists to the ecosystem and to facilitate informal conversation amongst the participants. Several of the panelists were leading researchers from the Pacific Northwest where studies on the ecological and economic value of Pacific salmon are far in advance of what we know for California systems.
Results
Camera Traps
A variety of organisms were photographed at camera traps (Fig. 12), including (clockwise from top left) turkey vulture (Cathartes aura), ringtail (Bassariscus astutus), black bear (Ursus americanus), and mule deer (Odocoileus hemionus). While many individuals appeared to be drawn to the carcasses and were, in many cases, consuming them, bears and turkey vultures were major consumers. Bears preferred the carcasses to be as fresh as possible, while turkey vultures were less particular, aggregating in large groups to clean up the older carcasses. Based on
analysis of the photographs, we added newly species not commonly known in the watershed, such as the ringtail cat (Bassariscus astutus) to our food web/conceptual model.
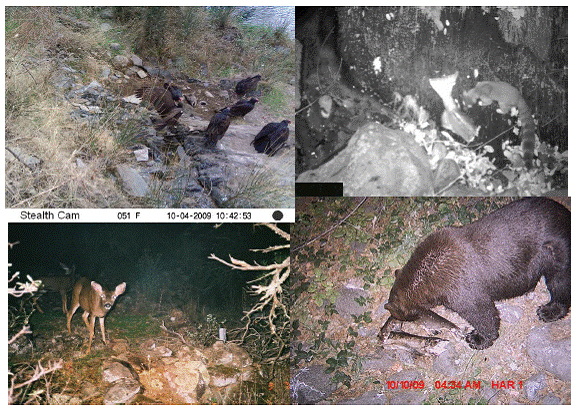
Figure 12. Species photo-captured at salmon baited camera traps
Conceptual Food Web Model
Relying on the literature and results from camera traps, a generalized, functional taxonomic group-based conceptual model of nitrogen cycling in a hypothetical stream system receiving salmon-delivered marine subsidies was developed (Fig. 13) to provide a basis for inquiry and hypothesis generation. This model represents a first pass at identifying the various and complex nutrient pathways possible in the Butte Creek riparian food web.
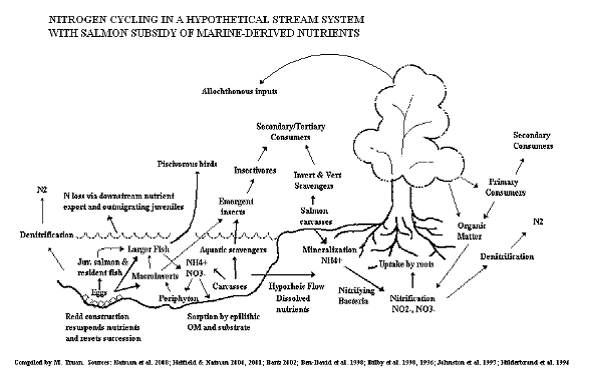
Figure 13. Diagram depicting nitrogen cycling in a hypothetical stream system subsidized by
salmon-derived nutrients. As this diagram indicates, salmon deliver large quantities of marine-
derived nutrients to freshwater environments, supporting numerous other organisms in an
integrated network of nutrient pathways and cycling processes.
Stable Isotope Analysis
In general, we found that samples from spawning sites were more enriched in 15N compared with samples from above-barrier control sites (Table 2). 15N enrichment values were similar to those reported in the literature (Peterson and Fry, 1987). Not surprisingly, the insect larvae (maggots) that consume and decompose salmon carcasses showed the highest MDN enrichment values overall (Fig. 14). Black bear (and turkey vulture) δ15N and δ13C values also were extremely high. We lacked above-barrier data for turkey vultures, so only data from the spawning sites are indicated. However, because turkey vultures are highly mobile it is impossible to parse out differences between spawning and non-spawning sites anyway. We lacked the resources to formally sample for bears and so relied on opportunistic sampling of bear hair from scratching trees in the spawning reach. We were unable to find bear hair samples from the upstream control site so we compared hair samples collected from the spawning reach before and after the spawning season. We found that %MDN in bear hair samples increased an average of 43% between the onset and the end of the spawning season, suggesting a significant consumption of salmon tissue during this time. Other taxonomic groups (i.e., epilithic biofilm, aquatic invertebrates, and California newt (Taricha torosa)) also showed significant enrichment in MDN compared with organisms collected at the control site. Interestingly, δ15N values for deermice (Peromyscus spp.) fell within the range for invertebrates, suggesting that they were consuming insects enriched with salmon nutrients. They also may be consuming salmon carcasses directly. More work is needed to follow up on these intriguing results. As expected, riparian vegetation had the lowest enrichment levels overall. However, contrary to expectations (Naiman, et al., 2009), 15N enrichment in plants differed little between spawning and above-barrier control sites. Reasons for this are unclear though may reflect differences in historical or baseline productivity above and below the barrier to salmon migration.
Results for 13C were mixed (Table 2). Diet is the primary determinant of δ13C composition in heterotrophs, though some slight enrichment (~1‰) occurs through trophic transfer (Peterson and Fry, 1987). Most of the samples from spawning sites were 13C enriched relative to above-barrier sites, suggesting that organisms were consuming a MDN-enriched diet in spawning reaches. Contrary to expectations however, 13C enrichment values for newts and deermice were significantly greater for above-barrier sites. The reason for this is unclear and requires further sampling and analysis. It could reflect diet-switching toward higher-order prey in salmon-deprived sites.
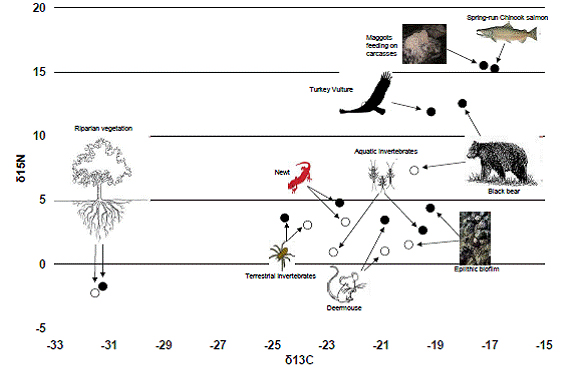
Figure 14. Biplot of δ13C adn δ15N values in tissues of sampled organisms taken from spawning and
above-barrier sites. Closed circles are mean values for spawawning sites; oipen circles are mean values
for above-barrier sites (located above a waterfall barrier to salmon migration). For bears, the open circle
represents mean copositio prior to the spawning season and the closed circle is mean comnposition
at the end of the spawning season. In most cases, open circles plot lower than closed circles, indicating
that orgniasms from sites above the barrier to salmon migration were less enriched in MDN than similar
taxa at spawning sites. Groups that plot together are generallyt more similar in their dietary composition.
Expert Panel
We held the Expert Panel Workshop on June 15-17, 2010. We currently are developing a manuscript based on the results of the stable isotope study and expert panel proceedings.
Media Coverage of Project
1. A delicate balance: Hydropower and salmon in a changing climate. Marion Davis, Stockholm Environment Institute – News and Media. Aug. 23, 2011. http://www.sei-international.org/news-and-media/2057.
2. Q&A: David Purkey on Chinook salmon, hydropower, and tradeoffs. Marion Davis, Stockholm Environment Institute – News and Media. Aug. 23, 2011. http://www.sei-international.org/news-and-media/2057.
3. Warming streams could be the end for salmon. Andy Fell, UC Davis News and Information. Sept. 1, 2011. http://www.news.ucdavis.edu/search/news_detail.lasso?id=9996.
4. Salmon, climate change, and effects of water management adaptations. Interviewed by Cynthia Elkins, KMUD Redwood Community Radio. Sept. 2, 2011. http://kmud.org/.
5. Salmon, climate change, and effects of water management adaptations, Sept. 7, 2011, Interviewed by Joe Rubin, Capital Public Radio. http://www.capradio.org.
6. Fish in hot water pose tough dilemma. Blog by Andy Extance. Sept. 10, 2011, http://simpleclimate.wordpress.com/2011/09/10/fish-in-hot-water-pose-tough-dilemma/.
7. Is the End of Salmon Near? Chinook salmon could vanish from rivers by the century's end, models show. Sept. 14, 2011, Blog by Emily Sohn, Discovery News. http://news.discovery.com/animals/salmon-climate-change-rivers-110914.html.
8. Climate Change Threatens California Salmon. Capital Public Radio. Oct. 13, 2011. http://www.capradio.org/articles/2011/10/13/climate-change-threatens-california-salmon.
9. Researchers Find Salmon Vital To Biodiversity in California. Capital Public Radio. Oct. 27, 2011. http://www.capradio.org/166264.
10. Will Busting Dams Boost Salmon? Science "News Focus" article by Robert F. Service. Science 18 November 2011: Vol. 334 no. 6058 pp. 888-892. DOI: 10.1126/science.334.6058.888. Water-salmon-climate modeling project noted in sidebar "Out of the Frying Pan". http://www.sciencemag.org/content/334/6058/888.summary.
Conclusions:
Task A (WEAP Butte and Feather Watershed Model) and Task B (Spring Run Chinook)
Discussion
We have assembled an analytical framework linking climate data, a watershed hydrology model, water management, and salmon population dynamics, and applied it to SRCS in Butte Creek. Given the availability of historical data we were able to calibrate the WEAP and SALMOD models to fit historical records of flow, water temperature and over-summer adult salmon mortality for the watershed. We used this framework to predict outcomes of current water management on SRCS populations, as well as management under future climate change and management adaptation. The analytical framework offers a clear advantage over previous work, in that it allows explicit modeling of specific water management options as a response to flow and water temperature requirements of salmon.
The management options we investigated all come to the basic conclusion that a dramatic change in the system will take place in the second half of the 21st century. Only halting all diversions from the creek during the critical July-September holding period has potential for delaying the year when the system tips past a critical threshold for SRCS, but at the expense of a great deal of hydropower generation. Particularly vexing is the implication that changing management of the upstream reservoir has little positive impact. This raises another set of questions about whether it is prudent, from a policy perspective, to continue efforts to define management regimes to maintain SRCS in Butte Creek. A closer look suggests that while there would certainly be ample justification for refining SRCS restoration plans that consider the large meta-population in the Central Valley, there also is reason to consider more aggressive and refined management regimes within Butte Creek itself.
Consider, for example, the potential management of the cold water pool in Philbrook Reservoir. Analysis of the simulated water temperature profiles suggest that rather than producing a system with an enhanced cold water pool, the release of water from near the top of the reservoir outside the critical summer period actually degraded thermal stratification of the reservoir. This likely was associated with a general thinning of the upper warm layer allowing for deeper penetration of incoming solar energy. While Philbrook Reservoir is likely not large enough to support this sort of operation while maintaining stratification, it is worth noting that the management strategy modeled was relatively rigid in that the change in operations was set at a specific week and not based on downstream water temperature estimates. Rules designed to make more judicious use of the cold water resource when conditions in the over-summer holding reach were actually approaching critical water temperatures could potentially be adjusted relative to the thermal characteristics of Philbrook Reservoir in order to improve system viability. Evaluating more aggressive and refined adaptation strategies will be the focus of future modeling work conducted using our analytical framework. They represent the kinds of water management adaptation strategies that will be required to protect vulnerable aquatic ecosystems throughout California.
Climate change may affect meta-population processes in ways that will be important to salmon dynamics (Schindler, et al., 2008). Given the vulnerable nature of SRCS in Butte Creek, this may be particularly important for the sustainability of SRCS in California’s Central Valley. Historically the Central Valley SRCS ESU was comprised of 18 independent populations, but it has only three independent populations remaining (Lindley, et al., 2007). While our project focused on Butte Creek SRCS, it is likely that management adaptations that sustain Butte Creek SRCS will not be adequate to ensure the survival of the ESU. Reintroduction of salmon above impassable dams (potentially through trap and truck operations) has been recommended (NMFS, 2009) in order to allow salmon to reach cooler water at higher elevations and to increase the number of watersheds occupied by SRCS. Watersheds in the southern half of the Sierra Nevada are predicted to retain more snow pack (and thus more summer baseflow) than those in the northern half (Maurer, et al., 2007) so re-introducing SRCS to southern watersheds may be a particularly effective method to distribute the risk of extinction. Indeed, SRCS reintroductions have been recommended above the lowest dam on the Stanislaus River, and in the San Joaquin River below Friant Dam (NMFS, 2009). However, it is not known whether future climate scenarios will provide adequate conditions for SRCS in other watersheds, nor whether water management adaptations exist in these watersheds to mitigate climate change impacts. The framework we have developed could be applied to other SRCS watersheds and could form the basis for metapopulation–scale salmon management in order to balance human water needs with habitat requirements of salmon.
Task C (Conceptual Model/Food Web/Expert Panel)
Discussion
The frequency at which many organisms (especially black bears) were photographed at salmon bait stations suggests that salmon are an important resource for numerous organisms in the Butte Creek ecosystem. These results are even more significant considering that the majority of bears pull fish directly from the instream environment rather than consume the less-than-fresh fish used in the camera traps. Black bear sample sizes were small and we need more replicates to refine these results. However, the influx of bears captured by our cameras and reported by residents during the spawning season supports the value of salmon as a significant resource to the area’s bear population. The loss of this dietary subsidy may deprive organisms of an important source of nutrients during a critical time of year. For example, bears with access to salmon in the fall enter hibernation in better physical condition and produce more cubs.
Our preliminary results confirmed the presence in the region of candidate salmon consumers, established the resource value of salmon to the ecosystem, and provided valuable insights into how to further improve field protocols and mechanisms underlying food web relationships. Follow-up studies are needed to establish baseline nutrient composition in the watershed against which to base these findings. This information then can be fed-back to refine the conceptual food web model and make predictions as to the organismal and trophic-level impacts of the loss or degradation of this important ecosystem subsidy.
Outreach
The results also were presented to a Stakeholder Workshop in August 2010. Invitees included representatives from the following stakeholder groups: California Department of Fish and Game, California Energy Commission (representative was unable to attend), State Water Boards (representative was unable to attend), NOAA Fisheries, US Fish and Wildlife Service, Pacific Gas and Electric, California Sportfishing Protection Alliance (statewide environmental group), Friends of Butte Creek (local non-profit environmental group), and the general public (local residents of Butte Creek watershed).
We made a separate presentation of our results to the California Energy Commission in December 2010.
All workshop invitees were sent a distribution copy of the manuscript accepted in the Journal of Water Resources Planning and Management. Subsequently, we have received more than 25 additional requests for the paper.
We also have made 25 presentations of the results of this research project to a variety of stakeholders and academic audiences, and there have been 10 media pieces covering the project (please see Presentations and Media Coverage included in this report).
Implications of This Research Project
The most important conclusion of this work is that the long-term survival of SRCS in Butte Creek is questionable in the face of climate change and that simple changes to water operations are not likely to dramatically change vulnerability to extinction. Specifically, the analysis reveals that it is plausible to expect that the system will tip past critical thresholds some time during the second half of the 21st Century. For the managers of SRCS in Butte Creek, and in the wider Central Valley, this conclusion poses significant challenges that require an ecosystem protection strategy that moves well beyond incremental changes in management of SRCS. It is likely that Butte Creek SRCS is not the only resource facing such a challenge.
This highlights the second important conclusion, that water management adaptations may extend the survival of threatened salmon populations on the time scale of decades. Linked analytical frameworks such as the one presented here can guide adaptation of water management regimes to protect important ecosystem services. Furthermore, our results imply that management options available with current infrastructure need to be fine tuned to obtain the maximum benefit from power production while significantly reducing SRCS vulnerability to extinction. Without such changes in water management, SRCS are likely to go extinct in Butte Creek and elsewhere in California.
References:
Baker, P. F., Speed, T. P., and Ligon, F. K. (1995). “Estimating the influence of temperature on the survival of chinook salmon smolts (Oncorhynchus tshawytscha) migrating through the Sacramento - San Joaquin River Delta of California.” Can. J. Fish. Aquat. Sci. 52:855-863.
Bartholow, J. M., Laake, J. L., Stalnaker, C. B. a., and Williamson, S. (1993). "A salmonid population model with emphasis on habitat limitations." Rivers 4(4):265-279.
Bartholow, J. M. (1996). "Sensitivity of a salmon population model to alternative formulations and initial conditions." Ecol. Model. 88(1-3):215-226.
Bartholow, J., Heasley, J., J. Laake, J. Sandelin, B.A.K. Coughlan, and A. Moos. (2002). SALMOD: a population model for salmonids: user's manual. Version W3. . Fort Collins, CO: U.S. Geological Survey. 76 pp.
Bartholow, J. (2004). "Modeling Chinook salmon with SALMOD on the Sacramento River, California." Hydroécol. Appl. 14(1):193-219.
Bartholow, J., and Heasley, J. (2006). Evaluation of Shasta Dam scenarios using a salmon Production Model. USGS Administrative Report, Fort Collins, CO.
Battin, J., Wiley, M. W., Ruckelshaus, M. H., Palmer, R. N., Korb, E., Bartz, K. K., and Imaki, H. (2007). Projected impacts of climate change on salmon habitat restoration. Proc. Nat. Acad. Sci. 104(16):6720-6725.
Bernhardt, E. S., Palmer, M. A., Allan, J. D., Alexander, G., Barnas, K., Brooks, S., Carr, J., Clayton, S., Dahm, C., Follstad-Shah, J., Galat, D., Gloss, S., Goodwin, P., Hart, D., Hassett, B., Jenkinson, R., Katz, S., Kondolf, G. M., Lake, P. S., Lave, R., Meyer, J. L., O'Donnell, T. K., Pagano, L., Powell, B., and Sudduth, E. (2005). Ecology - synthesizing US river restoration efforts. Science 308(5722):636-637.
Bryant, M. D. (2009). Global climate change and potential effects of Pacific salmonids in freshwater ecosystems of southeast Alaska. Clim. Change 95:169-193.
Campbell, S. G., Bartholow, J., and Heasley, J. (2010). Application of the Systems Impact Assessment Model (SIAM) to fishery resource issues in the Klamath River, California. USGS Open-File Report.
Cayan, D. R., Maurer, E. P., Dettinger, M. D., Tyree, M. and Hayhoe, K. (2008). Climate change scenarios for the California region. Clim. Change, 87(Suppl. 1):21-42, doi:10.1007/s10584-007-9377-6.
Chaloner, D.T., K.M. Martin, M.S. Wipfli, P.H. Ostrom, and G.A. Lamberti. (2002). Marine carbon and nitrogen in southeastern Alaska stream food webs: evidence from artificial and natural streams. Can. J. Fish. Aquat. Sci. 59:1257-1265.
Chapra, S. (1997). Surface Water-Quality Modeling. New York, NY: McGraw-Hill.
Cifaldi, R. L., Allan, J. D., Duh, J. D., and Brown, D. G. (2004). Spatial patterns in land cover of exurbanizing watersheds in southeastern Michigan. Landscape Urban Plan. 66(2):107-123.
Crozier, L., and Zabel, R. W. (2006). Climate impacts at multiple scales: evidence for differential population responses in juvenile Chinook salmon. J. Animal Ecol. 75(5):1100-1109.
Crozier, L. G., Zabel, R. W., and Hamlet, A. F. (2008). Predicting differential effects of climate change at the population level with life-cycle models of spring Chinook salmon. Glob. Change Biol. 14(2):236-249.
Doherty, J. (2002). Model independent parameter estimation (PEST) user's manual, 5th Ed. Bethesda, MD: Watermark Numerical Computing.
Field, C. B., Daily, G. C., Davis, F. W., Gaines, S., Matson, P. A., Melack, J. a., and Miller, N. L. (1999). Confronting climate change in California. Washington, DC: The Union of Concerned Scientists and the Ecological Society of America.
Gard, M. (2003). Flow-habitat Relationships for Spring-Run Chinook Salmon Spawning in Butte Creek. U.S. Fish and Wildlife Service, Sacramento, CA.
Garman, C., and McReynolds, T. (2009). Butte and Big Chico Creeks spring-run Chinook Salmon, Oncorhynchus tshawytscha life history investigation 2007-2008. California Department of Fish and Game, Inland Fisheries Division, North Central Region.
Ginzburg, L. R., Slobodkin, L. B., Johnson, K. & Bindman, A. G. (1982). Quasiextinction probabilities as a measure of impact on population growth. Risk Anal. 2:171-181.
Graf, W. (1999). Dam nation: A geographic census of American dams and their large-scale hydrologic impacts. Water Resour. Res. 35:1305–1311.
Hayhoe, K, Cayan, D, Field, C. B,, Frumhoff, P. C., Maurer, E. P., Miller, N. L., Moser, S. C., Schneider, S. H., Cahill, K. N., Cleland, E. E., Dale, L, Drapek, R., Hanemann, R. M., Kalkstein, L. S., Lenihan, J., Lunch, C. K., Neilson, R. P., Sheridan, S. C., and Verville, J. H. (2004). Emissions pathways, climate change, and impacts on California. Proc. Nat. Acad. Sci. 101(34):12422-12427.
IPCC (Intergovernmental Panel on Climate Change). (2007). Climate change 2007: synthesis report. IPCC, Geneva, Switzerland. 104 pp., http://www.ipcc.ch/publications_and_data/publications_ipcc_fourth_assessment_report_synthesis_report.htm.
Isaak, D. J., Luce, C. H., Rieman, B. E., Nagel, D. E., Peterson, E. E., Horan, D. L., Parkes, S., and Chandler, G. L. (2010). Effects of climate change and wildfire on stream temperatures and salmonid thermal habitat in a mountain river network. Ecol. Appl. 20(5):1350-1371.
Lackey, R. T., Lach, D. H., and Duncan, S. L. eds. (2006). Salmon 2100: the future of wild Pacific salmon. American Fisheries Society, Bethesda, MD.
Liang, X., Lettenmaier, D. P., Wood, E. F., and Burges, S. J. (1994). A simple hydrologically based model of land surface water and energy fluxes for GSMs. J. Geophys. Res. 99(D7):14,415-14,428.
Lindley, S. T., Schick, R. S., Mora, E., Adams, P. B., Anderson, J. J., Greene, S., Hanson, C., May, B. P., McEwan, D. R., MacFarlane, R. B., Swanson, C., and Williams, J. G. (2007). Framework for assessing viability of threatened and endangered Chinook salmon and steelhead in the Sacramento-San Joaquin basin. San Francisco Estuary and Watershed Science 5(1. Art 4):1-26.
Lindley, S. T., Grimes, C. B., Mohr, M. S., Peterson, W., Stein, J., Anderson, J. T., Botsford, L.W., Bottom, D. L., Busack, C. A., Collier, T. K., Ferguson, J., Garza, J. C., Grover, A. M., Hankin, D. G., Kope, R. G., Lawson, P. W., Low, A., MacFarlane, R. B., Moore, K., Palmer-Zwahlen, M., Schwing, F. B., Smith, J., Tracy, C., Webb, R., Wells, B. K., Williams, T. H. (2009). What caused the Sacramento River fall Chinook stock collapse? Pre-publication report to the Pacific Fishery Management Council. March 18, 2009. 57 pp.
Matulla, C., Schmutz, S., Melcher, A., Gerersdorfer, T., and Haas, P. (2007). Assessing the impact of a downscaled climate change simulation on the fish fauna in an Inner-Alpine River. Int. J. of Biometeorol. 52(2):127-137.
Maurer, E. P., and Duffy, P. B. (2005). Uncertainty in projections of streamflow changes due to climate change in California. Geophys. Res. Lett. 32(3):L03704.
Maurer, E. P., Stewart, I. T., Bonfils, C., Duffy, P. B., and Cayan, D. (2007). Detection, attribution, and sensitivity of trends toward earlier streamflow in the Sierra Nevada. J. Geophys. Res.-Atmos. 112(D11118):1-12.
Maurer, E. P., and Hidalgo, H. G. (2008). Utility of daily vs. monthly large-scale climate data: an intercomparison of two statistical downscaling methods. Hydrol. Earth Syst. Sc. 12(2):551-563.
Maurer, E. P., Wood, A. W., Adam, J. C., Lettenmaier, D. P., and Nijssen, B. (2002). A long- term hydrologically based dataset of land surface fluxes and states for the conterminous United States. J. Climate 15(22):3237-3251.
McCullough, D. A. (1999). A review and synthesis of effects of alterations to the water temperature regime on freshwater life stages of salmonids, with special reference to Chinook salmon. U.S. Environmental Protection Agency. EPA 910-R-99-010, Region 10, Seattle, WA.
McReynolds, T. R., Garman, C. E., Ward, P. D., and Plemons, S. L. (2007). Butte and Big Chico Creek spring-run Chinook salmon, Oncorhynchus tshawytcha life history investigation 2005-2006. Administrative Report No. 2007-2, Inland Fishes, California Department of Fish and Game. 37 pp.
Millennium Ecosystem Assessment. (2005). Ecosystems and human well-being: Wetlands and water, synthesis. World Resources Institute, Washington, DC, http://www.millenniumassessment.org/documents/document.358.aspx.pdf.
Mote, P. W., Parson, E., Hamlet, A. F., Keeton, W. S., Lettenmaier, D., Mantua, N., Miles, E. L., Peterson, D., Peterson, D. L., Slaughter, R., and Snover, A. K. (2003). Preparing for climatic change: The water, salmon, and forests of the Pacific Northwest. Clim. Change 61(1-2):45-88.
Moyle, P. B., Israel, J. A., and Purdy, S. A. (2008). Salmon, steelhead, and trout in California: Status of an emblematic fauna. Report commissioned by California Trout, 316 pp., http://www.caltrout.org/SOS-Californias-Native-Fish-Crisis-Final-Report.pdf.
Naiman, R.J., R.E. Bilby, D.E. Schindler, and J.M. Helfield. (2002). Pacific salmon, nutrients, and the dynamics of freshwater and riparian ecosystems. Ecosystems 5:399-417.
Naiman, R.J., J.M. Helfield, K.K. Bartz, D.C. Drake, and J.M. Honea. (2009). Pacific salmon, marine-derived nutrients, and the characteristics of aquatic and riparian ecosystems. International Symposium on Challenges for Diadromous Fishes in a Dynamic Global Environment. Halifax, CANADA.
National Marine Fisheries Service (NMFS). (2009). Biological opinion and conference opinion on the long-term operations of the Central Valley Project and State Water Project. National Marine Fisheries Service. Southwest Region. June 4, 2009. 844 pp.
Noakes, D; Beamish, R; and Kent, M. (2000). On the decline of Pacific salmon and speculative links to salmon farming in British Columbia. Aquaculture 183(3-4):363-386.
Null, S. E., Viers, J. H., and Mount, J. F. (2010). Hydrologic response and watershed sensitivity to climate warming in California's Sierra Nevada. Plos One 5(3).
Pacific Gas and Electric Company (PG&E). (2007). License Application - DeSabla-Centerville Project: FERC Project No. 803. License Application, Volume I: Executive Summary, Initial Statement and Exhibits A, B, C, D, F, G and H. Pacific Gas and Electric Company.
Peterson, B.J. and B. Fry. (1987). Stable isotopes in ecosystem studies. Annual Review of Ecology and Systematics 18:293-320.
Pineiro, G., Perelman, S., Guerschman, J. P., and Paruelo, J. M. (2008). How to evaluate models: Observed vs. predicted or predicted vs. observed? Ecol. Model. 16(3-4):316-322.
Purkey, D. R., Huber-Lee, A., Yates, D. N., Hanemann, M., and Herrod-Julius, S. (2007). Integrating a climate change assessment tool into stakeholder-driven water management decision-making processes in California. Water Resour. Manag. 21(1):315-329.
Rand, P. S., Hinch, S. G., Morrison, J., Foreman, M. G. G., MacNutt, M. J., Macdonald, J. S., Healey, M. C., Farrell, A. P., and Higgs, D. A. (2006). Effects of river discharge, temperature, and future climates on energetics and mortality of adult migrating Fraser River sockeye salmon. Trans. Am. Fish. Soc. 135(3):655-667.
Schindler, D. E., Augerot, X., Fleishman, E., Mantua, N. J., Riddell, B., Ruckelshaus, M., Seeb, J., and Webster, M. (2008). Climate change, ecosystem impacts, and management for Pacific salmon. Fisheries 33(10):502-506.
Torgersen, C. E., Price, D. M., Li, H. W., and McIntosh, B. A. (1999). Multiscale thermal refugia and stream habitat associations of Chinook salmon in northeastern Oregon. Ecol. Appl. 9(1):301-319.
Tung, C. P., Lee, T. Y., and Yang, Y. C. (2006). Modelling climate-change impacts on stream temperature of Formosan landlocked salmon habitat. Hydrol. Process. 20(7):1629-1649.
Van Asselt, M. B. A., and Rotman, J. (2002). Uncertainty in integrated assessment modeling: from positivism to pluralism. Clim. Change 54:75-105.
Ward, P., McReynolds, T., and Garman, C. (2004). Butte Creek Spring-Run Chinook Salmon, Oncoryhnchus tshawytscha, Pre-Spawn Mortality Evaluation." California Department of Fish and Game, Sacramento Valley - Central Sierra Region.
Wilby, R. L., Orr, H., Watts, G., Battarbee, R. W., Berry, P. M., Chadd, R., Dugdale, S. J., Dunbar, M. J., Elliott, J. A., Extence, C., Hannah, D. M., Holmes, N., Johnson, A. C., Knights, B., Milner, N. J., Ormerod, S. J., Solomon, D., Timlett, R., Whitehead, P. J., and Wood, P. J. (2010). Evidence needed to manage freshwater ecosystems in a changing climate: Turning adaptation principles into practice. Sci. Total Environ. 408(19):4150-4164.
Yates, D., Galbraith, H., Purkey,D., Huber-Lee, A., Sieber, J., West, J., Herrod-Julius, S., and Joyce, B. (2008). Climate warming, water storage, and Chinook salmon in California’s Sacramento Valley. Clim. Change 91(3-4):335-335.
Yates, D., Purkey, D., Sieber, J., Huber-Lee, A., and Galbraith, H. (2005a). WEAP21 - A demand-, priority-, and preference-driven water planning model Part 2: Aiding freshwater ecosystem service evaluation. Water Int 30(4):501-512.
Yates, D., Purkey, D., Sieber, J., Huber-Lee, A., Galbraith, H., West, J., Herrod-Julius, S., Young, C., Joyce, B., and Rayej, M. (2009). Climate driven water resources model of the Sacramento Basin, California. J. Water Res. Pl.-ASCE 135(5):303-313.
Yates, D., Sieber, J., Purkey, D., and Huber-Lee, A. (2005b). WEAP21 - A demand-, priority-, and preference-driven water planning model Part 1: Model characteristics. Water Int. 30(4):487-500.
Yoshiyama, R. M., Gerstung, E. R., Fisher, F. W., and Moyle, P. B. (2000). Chinook salmon in the California Central Valley: an assessment. Fisheries 25:6-20.
Yoshiyama, R. M., Fisher, F. W., and Moyle, P. B. (1998). Historical abundance and decline of Chinook salmon in the Central Valley region of California. N. Am. J. Fish. Manage. 18:487-521.
Yoshiyama, R. M., Gerstung, E. R., Fisher, F. W., and Moyle, P. B. (2001). Historical and present distribution of Chinook salmon in the Central Valley. Contributions to the biology of Central Valley salmonids. R. Brown, ed., California Department of Fish and Game Fish Bulletin, Vol. 179, pp. 71-176.
Young, C. A., Escobar-Arias, M. I., Fernandes, M., Joyce, B., Kiparsky, M., Mount, J. F., Mehta, V. K., Purkey, D., Viers, J. H., and Yates, D. (2009). Modeling the hydrology of climate change in California's Sierra Nevada for subwatershed scale adaptation1. J. Am. Water Resour. As. 45(6):1409-1423.
Zabel, R. W., Scheuerell, M. D., McClure, M. M., and Williams, J. G. (2006). The interplay between climate variability and density dependence in the population viability of Chinook salmon. Conserv. Biol. 20(1):190-200.
Zalewski, M. (2002). Ecohydrology - the use of ecological and hydrological processes for sustainable management of water resources. Hydrolog. Sci. J. 47(5):823-832.
Journal Articles on this Report : 1 Displayed | Download in RIS Format
| Other project views: | All 26 publications | 1 publications in selected types | All 1 journal articles |
|---|
| Type | Citation | ||
|---|---|---|---|
|
|
Thompson LC, Escobar MI, Mosser CM, Purkey DR, Yates D, Moyle PB. Water management adaptations to prevent loss of spring-run Chinook salmon in California under climate change. Journal of Water Resources Planning and Management 2012;138(5):465-478. |
R833017 (2010) R833017 (Final) |
Exit Exit Exit |
Progress and Final Reports:
Original AbstractThe perspectives, information and conclusions conveyed in research project abstracts, progress reports, final reports, journal abstracts and journal publications convey the viewpoints of the principal investigator and may not represent the views and policies of ORD and EPA. Conclusions drawn by the principal investigators have not been reviewed by the Agency.