
Grantee Research Project Results
2010 Progress Report: Forecasting Critical Ecosystem Services from Measures of Wetland Condition at theWatershed Scale in Freshwater Wetlands of Pennsylvania and Ohio
EPA Grant Number: R834262Title: Forecasting Critical Ecosystem Services from Measures of Wetland Condition at theWatershed Scale in Freshwater Wetlands of Pennsylvania and Ohio
Investigators: Wardrop, Denice Heller , Fennessy, M. Siobhan
Institution: Pennsylvania State University , Kenyon College
EPA Project Officer: Packard, Benjamin H
Project Period: May 1, 2009 through April 30, 2012 (Extended to July 31, 2013)
Project Period Covered by this Report: May 1, 2010 through April 30,2011
Project Amount: $471,303
RFA: Forecasting Ecosystem Services from Wetland Condition Analyses (2008) RFA Text | Recipients Lists
Research Category: Aquatic Ecosystems , Ecological Indicators/Assessment/Restoration , Water
Objective:
To provide an estimation procedure for wetland ecosystem services that allows wetland management and restoration approaches to align with the provision of ecosystem services. The study achieves this through the following:
- Identification of ecosystem services that are critical to human well-being (nitrogen retention and cycling, carbon sequestration and storage, and flood abatement);
- Construction of quantitative process models that relate stressors (related to both land cover and climate change) to condition assessment data (generally used to describe the condition of physical, chemical, or biological compartments) to these critical ecosystem services, and provide a quantitative estimate of accrual;
- Identification of robust condition assessment data sets that cover a range of important wetland types to allow parameterization of such models, and an analytical method to do so;
- Specification of the relevant spatial scales on which ecosystem services can be managed, and subsequent estimation of the accrual in ecosystem services on these scales.
These objectives are met through the following major tasks in the scope of work:
- Determination of field sites
- Field measurements of nitrogen cycling/retention, carbon sequestration, and flood storage
- Integration of data – linking condition data to services
Progress Summary:
There have been some modifications to the sites selected for intensive investigation under this project. Sites in Pennsylvania were originally intended to overlap with sites previously selected and characterized by the Project: Hydrologic Forecasting for Characterization of Non-linear Response of Freshwater Wetlands to Climatic and Land Use Change in the Susquehanna River Basin (EPA Grant Number: R833013). These sites were originally chosen because of the detailed hydrologic and biological data recently collected at these sites. However, these sites were designated at a reach scale over a gradient of contributing watershed size (i.e., a sampling site was an entire reach with the accompanying floodplain area, and ranged from low gradient to high gradient reaches) rather than across HGM wetland classes. Since this current project aims to assess the relationship between condition metrics and ecosystem services (i.e., water storage, denitrification, and carbon storage) at riverine and depressional sites along a disturbance gradient, we needed to revisit the appropriateness of these sites.
We considered replacement sites from a reference collection held for the Commonwealth of Pennsylvania by Riparia at Penn State (http://www.wetlands.psu.edu/ projects/reference_wetlands.asp, last accessed 8/25/2011), including sites assessed in the Upper Juniata Study (as referenced in the proposal). All reference sites have been previously characterized for soils, plants, microtopography, and condition, using Landscape, Rapid, and Intensive Assessment protocols (Wardrop et al., 2007)). This past spring/summer we chose 8 of the 12 sites needed for this study; these 8 sites are of particular note since they will be sites of the push-pull method of denitrification assessment (see text under field assessment for further detail regarding additional denitrification protocols across all sites; carbon storage and flood storage are also measured at all 12 sites). Two headwater floodplain sites of low, moderate, and high condition were selected based on this assessment protocol. We selected two additional high condition riparian depression sites for a reference standard comparison of HGM types. In addition to controlling for HGM type, we selected sites from this collection based on their lithology and soil series. Factors such as pH, which can vary among geologic and soil series types can affect many microbial processes such as rates of decomposition and denitrification (Alexander 1977).
All sites selected thus far are within the Ridge and Valley physiographic province of Central Pennsylvania, which consists of sandstone ridges with a predominance of shale and siltstone valleys. However, some valleys are underlain by limestone and dolomite (http://www.dcnr.state.pa.us/topogeo/map13/13ams.aspx, last accessed 8/25/2011). Given the predominance of shale and siltstone in the region we chose sites located on sandstone, siltstone, or shale primary lithology. In addition, we determined the major hydric soils types within a 10 m buffer strip along all stream miles in the Ridge and Valley Regions. Although percent cover of all hydric soil types were low (<5%) all sites were selected to be on the most dominant hydric soils types (> 1%) within this buffer strip. We also found that the condition gradient exists across a texture gradient. Therefore we selected one site from each condition group (low, medium, and high) to be a soil series dominated by sand or clay texture class.
The resulting table of Pennsylvania sites is presented in Table 1; we have thus selected 8 of the 12 sites originally stated in the proposal. Because of the intensity of the push-pull protocol for denitrification, we intend to only sample these 8 sites in this manner. We will select the remaining 4 sites in Fall 2011 for the assessment of carbon storage and flood storage on all 12 Pennsylvania sites. For reference purposes, the list of established field sites in Ohio (reported on in the 2009-2010 annual report) is presented in Table 2. We intend to sample approximately 6 to 8 of these sites with the push-pull method, as well.
Table 1. Sites selected in Pennsylvania.
|
Riparia Site No.† | Latitude | Longitude | HGM‡ | Geology | Soil Series | Soil Texture | D-Score |
| 140 | 40.4052 | -78.4480 | HF | Hamilton Group | Udifluvent-Dystrorchepts Complex | Sandy Loam / Loam | 33 |
| 158 | 40.6043 | -78.2889 | HF | Hamilton Group | Holly Silt Loam | Clay Loam / Clay | 33 |
| 159 | 40.7124 | -78.1919 | HF | Hamilton Group | Udifluvent-Dystrorchepts Complex | Sandy Loam / Loam | 61 |
| 121 | 40.7360 | -78.1441 | HF | Onondaga Fm and Old Port Fm Undiv | Holly Silt Loam |
| 46 |
| 60 | 40.6967 | -77.8544 | HF | Bloomsburg Fm/ Mifflintown Fm Undiv | Atkins Silt Loam | Sandy Loam | 94 |
| 23 | 40.6440 | -77.9306 | HF | Bloomsburg Fm/Mifflintown Fm Undiv | Atkins Silt Loam | Silty Clay / Clay | 70 |
| 13 | 41.0317 | -77.1083 | RD | Reedsville FM | Udifluvents and Fluvaquents, Gravelly | Loam | 98 |
| 5 | 41.0159 | -77.1816 | RD | Reedsville Fm | Philo and Atkins very Stony Soils | Loam | 99 |
† More information on sites can be found at: http://www.wetlands.psu.edu/projects/reference_wetlands.asp
‡ HF = Headwater Floodplain, RD = Riparian Depression
Table 2. Summary of Ohio sites.
|
Site Name | County (OH) | HGM Type | Vegetation Type | Relative Ecological Condition | Wells Installed |
| Ballfield | Knox | Depressional | Emergent | High | 3 |
| Bee Rescue | Cuyahoga | Depressional | Emergent | High | 3 |
| Secret Marsh | Summit | Depressional | Emergent | Moderate | 3 |
| Batnest | Knox | Depressional | Emergent | Low | 3 |
| Blackout | Cuyahoga | Depressional | Emergent | Low | 3 |
| Skunk Forest | Cuyahoga | Riverine | Forested | High | 4 |
| Lizard Tail | Cuyahoga | Riverine | Forested | Moderate-high | 3 |
| Hellbender | Knox | Riverine | Forested | Moderate | 4 |
| Vernal Pool | Cuyahoga | Riverine | Forested | Moderate-low | 3 |
| Kokosing | Knox | Riverine | Forested | Low | 4 |
Field Characterization
After sites were selected in early summer (8 in Pennsylvania) an initial characterization was performed to enhance and understand the results of our later examinations of ecosystem services. Sites were selected to be within a 40 m by 40 m area and a map was produced of each site for use on later site trips. This plot size was chosen because it is similar to the estimated size used in the condition assessments previously performed at the sites. Sites were broken into 10 m by 10 m plots and six of the 16 plots were randomly selected and flagged (center of each plot) for possibly use in the denitrification component of the study. Temperature can also play a role in processes such as decomposition and denitrification (Alexander 1977). We had temperature loggers left over from a previous study that were available for use. We randomly selected four of the six plots to place the temperature loggers in. The center of each site was flagged for the collection of the carbon core. Three wells were also installed in a 30 m equilateral triangle within each site to estimate hydrologic parameters.
Denitrification Preparation
There have been a number of changes to the denitrification portion of this project. The initial proposal suggested that the push-pull method would be used at the 24 sites across two years, with three sampling periods per year (early spring, late spring, and late summer). One push-pull was to be performed at each site. However, after many conversations among the collaborators and additional input from Dr. Melanie Harrison, who had recently performed and adapted this method for wetland soils for her PhD research (Harrison et al. 2011), we determined that we needed to make some adjustment to our original plan.
The PSU Research Assistant, Jessica Moon, contacted and met with Dr. Harrison, in Fall of 2010. They ran through the method together and Dr. Harrison provided her with a list of supplies that would be needed. A detailed budget was prepared with the number of push pulls that could be performed based on sample analyses costs and the equipment needed given the time and labor sources available; it was determined that it would be reasonable to perform approximately 80 push-pulls based on our budget. During this same period we also analyzed data from a spatial analysis of soils at some of the now selected sites (J.B. Moon, dissertation in prep). This data shows a high level of spatial variability in factors that are known to affect the denitrification process, such as soil organic matter, pH, ammonium, nitrite+nitrate, volumetric water content, gravimetric water content, and litter biomass and TC:TN concentrations. There were particularly high levels of spatial variability at high condition sites. However, some variables (e.g., pH) were high across the entire condition gradient. A few of these variables were also measured over an annual cycle and were found to be more stable across this dimension (e.g., pH). Additional information on hydrology was collected from the Climate Project mentioned above. This study revealed high spatial variability in water level data across study sites of similar size. Together this information led us to determine that we need to increase the number of push pulls per site, rather than put all our efforts into the temporal component.
We determined we could have a minimum of three push pulls per site while still maintaining one temporal sampling at approximately half of the sites. During this summer we also took and analyzed bulk density cores (up to 60 cm when possible) from the six plots flagged for denitrification at each site. Currently we are looking at this data to determine the spatial variation in soils among and within sites. Based on our findings we will determine if three push pulls are adequate to represent the site. If not, additional push-pulls will be performed. Extra plots will also be used as back up plots incase the water level is too low or if other technical issues arise (e.g., soil texture can affect the pulling of water). We estimate that depending on the number of samples needed to represent sites, we will be able to perform this method on 12 to 16 sites. We chose to perform the two samplings happening this fall and next spring. These seasons were chosen because we expect the highest denitrification potential to occur during fall senescence and during the spring nutrient flushing periods. Along with increases in nutrient availability during these periods, we also suspect we are more likely to have access to the water required for the method in the top layers of soil (<50cm) during these two seasons. Hydrology data collected from Ohio sites over the past summer and coring at Pennsylvania sites this summer indicated that water table was below 50 cm during much of the summer at most sites. We expect little microbial activity below these surface layers.
An additional denitrifcation measurement components has been added to this portion of the project. Field trials in the summer of 2011 proved that the planned push-pull, in-situ measurement of denitrification was problematic in several sites due to the fine texture of the sediments. Fine and organic rich soils clogged the well screens so water could not pass through the well, and thus prevented the use of the push-pull method. Because the push-pull method cannot be used in all sites (we expect for the method to be viable in 12 of the 24 sites), the decision was made to sample all sites and estimate denitrification using the denitrifying enzyme assay (DEA). This is a standard, lab based method to estimate rates of potential denitrification. Use of this method will accomplish two things: 1) it will allow denitrification rates and N retention estimates to be calculated for all sites, regardless of soil type and texture, and 2) it will allow a comparison of the in-situ push-pull method, which has been tested on a very limited basis in wetlands, with the long-established, lab-based denitrification assay. Although there are issues with both of these methods (see Groffman et al. 2006) we will strengthen our overall findings by using both methods and assessing the relationship between the two methods.
A few additional measurements will be collected. Both denitrification methods measure potential denitrification rates, rather than actual rates. For example, during the push-pull method we enrich ground water with nitrate. However, this does not necessarily mean that there is a nitrate supply over time that can be used in this process. So we also decided to measure nitrogen mineralization using the resin core method, adapted from Noe (2011). We will measure nitrogen mineralization during two months prior to enriching with nitrate at 4 of the 6 plots in each site. The sampling periods are staggered so as to not contaminate our cores with the enrichment nitrate. We also plan to take initial samples for DOC, as it can be an important driver in denitrification rates. Finally, we plan to use SF6 as the sole tracer, rather than dual tracer along with KBr. Dr. Harrison, suggest this as some ground water samples can have high levels of bromide. Her study, which was performed in similar systems, was successful in using SF6 as the sole tracer.
We have included two denitrification training discs in this report. These discs were created to train our field crew, when Dr. Harrison came to visit our sites this past spring.
Carbon Sequestration
In order to calculate rates of C accretion cores were collected at 18 sites (7 in Ohio, 11 in Pennsylvania). Soil cores, 8.0 cm diameter by approximately 50 cm deep were collected at a central location within the triangular area defined by the three groundwater monitoring wells that have been installed at each site. Cores were sectioned in the field into 2-cm increments for analysis. Each increment was air dried and weighed to determine bulk density. The soil was then ground, sieved through a 2 mm screen and sent to the soil lab at Indiana University for 137Cs analysis to determine vertical accretion rates. In all samples, the maxima had a well-defined peak, which corresponds to the level of the soil surface in 1964, the year of peak deposition of fallout from nuclear arms testing. Each soil increment is being analyzed for total organic C and N using a PerkinElmer 2400 CHN analyzer. This will allow calculation of organic C accretion rates at each site.
Preliminary results showing the rates of soil accretion are shown below for two Ohio sites. These will be converted to rates of carbon accretion once the soil C analysis is finalized.
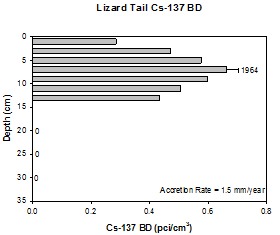
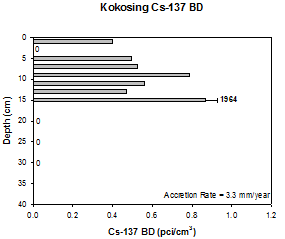
Figure 1. Administrative activities made possible by the cooperative agreement with US EPA NHERL-WED continued as follows:
- Continued discussion on the monitoring required to support the assessment of provision of ecosystem services on a various scales, from local to national. This includes expansion of the matrix of available monitoring metrics across ecosystem services.
- Continued interaction and discussion with Alan Herlihy, Jan Stevenson, NHERL-WED personnel, and other investigators regarding decision support tools for ecosystem services.
- Cooperative efforts between denitrification efforts currently under way in our project, and EPA's intent to include denitrification measurements in the National Wetland Condition Assessment. We are communicating with Dr. Amanda Nahlik concerning the assessment of soil N15 levels as an additional method to be utilized at a subset of our sites. This would provide a comparative assessment of all three methods of denitrification estimation.
Aims of the project remain unchanged from those originally stated.
Future Activities:
The major objectives for the next reporting period are the completion of the denitrification field efforts at the Pennsylvania and Ohio sites, the flood storage modeling, and the analysis of all data. The field effort will continue in two major phases: autumn denitrification measurements at the Pennsylvania and Ohio sites, and a spring push-pull denitrification sampling as budget allows.
References:
Alexander, M. 1977. Introduction to soil microbiology. John Wiley and Sons, Inc. New York, NY.
Brooks, R. P., D. H. Wardrop, and J. A. Bishop. 2004. Assessing wetland condition on a watershed basis in the Mid-Atlantic region using synoptic land cover maps. Environmental Monitoring and Assessment 94: 9-22.
Groffman, P. M., Altabet, M.A., Böhlke, J.K., Butterbach-Bahl, K., David, M.B., Firestone, M.K., Giblin, A.E., Kana, T.M., Nielsen, L.P., and Voytek, M.A. 2006. Methods for measuring denitrification: Diverse approaches to a difficult problem. Ecological Applications 16: 2091-2122.
Harrison, M.D., Groffman, P.M., Mayer, P.M., Kaushal, S.S., and Newcomer T.A. 2011. Denitrification in Alluvial Wetlands in an Urban Landscape. Journal of Environmental Quality 40: 634-646.
Noe, G.B. 2011. Measurement of net nitrogen and phosphorus mineralization in wetland soils using a modification of the resin-core technique. Soil Science Society of America Journal 75: 760-770.
Wardrop, D.H., M. E. Kentula, D. L. Stevens, Jr., S. F. Jensen, and R. P. Brooks. 2007. Regional Assessments of Wetland Condition: An Example from the Upper Juniata Watershed in Pennsylvania, U.S.A. Wetlands 27(3): 416-431.
Journal Articles on this Report : 1 Displayed | Download in RIS Format
| Other project views: | All 2 publications | 1 publications in selected types | All 1 journal articles |
|---|
| Type | Citation | ||
|---|---|---|---|
|
|
Moon J, Wardrop D, Fennessy M, Ingram H, Britson A, Okoro M. Variation in surface and subsurface nitrogen cycling in headwater floodplain wetlands due to soil type and wetland condition. WETLANDS ECOLOGY AND MANAGEMENT 2020;28(5):727-751. |
R834262 (2010) |
Exit Exit |
Supplemental Keywords:
RFA, Air, Atmosphere, Air Pollution Effects, climate changeProgress and Final Reports:
Original AbstractThe perspectives, information and conclusions conveyed in research project abstracts, progress reports, final reports, journal abstracts and journal publications convey the viewpoints of the principal investigator and may not represent the views and policies of ORD and EPA. Conclusions drawn by the principal investigators have not been reviewed by the Agency.