
Grantee Research Project Results
2011 Progress Report: Predicting Regional Allergy Hotspots in Future Climate Scenarios – Putting the Where & When on Wheezing
EPA Grant Number: R834359Title: Predicting Regional Allergy Hotspots in Future Climate Scenarios – Putting the Where & When on Wheezing
Investigators: Foster, David R. , Stinson, Kristina , Rogers, Christine A.
Current Investigators: Foster, David R. , Rogers, Christine A. , Stinson, Kristina
Institution: Harvard University , University of Massachusetts - Amherst
EPA Project Officer: Chung, Serena
Project Period: September 1, 2009 through August 31, 2013 (Extended to August 31, 2014)
Project Period Covered by this Report: September 1, 2010 through August 31,2011
Project Amount: $898,634
RFA: Climate Change and Allergic Airway Disease (2008) RFA Text | Recipients Lists
Research Category: Human Health , Climate Change
Objective:
The overall aim of this project is to develop tools for predicting pollen allergies caused by ragweed in response to current and future climatic variation, using the Northeastern U.S. region as a case study. We are exploring the relationships between pollen allergy risk factors and climate data, and testing the hypothesis that a population’s origin will determine its response to climate change variables (i.e., we are testing for ecotypic variation among ragweed populations). Data from our field observations and experiments will be used in combination with geographic datasets on climate and human demographic patterns to model specific risk factors (output, timing, and pollen potency) for ragweed allergy exposure across the region. The key question to be answered by this research is: Where and when are ragweed allergies most likely to occur and/or worsen under predicted climate change scenarios in New England?
The central objective of this work is to better predict the impacts of climate change on pollen-induced allergic airway disease. We will combine field sampling, geographic information system (GIS) analysis, and controlled experiments to predict when and where pollen allergies are most likely to increase in response to changes in atmospheric carbon dioxide and seasonal precipitation patterns, using the widespread hay-fever allergenic plant, common ragweed (Ambrosia artemisiifolia L.), as a model system. Specifically, we aim to: (1) model pollen allergy risk factors as a function of regional climate patterns; (2) provide ecological data on allergenic plant responses to a range of current and future seasonal conditions; and (3) generate predictive maps of allergy hotspots under a range of climate change scenarios. We are evaluating the effects of environmental conditions on three pollen allergy risk factors: (i) timing of pollen production (onset, peak and duration); (ii) pollen output; and (iii) allergic potency (Amb-A1 protein levels) to address the following questions: What is the role of climate on the production, distribution, dispersion and potency of pollen? How do climatic conditions affect growth, distribution and phenology of allergenic plant species? How will these risk factors change in future climate scenarios?
Progress Summary:
This is the second year in a 4-year project, and is strongly focused on data collection. Activities in Year 2 included: (a) initiating and completing a major CO2 experiment using ragweed ecotypes from different climate zones in New England; (b) collecting demographic and pollen production data from 24 ragweed populations across an environmental gradient in Massachusetts; (c) continuing with a second year of air sampling for ragweed pollen across this same Massachusetts gradient; and (d) completing field observations for mapping the occurrence of ragweed across the region. Preliminary analyses of our experimental data indicate strong ecotypic variation in the growth responses of ragweed to increased CO2 levels. Specifically, the Vermont populations demonstrate distinctly greater size increases at experimental levels of 600 and 800 ppm than populations from Massachusetts or New York. The populations from different points along the regional gradient also flower at distinct times (earliest in Northern climate and latest in southern climate). Our demographic surveys demonstrate relationships between flower production and field densities of ragweed and greater overall plant height in warmer climate zones. Climate, forest canopy cover, and disturbance were key indicators of ragweed occurrence in our analysis of the presence/absence survey, and our models to date predict ragweed presence with approximately 75 percent accuracy. Our observations of airborne pollen further demonstrate that concentrations are also related to these parameters; however, timing of peak pollen concentrations was consistent across most of the Massachusetts transect.
Together, these datasets on experimental response to future climate, ragweed population dynamics and spatial distribution, and aerobiology of ragweed pollen, will create the foundation for the predictive "ragweed hotspot maps" we plan to produce in years 3 and 4 of the study.
The actual accomplishments for this time period meet our goals and expectations as follows:
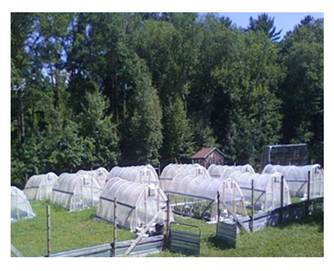
- Global change experiment: We built a major experimental facility onsite at Harvard Forest to test the effects of elevated CO2 on pollen production and potency of ragweed ecotypes originating from wild collected seed across our regional gradient (NY-MA- VT). The facility consists of 12 chambers constructed of PVC frames and plastic covering, an outdoor CO2 supply tank, and a computer-controlled environmental control system housed within an existing indoor shed. Three CO2 levels (400, 600, and 800 µL L-1 ) were maintained using a CO2 flow manifold computer interfaced solenoid valves to control levels in the treatments. We installed an automatic drip irrigation system to water the experimental plants, and temperature-controlled vents to regulate temperature within the chambers. We conducted a power analysis to determine our final experimental design, and determined that three levels of CO2 and constant watering would be preferable to multifactorial CO2 x watering treatments for interpretation of our pollen data. The resulting design allowed us to assess the effects of ambient, predicted 50-yr, and predicted 100-yr levels of CO2 with a total experiment size of 1,152 plants. We also added two “nontreatment” chambers consisting of a frame and roof with ambient air flow as a comparison between our ambient treatments and actual field conditions, bringing the experiment size to over 1,200 potted individual ragweed plants. Each plant was monitored for germination, growth, timing of reproduction, and total number of male flowering spikes produced. Pollen was collected from at least 3-5 flowering spikes per plant using gravity collection into polyethylene bags suspended on small garden stakes and attached to the growing plant (an arduous and time consuming process!) for laboratory analysis of total pollen mass and Amb-a1 protein levels. We are currently processing biomass of all male flowering spikes for each plant and shoot, root and seed mass for a subset of individuals within each treatment. Thus far, the results indicate strong ecotypic variation in size and flowering time, with the VT (most northern latitude in the study) most distinct from the other two populations (see results, below). The experimental phase provided state-of-the-art research training for a graduate student at University of Massachusetts and three undergraduate students, funded by this and other grants through the Harvard Forest Summer Research program.
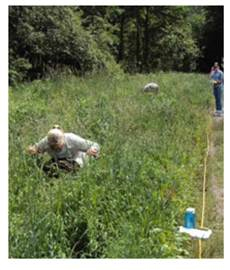
Figure 1. The new Ragweed CO2 Experiment, Summer 2011 - Demographic study of field populations: We conducted a demographic study of 24 wild field populations of ragweed across environmental gradients in Massachusetts. The sampling transect runs westerly ~120 km (~75 miles) from Boston to surrounding rural sites. We collected ecological data on density, plant size, survival, and flowering time in each population. Our results to date indicate some key differences in density and size, but little variation in flowering times across the gradient. We plan to conduct a power analysis using these observations to determine whether and how to continue field observations in years 3 and 4. We also attempted to best measure pollen production at each site using settlement traps to collect local pollen throughout the flowering season and succeeded only in a subset of the populations due to vandalism, weather (Hurricane Irene) damage or theft of our traps. This summer we developed a new protocol for estimating total pollen output in each population, using vacuum sampler attached to a portable care battery and inverter. This method will replace the settlement traps in 2012. The results from this work will be used to model ragweed densities and performance across the region and the flowering dates will be compared with our measurements of airborne pollen to help determine key pollen sources.
Figure 2. Counting flowering stems of
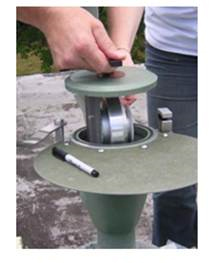
ragweed in a study population. - Airborne pollen data along an urban‐rural transect in Massachusetts. To determine relationships between airborne pollen, ragweed population biology and landscape /climate factors, we have established a series of Burkard® Traps in similar rooftop locations at three main locations across the state of Massachusetts. The traps continually monitor airborne pollen on a 24-hour time series, and are strategically located in areas that span a gradient from urban/warm conditions to rural/cool conditions. The traps are located as follows: Urban/Warm - Boston University; Suburban/Intermediate - Concord Field Station; Rural/Cool - Harvard Forest. An additional trap at the University of Massachusetts, Amherst provides data from a more developed site within the same climate zone as the trap at Harvard Forest. In years 1 and 2, we leveraged existing available equipment to install an additional trap in the Berkshires region, in an attempt to span a broader climate gradient. While technical difficulties at the Berkshires location have precluded its inclusion in our analyses to date, our model and predictive maps are not dependent upon that data point. Laboratory analysis of pollen capture from our traps is ongoing, and sampling at all four locations is planned to continue through Year 3 of the project period (2012).
Figure 3. Setting the sample tape
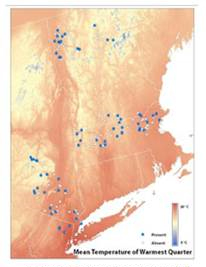
in a rooftop Burckard Trap. - Mapping and modeling: We completed a presence/absence survey for common ragweed (Ambrosia artemisiifolia) in the metropolitan areas of New York, NY; Boston, MA; and Burlington, VT. We used field surveys to quantify and map ragweed occurrence following the presence/absence survey and remote sensing methods described in the proposal and in last years report. We have begun mapping ragweed in the region and testing our models of ragweed occurrence against our field observations (see results, below). The picture at the right shows the sample points we visited during the survey as a function of regional temperature data. Blue dots indicate locations where ragweed was present, white indicates ragweed absence. Along with senior research personnel, undergraduate students were actively engaged in this research in 2010 and 2011.
Figure 4. Locations of randomly
sampled survey points (see text).
Results (outputs/outcomes) to date, emphasizing findings and their significance to the field, their relationship to the general goals of the award, their relevance to the agency's mission, and their potential practical applications.
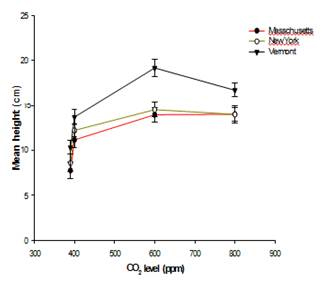
- Global change experiment: The preliminary results from our CO2 experiment indicate strong ecotypic variation in size and flowering time, with plants from the most northern latitude most distinct from the other two populations (Figure 1). Populations from Vermont demonstrate the greatest size boost from elevated CO2 (Figure 1a, ANOVA p < 0.0001). This meets with our prediction that some populations of ragweed will be physiologically more responsive to future climate scenarios than others, possibly because their current conditions are least similar to the predicted scenarios of elevated temperatures and CO2 levels. Plants from Vermont also bloomed 10-14 days earlier than those from MA and up to 20 days earlier than plants from NY, indicating strong photoperiodicity and ecotypic variation in flowering time. We are currently analyzing the full dataset for ecotypic variation in other plant traits, including flowering duration, pollen productivity and pollen potency. These data underscore the importance of population-level differences in response to climate change, and the results will be critical for establishing predictive values for our risk assessment models.
Figure 5. Preliminary data from global change experiment
2011. Mean height in cm in plants from different portions of
the regional gradient grown at experimental CO2 levels.
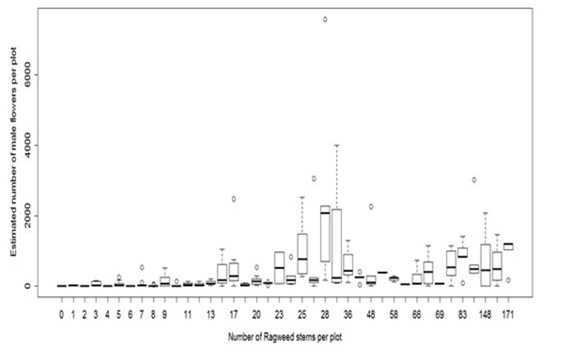
Closed circles = MA, open circles = NY, closed triangles = VT. - Demographic variation in field populations: Results to date from the field survey of 24 populations across three climate zones in Massachusetts indicate some key differences in plant size and flowering as a function of density, but little variation in flowering times. As shown in Figure 2, the number of flowers per plot is highest at intermediate densities and may be negligibly low at low field densities. As expected, crown heights are greatest in the warmer climatic zone (GLM model, p < 0.01), which may account for greater production and dispersal distances of pollen, to be determined in subsequent years. These results will be important for developing our field monitoring protocols in subsequent years and in linking local population data to our measurements of air quality and predictive maps of pollen production risks.
Figure 6. Average numbers of ragweed stems per square meter in 24 observation plots (each
containing 3-10 quadrants). Male flower estimates are derrived from number of male flowers
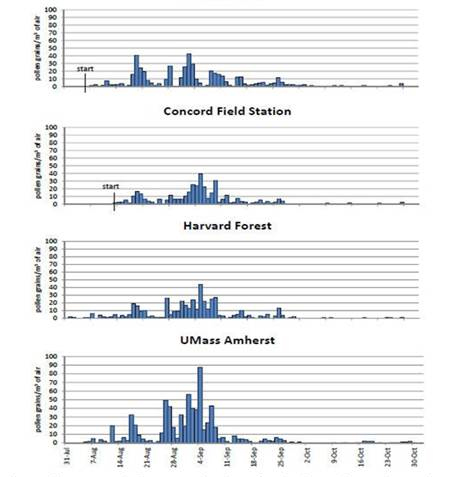
counted during the weekly demographic census in 2011. - Airborne pollen data along an urban‐rural transect in Massachusetts: Laboratory analysis of pollen capture from the Burkard traps are ongoing and will be used to generate estimates of air quality along regional environmental gradients in the model. Sampling from these locations are planned to continue through Year 3 of the project period (2012). To date, our data show similar peak flowering times at three sites, with a slightly earlier peak in Boston.
Figure 7. Airborne ragweed pollen concentrations in 2010 for 4 sites in
Massachusetts along an urban to rural transect. Bars represent average
daily concentration of a 24 hour calendar day. Sampling started slightly
later at Boston Univ and Concord Field Station as indicated by the start
mark. Peak conentrations werer reached on the same day, September 4th
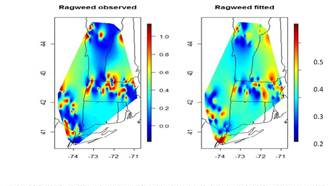
for 3 sites (Concord, Harvard Forest, U Mass). - Mapping and modeling: We have begun testing spatial distribution models with our observations of ragweed presence and absence. To date, our model indicates that climate variables, forest canopy cover and disturbance indicators are most important in predicting the presence of ragweed (Table 1). Our preliminary mapping efforts (Figure 4) indicate approximately 75 percent accuracy in predicting the presence of ragweed throughout the region (false negative = .21, false positive .27). We will continue parameterizing and testing our models through the duration of the project period. Together with field observations of air quality, population dynamics and experimental datasets, these models are the foundation of the predictive "ragweed hotspot maps" we plan to produce in years 3 and 4 of the study.
Figure 8. Model accuracy for predicting ragweed occurrence
based on field observations of species absence and analysis of
CAS and observed data on climate and land cover features.-
Table 1. Likelihood model results from 2010 - 2011 presence/absence survey data
Predictors AIC df Likihood Deviance Full model 4.2 7 110.9 221.7 Precip. of warmest quarter 15.8 2 121.6 246.3 Min. temp of coolest quarter 18.1 2 122.8 245.6 Percent impervious 7.4 2 117.4 234.9 Percent canopy 0.6 2 114.0 228.1 Distance to road 14.9 2 121.2 242.4 Growing degree days 15.3 2 121.4 242.8 Percent canopy & percent impervious 0.0 3 112.7 225.5
-
Future Activities:
In 2012, we will complete the laboratory analysis of pollen production and allergen protein assays from our CO2 experiments, continue field observations of airborne pollen production and field population dynamics, and possibly conduct a smaller, additional CO2 experiment. We will also begin analysis and manuscript preparation based on our results to date and emerging pollen data. Years 3 and 4 will mark the most intensive analytical and writing phase, as well as the creation of pollen risk maps from our collective datasets.
Journal Articles:
No journal articles submitted with this report: View all 13 publications for this projectSupplemental Keywords:
common ragweed, pollen, allergy, Amb-A1 protein, RFA, Health, Air, Scientific Discipline, Health Risk Assessment, Risk Assessments, Atmosphere, Air Pollution Effects, climate change, Ecology and Ecosystems, air quality, ecosystem models, public health effects, environmental monitoring, climate models, future projections, allergens, climatic influence, allergic airway diseaseRelevant Websites:
Progress and Final Reports:
Original AbstractThe perspectives, information and conclusions conveyed in research project abstracts, progress reports, final reports, journal abstracts and journal publications convey the viewpoints of the principal investigator and may not represent the views and policies of ORD and EPA. Conclusions drawn by the principal investigators have not been reviewed by the Agency.