U.S. flag

An official website of the United States government

Here’s how you know

Dot gov

Official websites use .gov
A .gov website belongs to an official government organization in the United States.

HTTPS

Secure .gov websites use HTTPS
A lock (LockA locked padlock) or https:// means you have safely connected to the .gov website. Share sensitive information only on official, secure websites.

  • Environmental Topics
  • Laws & Regulations
  • Report a Violation
  • About EPA
Contact Us

Grantee Research Project Results

2011 Progress Report: Near-real Time, Highly Sensitive and Selective Field Deployable Biosensor for Cyanotoxins and Cyanobacteria Using both Antibodies and DNA-signatures

EPA Grant Number: R833829
Title: Near-real Time, Highly Sensitive and Selective Field Deployable Biosensor for Cyanotoxins and Cyanobacteria Using both Antibodies and DNA-signatures
Investigators: Mutharasan, R.
Institution: Drexel University
EPA Project Officer: Aja, Hayley
Project Period: June 10, 2008 through March 31, 2011 (Extended to September 30, 2013)
Project Period Covered by this Report: October 1, 2009 through September 30,2012
Project Amount: $599,999
RFA: Development and Evaluation of Innovative Approaches for the Quantitative Assessment of Pathogens and Cyanobacteria and Their Toxins in Drinking Water (2007) RFA Text |  Recipients Lists
Research Category: Drinking Water , Water

Objective:

The overall goal of this research is to develop piezoelectric-excited millimeter-sized cantilever sensors (PEMC) for cyanotoxins in source, The overall goal of the proposed research is to develop piezoelectric-excited millimeter-sized cantilever sensors (PEMC) for cyanotoxins in source, finished and system waters that measures in a field-deployable format and rapidly in 15 minutes so that cyanotoxin(s) hazard and management decisions can be made in a timely fashion. The cantilever sensors are of unique design and are the result of development in the PI’s lab over the past 5 years. PEMC’s significant advantage is the use of label-free reagents and a proposed simple measurement format. PEMC sensors exhibit high sensitivity such that greater than femtograms per liter (10-15 g/L; parts per quintillion) cyanotoxin concentration would be measurable directly by dipping into a few milliliters water samples. PEMC sensors are not the fragile AFM-like microcantilevers but are mechanically robust millimeter-sized resonant mode cantilevers that exhibit a high-order mode that measures mass changes at the femtogram (10-15 g) level under liquid immersion and flow conditions.

There are two objectives centered on the cyanotoxin and cyanobacteria detection. These are: (1) develop a batch cyanotoxin measurement method for field use preserving the previously achieved detection sensitivity of PEMC sensors, and validate measurements with current methods (ELISA); and (2) develop a rapid DNA-based assay for cyanobacteria. Two other objectives are centered around detection of anatoxin-a and anatoxin-a(s) and comparing measurements of USGS lake water samples with available HPLC measurements.

Progress Summary:

We have successfully completed the first objective: both batch and in continuous flow method of detection of the cyanotoxins microcystin LR (MCLR) at 1 picogram/mL (equivalent to one part per trillion) in a buffer and in tap water, and in both cases without any sample preparation by exposing the sensor prepared with a suitable antibody to one mL water sample containing the MCLR standard. Second, the method was extended to application in river water, which was successfully completed ruing second year of study. Thirdly, a new method (not originally contained in the proposal) of using a sandwich assay on a PEMC sensor was demonstrated that enhanced detection as well as reduced false negative readings.
 
It is to be pointed out that this is the first time such a low concentration has been measured experimentally without a sample preparation step and in a very short assay time of an hour. ELISA assay is capable of detecting at 1 ng/mL (or equal to ppb).
 
We have successfully developed a culturing of Microcystin-LR toxin-producing cyanobacteria (blue-green algae) Microcystis aeruginosa (UTEX LB 2385), and details of this work is in progress and is expected to be completed during the no-cost extension period.

1.0 Research Method and Results—Microcystin Detection

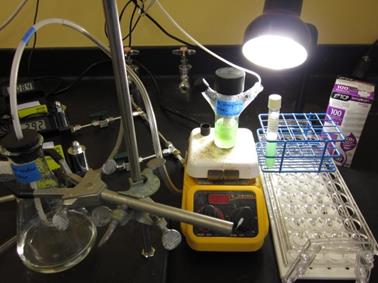
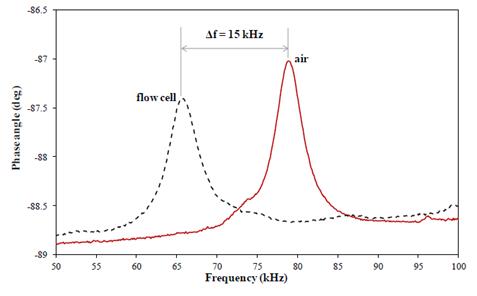
1.1 Experimental apparatus and methods

A schematic of the experiment setup and experimental apparatus was described previously (Maraldo D, Rijal K, Campbell G, Mutharasan R. Method for label-free detection of femtogram quantities of biologics in flowing liquid samples. Analytical Chemistry 2007;79(7):2762-2770). It consists of an impedance analyzer (HP 4192A or Agilent, HP4294A), a peristaltic pump, a home-made flow cell and several fluid reservoirs. The flow cell has a hold-up volume of 120 μl and was maintained in an incubator at 30 ± 0.1°C to ensure isothermal conditions. Prior to an experiment, the entire flow system was rinsed with 100% ethanol followed by copious amount of DI water. The resonant frequency change during an experiment was monitored continuously by a custom-written LabView© program. The flow loop was operated in either a single pass mode or in a recirculation mode.
 
In a typical detection experiment, each of the functionalized sensors was vertically installed in the flow cell and the flow rate was set at 1.0 ml/min. For detection in PBS (or tap water or Schuylkill river water), the flow loop was filled with PBS (or tap water or Schuylkill river water) and the resonant frequency was allowed to reach steady state. Subsequently, samples spiked with MCLR were switched into the flow loop in sequence while the frequency changes were monitored continuously. To confirm that the sensor response was due to MCLR binding, control experiments including both positive and negative control samples were carried out at the same temperature and flow rate. The positive control response is the response of a clean PEMC sensor (without anti-MCs immobilized) exposed to 1 pg/ml MCLR. Negative control response is the response of anti-MCs immobilized PEMC sensor exposed to a 1 ml sample of MCLR-free buffer or water.

1.2 Sensor mass calibration

The sensor was mounted in a 30 °C dry incubator and the sensor’s resonant frequency was measured continuously. A 0.2 μl droplet of aqueous glycerol solution (780 pg/ml) was dispensed on the sensor surface. The frequency decreased immediately due to the mass loading. Subsequently, it rose as the water evaporated. Glycerol, being nonvolatile, remained on the sensor surface after water evaporated, leaving the sensor with an added mass of 156 fg glycerol. Several similar mass additions were made and the measured resonant frequency changes were plotted against mass additions to obtain mass-change sensitivity value. The resonant mode at ~102 kHz exhibited sensitivity of 3 ± 0.5×10⁻¹⁵ g/Hz in air (n = 5 data points). Sensitivity in liquid is not significantly compromised and was previously shown to be lower compared to the sensitivity in air by a factor of 2 to 3 (Campbell GA, Mutharasan R. Method of measuring Bacillus anthracis spores in the presence of copious amount of Bacillus thuringiensis and Bacillus cereus. Analytical Chemistry 2007;79(3):1145-1152). This is because the sensor Reynolds number at 102 kHz is high (~105) and the response depends on mass change.

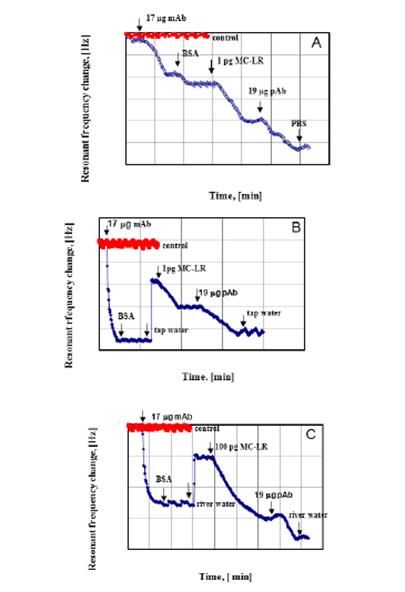
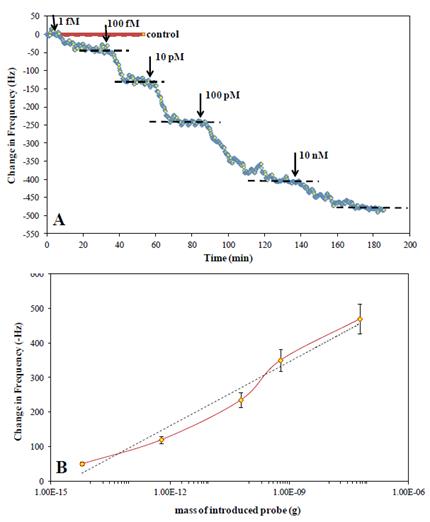
1.3 Water sample experiments

Water samples tested included tap water obtained in our laboratory (supplied by Philadelphia Water Supply Company) and river water (Schuylkill River, collected near 30th St. and Market St., Philadelphia, PA). The Schuylkill is the source water for about a third of Philadelphia city. Water samples were spiked with MCLR standard to final concentrations in the range of 1 pg/ml and 100 ng/ml, and brackets the WHO target of 1 ng/mL. The flow loop of the experimental apparatus was filled with the appropriate water matrix and the sensor was pre-stabilized, and then various MCLR-spiked samples were introduced. The flow loop was set in recirculation mode. The resonant frequency of the sensor was recorded at a rate of two measurements per minute and later analyzed for frequency shifts.

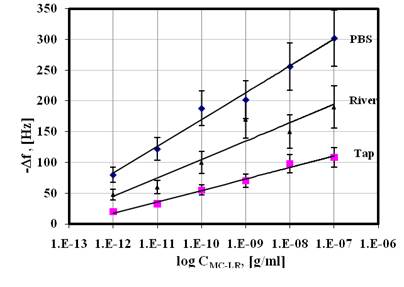
1.4 Sensor response to MCLR in three water media

To test and compare the performance of the PEMC sensor detection responses in matrices that contain contaminants, detection experiments in PBS, tap water and river water were carried out using functionalized sensors. Typical responses obtained in the three different water media are shown in Figure 1. In these experiments, antibody was immobilized via amine coupling. As shown in Figure 1A, after a sensor was prepared with anti-MCs and blocked with BSA, it was first stabilized in PBS, and then 1 ml of various MCLR in PBS samples were introduced into the flow loop sequentially. The flow loop was set in recirculation mode to allow sufficient time for binding as indicated by reaching a steady state value for resonant frequency. The total volume of the flow circuit was 4 ml, thus the effective concentration that the sensor was exposed to was diluted by a factor of 4. Resonant frequency responses to sequential additions of 1 pg/mL, 10 pg/mL and 1 ng/mL in PBS were 75, 43 and 50 Hz, respectively. The total frequency response for the cumulative addition of 1.011 ng MCLR was 168 Hz. One notes in Figure 1A, the sensor showed a rapid and large resonant frequency decrease upon the addition of the first 1 pg/mL MCLR sample followed by a slightly smaller response to subsequent samples. From earlier work, we know that sensor response is log-linear, suggesting that response to higher concentration is not linearly proportional to concentration. The number of binding sites on the sensor is estimated at ~1011, assuming full surface (1.8 mm2 gold area) coverage with antibody of average size 4-5 nm. If each antibody binds to two MCLR molecules, the maximum mass of MCLR that can bind to the sensor under the most optimistic condition is ~0.3 ng.
 
Figure 1
 
Figure 1. Sequential detection of MCLR in PBS (A), tap water (B) and river water (C). For detection in PBS, 1 ml sample at 1 pg /mL, 10 pg/mL and 1ng/mL of MCLR were introduced into the flow loop sequentially. For detection in tap water, 1ml sample prepared in tap water at 1 pg/ml, 10 pg/ml and 1 ng/ml of MCLR were injected sequentially. For detection in river water, 1mL sample prepared in river water at 1 pg/ml and 10 pg/ml of MCLR were sequentially introduced into the flow system. The control shown is the response of a bare PEMC sensor exposed to 1 ng/mL MCLR, and the sensor response was less than 8 Hz. A 10-minute PBS or water rinsing step was introduced between each sample injection and is not shown in the graph. The total volume in the flow circuit was 4 ml. Thus each sample concentration was diluted by a factor of 4 in the flow circuit.
 
Similar sequential addition experiments were individually conducted in tap water and in river water by serially introducing various concentrations of MCLR and are shown in Figure 1B and Figure 1C, respectively. After the functionalized sensor was stabilized in tap water or river water, various MCLR samples spiked in tap water or in river water were injected into the flow loop (1.0 ml/min) in recirculation mode. Resonant frequency responses (Figure 1B) to sequential additions of 1 pg/mL, 10 pg/mL and 1 ng/mL MCLR in tap water were 20, 12 and 19 Hz, respectively. Note that signal-to-noise ratios in these responses were > 12. Similarly, in river water for sequential additions of 1 pg/mL and 10 pg/mL MCLR resulted in decreases of 48 and 28 Hz, respectively (Figure 1C). Following MCLR attachment, the flow loop was rinsed with MCLR-free tap water or river water, and no further change in resonant frequency occurred. The control experiments shown in Figure 1 are responses of a bare sensor (without antibody attached to it) exposed to 1 ng/ml MCLR and yielded a response less than 8 Hz, and are within measurement noise. The second control experiment shown was conducted with a functionalized sensor exposed to MCLR-free river water and tap water which gave a response of 2 ± 5 Hz which is at noise level (data not shown). Based on the results in Figure 1, we conclude that sensor response is proportional in a nonlinear fashion to the amount of MCLR in the sample and that nonspecific adsorption to the sensor was very small in the three water matrices tested.

1.5 Estimates of detection limit and dynamic range

Sensor responses to MCLR spiked in the three water matrices (PBS, tap and river water) are collectively presented in a semi-logarithmic graph in Figure 2. The experimental data obtained in this study correlated well with the following equation:
 
(-Δ f) = A log (C) +B (1)
 
where A and B are sensor constants and depend on cantilever geometry, antibody surface concentration and the antibody-antigen immune-binding constant. The (-Δ f) is the total steady state frequency shift and C is MCLR concentration added to the flow loop. In Figure 2, we present the results obtained using various sensors (n = 18) that exhibited similar spectral property and mass-change sensitivity. From Figure 2, one can see that the functionalized PEMC sensors show good detection sensitivity in the three water media. The detection range was 1 pg/mL to 100 ng/mL, and the fitted logarithmic regression relationships are (-Δ f) = 18.94 log (C) + 605.8 in PBS (R2 = 0.986), (-Δ f) = 8.07 log (C) + 240.4 in tap water (R2 = 0.989), and (-Δ f) = 13.03 log (C) + 404.7 in river water (R2 = 0.901), respectively. As can be seen in Figure 2, the sensor frequency response magnitude was lower in tap water than in PBS for the same MCLR concentration. The reason for this was not investigated in the current study, but we believe that the difference may be due to the lower binding property of the antibody in a non-buffered medium. Additionally, residual chlorine or other disinfectants might affect the binding of the MCLR with the antibody. For detection of 1 pg/mL MCLR in river water, the sensor produced a measurable response. In the four experiments at 1 pg/mL, the sensor responses were 48 Hz, 36 Hz, 52 Hz and 43 Hz, which gave an average of 45 ± 9 Hz. The signal-to-noise ratio was 18 to 26 and noise level was ± 2 Hz. Thus we find that a low concentration of 1 pg/ml MCLR (effective concentration of 250 fg/ml) in river water can be successfully measured. The results suggest that the sensitivity of the PEMC sensor is not significantly comprised in practical water samples.
 
Figure 2
Figure 2. Resonant frequency responses to various concentrations of MCLR in PBS, tap water and river water. The responses in three media show log-linear correlation with the MCLR concentration. The data given above were from repeated experiments (n = 2 ~ 5) and used of multiple sensors (n = 18).

1.6 Confirmation of detection using sandwich assay

One method of confirming that the sensor response is indeed caused by the antigen (MCLR) binding to the antibody on the sensor is to determine whether a second antibody binding to the bound MCLR will produce a further sensor response. This approach is similar to the sandwich method used in immuno-assays such as ELISA except that the second antibody is not labeled and the sensor itself produces the detection signal due to increased mass on the sensor. A monoclonal antibody against MCLR became available from a commercial vendor during the course of the current study. Since MCLR is a small molecule, it seemed reasonable to immobilize the mAb on sensor and use pAb in the second binding step. The rationale is that MCLR bound to mAb is more likely to leave open antigenic sites for pAb than the other way around. We know from experiments that both antibodies bind to MCLR, but their binding sites are known. Therefore, monoclonal anti-MC immobilized on the sensor was used as a capture antibody, and the polyclonal rabbit anti-MC, served as the indicator antibody. A typical secondary antibody binding response in PBS is shown in Figure 3A. We first introduce mAb (17 μg/mL, 1 mL) into the flow loop with the sensor prepared with cysteamine and glutaraldehyde. The reaction of mAb with the exposed aldehyde group occurs rapidly, which was measured by sensor’s resonant frequency decrease (55 Hz). After the monoclonal antibody-functionalized sensor was blocked with BSA and stabilized in PBS, 1 ml of 1 pg/ml MCLR sample was introduced into the flow loop in a recirculation mode. A 50 Hz resonant frequency decrease was observed in 60 min. After PBS rinse of the flow loop, 1 ml of polyclonal anti-MC (19.0 μg/ml) was introduced into the flow loop in a recirculation mode. A further decrease of 40 Hz occurred in 70 min. The decrease was due to the secondary antibody binding and indicates that initial response observed during detection was indeed due to MCLR binding to the sensor. In separate experiments, monoclonal anti-MC immobilized sensor was exposed to 1 ml of polyclonal anti-MC (19.0 μg/ml), and the response was within a noise level of 6 Hz, and served to indicate that the response to secondary antibody was due to binding to the antigen, MCLR, and not to the immobilized mAb.
 
Figure 3
 
Figure 3. Confirmation of MCLR detection using polyclonal anti-MCs as a secondary antibody in PBS (A), tap water (B) and river water (C). Sensor was first functionalized with monoclonal anti-MCs and then blocked with BSA. After the detection response to MCLR at 1 pg /mL in PBS, 1 pg/mL in tap water and 100 pg/mL in river water, respectively, it was then exposed to 1 ml of 19 μg/ml polyclonal anti-MCs. The sensor showed a further resonant frequency decrease of 40 Hz in PBS, 20 Hz in tap water and 30 Hz in river water, respectively. In the control experiment, 19 μg/ml polyclonal anti-MCs was injected to monoclonal anti-MCs immobilized sensor, and no significant response occurred and the result was not added in the figure. A 10-minute PBS or water rinsing step was used between each injection and is not labeled in the graph.
 
Similar confirmation experiments were carried out in tap water (Figure 3B) and in river water (Figure 3C). After the monoclonal antibody-functionalization step, which yielded a frequency decrease of 90 Hz, the sensor was blocked with BSA. Subsequently, the flow cell was rinsed with tap water or river water, which caused the resonant frequency increase due to the lower density of water (0.998 g/cm3) compared to 10 mM PBS (1.008 g/cm3). The response to BSA blocking depends on available reactive sites on the sensor. In Figure 3A, the response was 10 Hz while in the other two cases it was negligible. We believe the variability occurs due to how densely antibody occupies on the sensor surface. The range of response to BSA blocking varied from 0 to 10 Hz. Sample (1 mL) containing 1 pg/mL MCLR prepared in tap water or 100 pg/mL MCLR prepared in river water was introduced into the flow loop and the flow was set in recirculation mode to allow sufficient time for binding reaction to occur. The attachment of MCLR in tap water and in river water resulted in a frequency decrease of 20 Hz and 75 Hz, respectively. A second antibody introduction (pAb, 1 mL of 19 μg/mL) caused a further decrease of 20 Hz and 30 Hz, for the two cases. Similar experiments were conducted in the concentration range of 1 pg/mL to 1 ng/mL in the two waters. These results indicate that tap water and river water offer a similar favorable secondary binding environment as PBS. In practical cases, one would prefer to conduct the secondary binding under favorable condition such as in PBS for maximizing sensor response.

2.0. Research Method and Results – Cyanobacteria detection

2.1      Reagents: 3M Bold Medium was purchased from UTEX culture collection (Austin, TX). Phosphate buffered saline (PBS) was from Sigma-Aldrich. Thiolated DNA probes were from Integrated DNA Technologies (IDT). Bond Breaker TCEP solution, agarose, and sodium azide was from Fisher. Thiol molecule 6-mercapto-1-hexanol was from Fluka Corporation. DNA extraction kit was from Fermentas.
 
2.2      Sensor fabrication: Fabrication of electrochemical sensors was reported in Section 1. Recently, we integrated electrochemical sensing with intrinsic mass-based sensing based on traditional monitoring of resonant frequency shift by integrating the functionalized probe surface as the working electrode.
 
2.2 Culturing: Microcystin-LR toxin-producing Microcystis aeruginosa (UTEX LB 2385) cyanobacteria (blue-green algae) was purchased from UTEX culture collection (University of Texas-Austin, Austin, Texas) as a starter culture. Cyanobacteria were cultured using vendor recommended 3M Bold Medium (UTEX, pH = 6.3) at room temperature. Cultures were grown in volumes of 30 mL by inoculating 30 mL of sterile medium with 200 µL of starter culture (2.8×10⁷ cells/mL). During growth, filtered air (~3.5% CO2) was bubbled into the culture at a flow rate of ~300 mL/min. The culture was grown under cool-white fluorescent light (100 W, 4100 K) at ~5,200 lux for 7 days to reach high cell density. Subsequent to reaching a cell density of ~2×10⁷ cells/mL (final pH ~ 8.9), cells were centrifuged at 2,500 rpm for 10 minutes and re-suspended in 10 mM phosphate buffered saline (PBS, pH = 7.4) solution with 0.01% w/w sodium azide to give final sample solutions at a concentration of ~1×10⁷ cells/mL for use in detection studies.
 
Figure 1a
 
Figure 1a. Experimental apparatus used for M. aeruginosa culturing.
 
Figure 1b
 
Figure 1b. (Left panel) Cyanobacteria culture in bloom conditions after a 7 day period. (Right panel) Washed M. aeruginosa culture re-suspended in PBS buffer for use in genomic-based DNA sensing
 
2.3 DNA extraction: During summer 2012, several extraction methods were tested, including commercial kits (AquaPure kit; Bio-Rad which were stated in the original proposal). We now get excellent results with the following protocol. Various protocols were carried out to examine level of purity of DNA obtained. The quality of genomic DNA prepared was determined by the ratio of OD (optical density) 260 nm and 280 nm. Surprisingly, the commercial kits gave poorer results of purity less than 95%, while the following method arrived at after several trials gives in excess of 98% purity. We use no enzymes, and the only reagents needed are detergent (SDS) and ethanol.
  • Centrifuge cell suspension at 14,000 g for 15 min to get a cell pellet.
  • Remove supernatant liquid.
  • Resuspend cell pellet in 200 µL of TE buffer.
  • Add 100 µL of 10% SDS in DI water.
  • Incubate cell suspension at 100°C for 15 min.
  • Immediately incubate the cell suspension at 2–4°C for 10 min.
  • Add 600 µL of chloroform and mix well by inverting for 1–2 min.
  • Centrifuge the cell suspension at 14,000 g for 2 min.
  • Take the aqueous supernatant in to a separate vial without disturbing the aqueous-organic interface.
  • Add 50 µL of TE buffer with 1M NaCl and mix well.
  • Add 800 µL of cold ethanol and mix well.
  • Incubate the vial at −20°C for 8–12 hr for DNA precipitation.
  • Centrifuge the vial at 14,000 g for 30 min.
  • Discard the supernatant.
  • Wash the DNA pellet with cold ethanol.
  • Let the ethanol evaporate at room temperature.
  • Suspend the DNA pellet in TE buffer.
Extraction purity was determined from absorbance measurements at 260 and 280 nm.
Figure 2
 
Figure 2. Verification of DNA extraction.
 
2.4 Fragmentation of genomic DNA: Isolated DNA was fragmented by shearing from sequential (n ~ 30 cycles) uptake and elution from a 30 gauge syringe. Changes in DNA mean fragment size will be confirmed by separation using gel electrophoresis (1% agarose gel) to obtain the optimized number of cycles to obtain an average fragment size of ~ 1 kbp.
 
2.5 Probe design and preparation: DNA probe [HS- C6H6 -5’ TTTTTT CCC TGA GTG TCA GAT ACA GCC CAG TAG-3’] was selected for selectivity for toxin-producing sequence of the myc gene. A 5’thiol group was added to the DNA probe for immobilization on the gold (Au) sensor surface. Reduction of the disulfide form of the DNA probe was done using TCEP as described previously.
 
2.6 Experiments in complex matrix: For use as a source water matrix, water samples were collected directly from the Sckuylkill River, Philadelphia, PA (GPS coordinates [39.954121,-75.180007]). Bacterial pellets ranging from 1×101 to 1×10⁶ total cells were resuspended in river water prior to extraction process to assess detection in samples with practical contaminating backgrounds.
 
2.6 Initial results.
 
Approximately 20 sensors were fabricated and characterized. Those that exhibited a pronounced second flexural resonance mode (n = 9), located in the region of 60–85 kHz in liquid, were selected for detection experiments. Typical frequency spectra of a PEMC sensors are shown in Figure 3. The peak shape factor (Q) of this mode ranged from 20 to 35 under liquid immersion. In a liquid medium, the liquid film adjacent to the sensors acted as added mass, resulting in decreased resonance frequency. The increase in density of the medium from air to TE buffer caused a frequency decrease of ~15 kHz; see Figure 3. Although this frequency change due to density change is related to sensor sensitivity, molecular chemisorption is a better measure of device sensitivity for DNA detection.
 
Figure 3
 
Figure 3. Typical spectra of PEMC sensors in air and when submerged in buffer. The resonance frequency decreased by ~15 kHz due to the change in the density of the surrounding medium.
 
The sensitivity and concentration dependence response of the cantilever sensor was first obtained by exposing the sensor in a flow cell to increasing concentrations of a synthetic strand of composition: 5’-CTC CGC CTG CAA GTC CTA-3’ to which the 5’ end was modified with a spacer and a thiol group: thiol-C6 H6-5’. The sulfur in thiol readily chemisorbs on the sensor tip coated with 100 nm Au.
 
Initially, the sensor was stabilized at its resonance frequency as the running buffer, Tris-EDTA (TE) buffer (10mM Tris, 1mM EDTA, pH 8, 1M NaCl), was flowing at 0.6 mL/min. Chemisorption of the test strand on the sensor surface induced a frequency decrease of 50 ± 7 Hz (n = 3) as shown in Figure 4A. This was followed by 1mL additions of the test strand at increasing concentrations of 100 fM, 10pM, 100 pM and 10 nM until all available binding sites in a 1 mm2 area were filled. Corresponding to each of these concentrations, the frequency decreased in value by 120 ± 11 Hz (n = 7), 235 ± 19 Hz (n = 7), 380 ± 24 Hz (n = 7) and 470 ± 31 Hz (n = 7), respectively. The sensors exhibited a log-linear frequency change response to the sequential mass additions as shown in Figure 4B. The various mass additions correspond to the mass of probe strands present in 1mL of the various concentrations introduced into the flow loop.
 
Figure 4
 
Figure 4. PEMC sensor response to increasing concentration of test sequence for determining mass- change sensitivity
 
The total mass of the probe present in 1mL of 1 fM solution is ~6 fg, and we expect only a fraction of this mass to chemisorb on the sensor surface. A conservative estimate of mass-change sensitivity can be obtained by assuming all 6 fg to have chemisorbed on the sensor. Therefore, a resonance frequency decrease of 50 ± 7 Hz (n = 3) gives us an estimate of sensor sensitivity as 120 ± 10 ag/Hz. The increasing mass of probe introduced into the flow loop with each concentration induced a concentration-dependent frequency response as shown in Figure 4B. Since the frequency response follows a log-linear relationship with the mass additions (similar to that observed with MCLR, Fig. 2), the sensor response is more sensitive at lower concentrations. Based on the results in Figure 4, we have chosen to use the probe concentration of 50 pM in all hybridization experiments to ensure that the sensor surface was not very densely packed, a condition at which target hybridization may become inhibited.

Future Activities:

We are in the process of conducting DNA-based detection experiments with a model cyanobacterium, Microcystis aeruginosa.We are in the process of conducting DNA-based detection experiments with a model cyanobacterium, Microcystis aeruginosa.

Having established DNA extraction protocol, and sensor sensitivity we are currently conducting hybridization experiments with synthetic DNA strands. Initial results indicate that we can measure easily ssDNA at a few femtograms. During coming 3 months we are planning to complete hybridization experiments followed by genomic DNA extracts and finally during the summer complete the sensing done in river water.


Journal Articles on this Report : 1 Displayed | Download in RIS Format

Publications Views
Other project views: All 2 publications 2 publications in selected types All 2 journal articles
Publications
Type Citation Project Document Sources
Journal Article Ding Y, Mutharasan R. Highly sensitive and rapid detection of microcystin-LR in source and finished water samples using cantilever sensors. Environmental Science & Technology 2011;45(4):1490-1496. R833829 (2011)
R833829 (Final)
  • Abstract from PubMed
  • Abstract: ES&T-Abstract
    Exit
  • Supplemental Keywords:

    resonant frequency, ultrasensitive, immuno-binding

    Progress and Final Reports:

    Original Abstract
  • 2008
  • 2009
  • 2010
  • 2012
  • Final Report
  • Top of Page

    The perspectives, information and conclusions conveyed in research project abstracts, progress reports, final reports, journal abstracts and journal publications convey the viewpoints of the principal investigator and may not represent the views and policies of ORD and EPA. Conclusions drawn by the principal investigators have not been reviewed by the Agency.

    Project Research Results

    • Final Report
    • 2012
    • 2010
    • 2009
    • 2008
    • Original Abstract
    2 publications for this project
    2 journal articles for this project

    Site Navigation

    • Grantee Research Project Results Home
    • Grantee Research Project Results Basic Search
    • Grantee Research Project Results Advanced Search
    • Grantee Research Project Results Fielded Search
    • Publication search
    • EPA Regional Search

    Related Information

    • Search Help
    • About our data collection
    • Research Grants
    • P3: Student Design Competition
    • Research Fellowships
    • Small Business Innovation Research (SBIR)
    Contact Us to ask a question, provide feedback, or report a problem.
    Last updated April 28, 2023
    United States Environmental Protection Agency

    Discover.

    • Accessibility
    • Budget & Performance
    • Contracting
    • EPA www Web Snapshot
    • Grants
    • No FEAR Act Data
    • Plain Writing
    • Privacy
    • Privacy and Security Notice

    Connect.

    • Data.gov
    • Inspector General
    • Jobs
    • Newsroom
    • Open Government
    • Regulations.gov
    • Subscribe
    • USA.gov
    • White House

    Ask.

    • Contact EPA
    • EPA Disclaimers
    • Hotlines
    • FOIA Requests
    • Frequent Questions

    Follow.