
Grantee Research Project Results
Final Report: Incorporating Uncertainty Analysis into Integrated Air Quality Planning
EPA Grant Number: R833665Title: Incorporating Uncertainty Analysis into Integrated Air Quality Planning
Investigators: Cohan, Daniel , Bell, Michelle L. , Bergin, Michelle S. , Cox, Dennis , Boylan, James , Marmur, Amit
Institution: Rice University , Yale University , Environmental Protection Division of the Georgia Department of Natural Resources
EPA Project Officer: Hahn, Intaek
Project Period: October 28, 2007 through October 27, 2009
Project Amount: $229,770
RFA: Uncertainty Analyses of Models in Integrated Environmental Assessments (2006) RFA Text | Recipients Lists
Research Category: Aquatic Ecosystems , Ecological Indicators/Assessment/Restoration , Environmental Justice
Objective:
The central objective of this research was to explore how formal examination and communication of model uncertainty could enhance future air quality management, using a reanalysis of Georgia’s attainment planning for ozone and fine particulate matter as a case study to develop broadly applicable methodologies. Specific objectives that contributed to this overall objective were as follows:
- Demonstrate methods for quantifying uncertainties associated with estimates of (i) control cost-effectiveness, (ii) photochemical sensitivities to emissions, and (iii) concentration-response functions of health impacts.
- Conducting stochastic modeling linking the component uncertainties to assess overall uncertainty of the impacts and rankings of air pollution control measures.
- Develop methods for communicating uncertainty results to inform air quality planning.
Summary/Accomplishments (Outputs/Outcomes):
The project has largely adhered to the original aims described in the proposal, with a 6-month no-cost extension that allowed completion of project activities. Work is ongoing to complete and revise several papers reporting results from the project, and those will be provided to U.S. EPA upon completion. Details of project activities and results are summarized below.
Kick-off Meeting (Rice U., Yale U., Ohio State U., GA EPD)
To initiate the project, a kick-off meeting was held February 6, 2008, at Georgia Environmental Protection Division (GA EPD) offices in Atlanta. The meeting provided a forum for the full research team to introduce the project to a heterogeneous community of stakeholders in the Georgia air quality planning process, including representatives from industry, local agencies, advocacy groups, and academia. Attendees shared their perspectives on recent state implementation plan (SIP) development efforts and recommendations for the project, and participated in general discussion and a survey that were documented for future use.
The stakeholders indicated that uncertainty in the cost of control measures, emission reduction from control measures, emission sensitivity to emission reduction and health impacts of air pollution all played a role in air quality control plan development. It was clear that uncertainty in costs played a lesser role overall, and that for the purposes of this project the greatest interest was in better understanding uncertainty in pollutant sensitivity to emissions reduction, followed by uncertainty in health impacts of air pollution. Stakeholders completed a written exercise that elicited perceptions of the levels of uncertainty around estimates of control costs, emission reductions, ozone response to emission reductions, and health benefits due to an ozone reduction. Stakeholder responses indicated that estimates of ozone-precursor response and health impacts are perceived to be more uncertain than cost and emission reduction estimates.
Second Stakeholder Meeting (Rice U., Yale U., Ohio State U., GA EPD)
A second workshop was conducted to share initial findings from the uncertainty modeling efforts and elicit additional feedback from stakeholders. This July 31, 2009 meeting, also held at GA EPD offices, attracted representatives from industry, local agencies, advocacy groups, and academia.
Stakeholders at this meeting provided responses along each step of a structured decision making (SDM) process led by Prof. Robyn Wilson. SDM approaches and techniques are meant to split decision problems into more cognitively manageable parts. They provide decision makers with a series of tasks aimed at encouraging the consideration of multiple objectives as well as facilitating tradeoffs when these objectives conflict (National Research Council, 1996). The goal of these approaches is to combine technical expertise, rational decision-making, and stakeholder values and preferences into the decision process. Although the steps that are necessary for any given decision problem will vary, there are five basic steps that are common to most structured processes (Gregory, 2000; Hammond, Keeney & Raiffa, 1999). These steps include:
- Characterizing what matters most to the participants and the decision in the form of objectives,
- Creating a set of purposeful alternatives that address these objectives,
- Employing the best available technical information to characterize the possible impacts of the alternatives on the stated objectives,
- Identifying and addressing tradeoffs based on the values and objectives of the participants, and
- Summarizing the areas of agreement and disagreement in order to choose the option that best meets the needs and objectives of the decision makers.
Structuring the decision process using the above steps helps to ensure that the factors motivating choice behavior are sufficient for the particular decision. It also ensures that the resulting decisions will achieve greater public support and success over the long term. Ideally, such a process might be used during SIP development and might increase the success of SIPs at achieving their predicted ozone reductions. In light of understanding how such a process might improve SIP planning, or at the very least inform SIP development in a new way, we chose to engage in a series of brief discussions with stakeholders aimed at soliciting their feedback on the key components of the process.
Control Measure Cost-Effectiveness Analysis (Rice U., GA EPD)
Rice University researchers consulted extensively with GA EPD staff both at the kick-off meeting and in subsequent conversations to identify control measures to examine. GA EPD provided the research team with available information regarding the cost and emissions reductions of potential control measures under consideration for ozone and PM2.5 SIPs. Spreadsheets were developed containing estimates of the costs, emissions reductions and associated uncertainties for control measures identified by AirControlNET software as well as several additional measures that were deemed to be priorities for focus. Packages of control options in the Atlanta, Macon, and “Rest of Georgia” regions and at individual coal-fired power plants were developed for consideration in analyses of the likelihood that particular controls would achieve desired air quality improvement targets.
Photochemical Modeling (Rice U.)
Summer (May 30 – June 15) and winter (December 1-11) episodes from 2002 were selected to be the basis for the photochemical modeling efforts. The episodes were selected because they contain numerous days with high ozone and/or PM2.5 levels and climatologically typical meteorological conditions as characterized by classification and regression tree (CART) analysis. Community Multi-scale Air Quality (CMAQ) model-ready meteorological and projected 2009 emission input files for the episodes were provided by GA EPD to researchers at Rice. CMAQ modeling was conducted at Rice and verified to yield close agreement with baseline results generated at GA EPD. Most of our work focused on the summer episode.
A comprehensive literature review was conducted to identify uncertain model input parameters that are most likely to affect modeled pollutant concentrations and their sensitivities to emissions. The targeted list included key emissions categories, selected reaction rates from the CB-IV chemical mechanism, deposition velocities, and boundary conditions for ozone and NOy. Sensitivity modeling was conducted with the High-order Decoupled Direct Method (HDDM) in CMAQ to characterize the responsiveness of ozone-NOx sensitivities to changes in each of 19 input parameters. As described by Digar and Cohan (in revision, 2010), the analysis led to the selection of 10 of the 19 parameters to be the focus of uncertainty analyses. The HDDM results for selected cases have been validated by comparison with brute force simulations. HDDM capabilities in CMAQ were extended to enable computation of sensitivities to reaction rate constants, dry deposition velocities, and eddy diffusivity coefficients. Additional model enhancements were made so that brute force simulations can be conducted to compute second-order sensitivities to category- and region-specific perturbations in input parameters. These brute force simulations were necessary for PM2.5 analyses because DDM has been implemented only to first-order for particle-phase processes.
Methods then were developed to construct reduced form models (RFMs) representing how ambient pollutant response to an emissions change varies as a function of the magnitude of the emissions change and of the fractional perturbations in the model input parameters (i.e., emission rates, reaction rate constants, deposition velocities, and boundary conditions). The RFMs are analytical equations which, once computed, can be applied readily with Monte Carlo sampling of the input parameters to develop probability distribution functions of pollutant response to emissions controls under flexible assumptions of input parameter uncertainty.
This project formulated and tested the accuracy of two types of RFMs to address the range of control options that could be considered in attainment planning. The Continuum RFM represents the impact of a flexible percentage of emissions reductions while multiple input parameters are perturbed. It is intended for regional control measures, for which a variable amount of abatement stringency may be possible. The Discrete RFM represents the impact of abatement measures such as point source controls for which a single, predetermined tonnage of emissions reduction may be possible.
The Continuum RFM computes the concentration response to a fractional change εjin emission rate εj in light of fractional perturbations φk in parameters Pk by the equation:
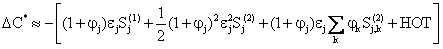
where Sj(1) and Sj(2) are the first- and second-order sensitivities of C to emission rate j, Sj,k(2) is the cross sensitivity of C to emission rate j and parameter k, and HOT denotes higher-order terms not considered in this second-order approximation (Digar and Cohan, in revision 2010). The (1+ϕj) terms reflect the fact that if the targeted emission rate is itself uncertain, then the targeted fraction of emission control may represent more or less tons of reduction than originally anticipated. These terms appear only if j is one of the parameters considered to be uncertain, or a subset thereof (e.g., if Atlanta NOx emission reductions are targeted while domain-wide NOx emissions are treated as uncertain).
The Discrete RFM computes response coefficients, Fk, defined by
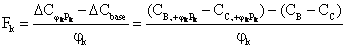
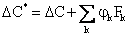
Where CC,+ϕkPk and CB,+ϕkPk denote concentrations modeled under an arbitrary small change φk in one input parameter Pk while the targeted emitter is at its controlled and base rates, respectively. In this study, a nominal value of φk = -10% was used to calculate Fk, to provide independence from the positive input parameter perturbations considered in accuracy testing by Digar and Cohan (revised, 2010). After the response coefficients have been computed, the Discrete RFM scales them by the actual amount of error φk in each input parameter to adjust the original estimates of pollutant response and derive error-corrected estimates of actual pollutant response to the targeted emission reduction:
Extensive testing showed that both the continuum and discrete RFMs yield accurate predictions for both ozone and fine particulate matter response to precursor emissions, even for very large (10-50%) reductions in emissions under very large (10-50%) simultaneous perturbations to multiple input parameters (Digar and Cohan, in revision 2010). In almost all of the cases tested, normalized mean bias was less than 6%, normalized mean error was less than 10%, and R2 was greater than 0.99. The methods also are far more computationally efficient than traditional Monte Carlo simulations of the entire air quality model.
The RFMs then were applied to characterize the likelihood that specific combinations of emissions control options in Georgia would yield targeted levels of air quality improvement at an ozone monitor. Analysis was conducted to identify 10 out of 19 considered input parameters to target for uncertainty assessments. Methods were formulated for computing the likelihood of achieving either a fixed or variable air quality improvement target. The variable target recognizes that meteorological variability and other factors may make unclear exactly how much improvement is needed in order to attain a regulatory standard at an ambient monitor in a future year. We explored how the rankings of various plausible abatement options in Georgia varied with the type of target function that was applied. Notable distinctions were found between rankings based on deterministic modeling and those based on probabilistic Monte Carlo sampling of the RFMs (Digar, et al., manuscript in preparation).
Health Assessment (Yale U.):
We have completed the meta-analysis project, which investigated concentration-response functions for the relationship between tropospheric ozone and hospital admissions. This process involved identifying previously conducted epidemiological studies of short-term exposure to ozone and hospital admissions, and investigating the overall effect across studies and analyzing where effects differ. Whereas meta-analytical techniques often are used to assess whether an overall association exists, we explored how effect estimates are modified by a range of factors:
- The ozone metric used (e.g., daily, 8-hour maximum, daily 2-hour maximum, etc.)
- Selection of the “lag”, which is the exposure window (e.g., same day, previous day)
- Age of study population (e.g., studies for children, all ages, or older populations)
- Season of study (e.g., studies conducted for the summer versus studies based on the whole year)
- Region of study (e.g., U.S. versus Asia)
- Publication bias
- Single city-studies versus multi-city studies.
A protocol was developed to identify concentration-response parameters and a measure of their uncertainty in previously conducted epidemiological studies. A systematic review was conducted to identify such parameters. We included 136 single-city estimates in our analysis. For meta-analysis of the single-city study results, we applied fixed-effect or random-effect models to calculate the summary effect estimates for different hospitalization types (general hospital admission, emergency hospital admission, and emergency room/emergency department visits), disease categories (e.g., chronic obstructive pulmonary disease [COPD], pneumonia), and age groups (e.g., all ages, elderly). We explored the various factors listed above to evaluate how they impact results. To examine publication bias, we generated funnel plots and applied the linear regression test, and then generated an adjusted estimate using the “trim and fill” method. Finally, we compared the meta-analysis based on single-city studies with 10 multi-city results.
Although some individual studies did not demonstrate significant results, in the meta-analysis we found significant positive outcomes for most analyses. For instance, risk of emergency, total, or general respiratory hospital admissions increased 1.90% (95% CI: 0.74, 3.07%) per 10 ppb increment of daily ozone among all ages and the effect estimate was 4.47% (95% CI: 2.48, 6.50%) among elderly. For cause-specific diseases, COPD all-age hospital admissions increased 5.06% (95% CI: 1.24, 9.05%) for the same ozone increment. Asthma hospital admissions rose 6.64% (95% CI: 2.60, 10.85%) per 10 ppb ozone among all-ages or adults, but for children the association was of 2.83% (95% CI: -3.45, 9.52%). The results indicated an adverse health effect of short-term ozone exposure. The analyses by age group, lag selection, and the exposure season showed that these factors could affect the relationship; however, the effects by comparison groups were not statistically different, suggesting the need of further investigation. Funnel plot and linear regression test provided some evidence of publication bias. After adjusting for the publication bias, effect estimates became smaller and results remained statistically significant. Generally, estimates from the single-city meta-analysis were higher than estimates from multi-city studies, which is further evidence for the existence of publication bias.
In this research, we identified several factors that hinder the comparison of concentration-response functions across studies, regions, etc. For example, the studies did not use a consistent selection of International Classification Disease (ICD) codes to identify “respiratory disease” hospitalizations. Even cause-specific respiratory diseases, such as pneumonia, were defined based on multiple ICD codes across studies. The journal publication of this research will include not only the meta-analysis results, but a discussion of features, such as the different use of ICD codes, that are important to the interpretation of multiple epidemiological studies.
Example results: Publication bias
In our progress report to EPA, we highlighted analysis of different temporal ozone metrics as an example of the results. Here we provide examples of additional results for another factor that may affect individual epidemiological studies – publication bias. This type of bias is the concept that results that are positive and statistically significant are more likely to be submitted and accepted for publication than null or uncertain results. We examined ozone and hospital admissions effect estimates for evidence of publication bias in several ways. One method is the “trim and fill” approach as follows. A funnel plot of estimates is generated (see Figure 1 as an example). The number of asymmetric estimates on the right-hand side of the funnel, from small studies (less precise), was estimated by removing them until the funnel plot exhibits symmetry. The symmetry of the funnel plot was assessed by Egger, et al.’s linear regression test. From the “trim” process, we removed the estimates that resulted in asymmetry of the funnel plot and then calculated the central estimate after removing these estimates. Then we used the new central estimate as a mirror axis to “fill” (i.e., add hypothetical estimates) to the left-side plot. The mirrored data had the same precision as the correspondent estimate, which represents an observed estimate. Figure 1 shows an example of the funnel plot with results from the “trim and fill” method for total or general respiratory disease emergency hospital admissions. Each circle represents a coefficient and its associated standard error for a 1 unit (ppb) increase in daily ozone. The open circles are the original estimates, and filled circles are the hypothetical estimates added by the “trim and fill” method. The open and filled circles combined provide symmetry. The solid line reflects the central estimate by meta-analysis random model from original estimates, and the dashed line is the central estimate after the “trim and fill,” which is an estimate adjusted for publication bias. The mirror axis was very close to the dashed line and is not shown on the graph.
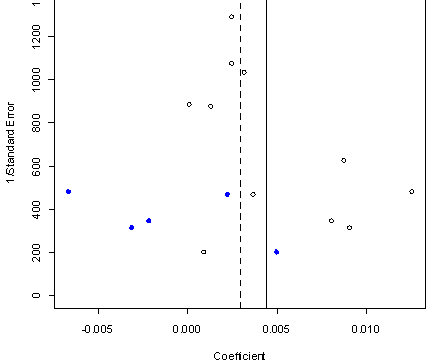
Figure 1. Funnel plot of estimates of the association between ozone and total or general respiratory disease emergency hospital admissions, with “trim and fill” publication bias analysis.
This figure demonstrates evidence of publication bias and indicates that the true association between short-term ozone exposure and risk of total or general respiratory disease emergency hospitalizations (dashed vertical line) is lower than the overall effect based on combining available estimates (solid vertical line). The summary effect adjusting for publication bias is a 2.97% increase (95% confidence interval 1.05%, 4.94%) in risk per 10 ppb increase in daily ozone, as opposed to an unadjusted value of 4.47% (2.48%, 6.50%). Although these results support the hypothesis of publication bias, they also indicate a statistically significant positive association accounting for publication bias.
Table 1 shows publication bias results for three outcomes (general hospital admissions, emergency hospital admissions, and ER/ED visits) for total or general respiratory disease. The table provides the number of estimates combined for each result (N) and results with and without adjustment for publication bias. Note that in all cases, the estimate adjusted for publication bias is lower than the unadjusted estimate, most dramatically for emergency hospital admissions (Figure 1); however, the effects still remain after adjustment.
Table 1. Comparison of overall results with and without adjustment for publication bias. Results are presented as the percent increase in risk of hospital admissions for a 10 ppb increase in daily ozone.
| Hospitalization Type | Disease Category | Age Group | N | Summary results (95% CI) without adjustment for publication bias | Summary results (95% CI) with adjustment for publication bias |
| General Hospital Admissions | Total or General Respiratory Disease | Elderly | 9 | 2.47% (0.89%, 4.07%) | 2.26% (0.89%, 3.64%) |
| Emergency Hospital Admissions | Total or General Respiratory Disease | Elderly | 11 | 4.47% (2.48%, 6.50%) | 2.97% (1.05%, 4.94%) |
| ER/ED Visits | Total or General Respiratory Disease | All Ages | 5 | 1.23% (0.29%, 2.17%) | 1.77% (0.66%, 2.88%) |
3. Effectiveness and Feasibility of Demonstrated Techniques
How feasible would it be to apply the uncertainty analysis techniques demonstrated here to actual air quality attainment planning? We focus on the feasibility of applying the photochemical uncertainty methods, because a review of recent state implementation plans shows that most of them do not directly quantify the costs or health benefits of control measures, and the stakeholder meetings indicated greatest interest in pollutant-emission response.
The modeling necessary to construct the Continuum or Discrete RFMs representing pollutant-emission response under parametric uncertainty would be within the capabilities of many regulatory modeling agencies, though it would require effort and training beyond standard practice. In our work for ozone, most of the sensitivity coefficients needed for the RFMs were computed by HDDM in CMAQ. The most recent version of CMAQ (v. 4.7.1) released HDDM to the broader community for the first time, although proper use of this feature may require brief training. Likewise, the CAMx photochemical used by some states also is now available with HDDM.
The sensitivity coefficients also can be derived without HDDM by finite differencing of brute force simulations. Indeed, that approach is necessary for PM because particle-phase processes are represented only to first-order by DDM. Finite differencing is well within the capabilities of most regulatory modelers, though it becomes tedious and computationally demanding for a large number of uncertain parameters. Some modelers may be unfamiliar with how to adjust terms such as reaction rate constants or deposition velocities.
Beyond the modeling requirements, our methods would entail some challenges in terms of framing the attainment challenge and designing a modeling approach to address it. Early in the SIP development process, it may be unclear how much air quality improvement is needed beyond status quo trends, or what options are available for additional abatement of emissions. Furthermore, modelers must choose which input parameters to consider in the uncertainty analysis. While our work highlighted 10 input parameters that influence ozone-NOx sensitivity in Atlanta, other parameters may be important for other regions and pollutants. Once parameters are chosen, somewhat arbitrary decisions must be made to represent their probabilistic distributions, given the dearth of literature formally characterizing the uncertainty of model input parameters.
The more fundamental challenge in applying probabilistic approaches is that traditional attainment demonstration methods do not provide a clear way to incorporate uncertainty assessments. EPA guidance for SIP modeling recommends a bright-line deterministic test of whether attainment will be achieved at ambient monitors. Although probabilistic methods such as those introduced here could supplement the weight-of-evidence analyses that are encouraged by EPA guidance, there is not a clear way to partner them with the bright-line test.
There also will be the challenge of communicating the meaning of probabilistic results to the stakeholder community as well as to the EPA officials who must approve a SIP. Probabilistic analyses will inevitably show that even stringent control strategies leave some possibility of non-attainment, especially under unfavorable meteorological conditions. The traditional bright-line deterministic prediction of attainment, however fraught with unexamined uncertainties, may be easier to defend and explain than a likelihood estimate. The limitations of our likelihood estimation approach also must be recognized, because it quantifies parametric but not structural uncertainties in the photochemical modeling.
4. Benefits of the Research
The methods developed here for parametric uncertainty analysis of a photochemical model provide a systematic way for regulatory modelers to characterize how pollutant-emissions response predictions are influenced by uncertain input parameters. Extensive testing showed that both the continuum and discrete RFMs yield accurate predictions for both ozone and fine particulate matter response to precursor emissions, even for very large reductions in emissions under very large simultaneous perturbations to multiple input parameters. The methods also are far more computationally efficient than traditional Monte Carlo simulations of the entire air quality model. While EPA-recommended attainment demonstration methodology continues to be based on deterministic modeling, probabilistic assessments using the RFMs could provide a useful weight of evidence analysis and help inform the selection of control measures. The two target functions introduced in this project provide alternate ways to quantify the likelihood that an air quality improvement goal will be achieved. Additional research and expert elicitation are needed to identify target functions most relevant to informing attainment demonstrations.
The health meta-analysis found significant positive relationships between ozone and hospital admissions, although some individual studies did not demonstrate significant results. The results indicated an adverse health effect of short-term ozone exposure. The approach adopted here could provide a template for future meta-analyses of other important pollutant-health relationships.
The workshops with Georgia stakeholders provided a forum for examining air quality decisions and the role of uncertainty in those decisions. They elicited valuable insights into stakeholders’ priorities and their perceptions of uncertainty in air quality planning. The Structured Decision Making exercise engaged participants in defining a problem frame, evaluating trade-offs, and quantifying expected levels of uncertainty.
5. Modeling Information
Model Description
All photochemical modeling was conducted with the Community Multiscale Air Quality (CMAQ) model, version 4.5. This widely used photochemical model was originally developed by scientists from the U.S. EPA and NOAA and is continually updated and assessed through model performance evaluations. The latest version of CMAQ is v. 4.7.1, but v. 4.5 was chosen here to match the modeling used in the Georgia ozone SIP as our purpose was to reexamine SIP modeling from a probabilistic perspective.
Performance Criteria and Testing
The performance of CMAQ modeling of the air quality episodes relative to observed concentrations of ozone, PM2.5, and precursor gases was assessed thoroughly by Georgia EPD in its SIP modeling efforts. Special care was taken to validate the base case CMAQ results generated at Rice U. by comparing them with results generated at GA EPD. An initial inconsistency in the emissions file was corrected through communication with GA EPD modelers.
Pollutant-emission sensitivities cannot be directly observed, so CMAQ-HDDM sensitivity coefficients were validated by comparisons with coefficients derived from finite differencing of brute force simulations of CMAQ. The performance of the newly installed CMAQ-HDDM capabilities for sensitivities to reaction rate constants, dry deposition velocities, and eddy diffusivity coefficients was thoroughly validated by comparison with brute force finite differencing. Performance of HDDM relative to brute force for these new capabilities was found to be equally strong as that previously reported for sensitivities to other types of parameters. An initial bug in the CMAQ-HDDM code for reaction rate sensitivities was identified, corrected, and reported to EPA scientists for inclusion in the recent release of CMAQ-HDDM.
The continuum and discrete reduced form models (RFMs) were thoroughly tested by comparing their predictions of pollutant-emission response under input parameter perturbations with results directly derived by differencing model results under those conditions. Extensive accuracy testing of the RFMs was crucial to this project, because the RFMs represented a novel approach to characterizing pollutant-emission response under parametric uncertainties. Testing also was important because the RFMs are built from sensitivity coefficients derived from within the base model, yet are extrapolated to large perturbations from base input conditions. The accuracy testing by Digar and Cohan (in revision, 2010) showed that the RFMs are highly reliable (NMB<6%, NME<10%, R2>0.99) for predicting both ozone and PM impacts even out to 50% emission reductions under 50% perturbations in three major input parameters.
Theory and Mathematics Used
The theory behind the CMAQ model (e.g., Byun and Schere, 2006) and HDDM sensitivity analysis (Dunker, 1984; Yang, et al., 1997; Hakami, et al., 2003) have been explained elsewhere. The theory behind the RFMs introduced here is explained by Digar and Cohan (in revision, 2010) and is based upon Taylor series expansions of sensitivity coefficients. Those methods are being peer reviewed in our submission of manuscripts to Environmental Science & Technology.
Input Data Requirements
Input data to CMAQ were obtained from GA EPD via external hard drives. GA EPD applied MM5 to simulate meteorological conditions, and SMOKE to create the model-ready gridded emissions inventory. The MCIP processor was used to convert MM5 meteorology outputs into a CMAQ-ready form.
Hardware Requirements
Initial modeling was conducted on a quad-core Linux workstation. Additional modeling was conducted on the SUG@R shared research computing facility at Rice, which contains 134 SunFire x4150 nodes, each with two quad-core 2.83GHz Intel Xeon processors. CMAQ-HDDM is fully parallelized and scales well up to about eight processors.
Documentation
All methods and results are being fully documented in publications. The CMAQ model already is thoroughly documented in reports available from the Community Modeling and Analysis System (www.cmascenter.org).
6. Changes in Project Personnel
The project personnel remained largely consistent with the original proposal, with Dr. Cohan serving as P.I., Dr. Bell leading the health component, and several GA EPD scientists assisting the project. Ph.D. students Antara Digar and Wei Tang and two undergraduate research assistants joined the research team at Rice, and graduate students Meng Ji and Brooke Anderson contributed to the work at Yale. Dr. Amit Marmur and Dr. Maudood Khan left GA EPD, and Dr. Byeong Kim joined GA EPD and assisted with data transfer and validation. Dr. Robyn Wilson of Ohio State University attended both of the Atlanta workshops to lend her expertise on environmental decision making and communication of uncertainty.
References:
Gregory, R. (2000). Using stakeholder values to make smarter environmental decisions. Environment, 42(5), 34-44.
Hammond, J. S., Keeney, R. L., & Raiffa, H. (1999). Smart choices: A practical guide to making better decisions. Boston, Massachusetts: Harvard Business School Press.
Hsee, C. K. (1996). The evaluability hypothesis: An explanation for preference reversals between joint and separate evaluations of alternatives. Organizational Behavior and Human Decision Processes, 67(3), 247-257.
National Research Council (1996). Understanding risk: Informing decisions in a democratic society. Washington, D.C.: National Academy Press.
Slovic, P. (2007). If I look at the mass I will never act: Psychic numbing and genocide. Judgment and Decision Making, 2(2), 79-95.
Slovic, P., & Lichtenstein, S. (1983). Preference reversals: A broader perspective. The American Economic Review, 73(4), 596-605.
Tversky, A., & Kahneman, D. (1981). The framing of decisions and the psychology of choice. Science, 211, 453-458.
Journal Articles on this Report : 5 Displayed | Download in RIS Format
| Other project views: | All 15 publications | 6 publications in selected types | All 5 journal articles |
|---|
| Type | Citation | ||
|---|---|---|---|
|
|
Digar A, Cohan DS. Efficient characterization of pollutant-emission response under parametric uncertainty. Environmental Science & Technology 2010;44(17):6724-6730. |
R833665 (Final) |
Exit |
|
|
Digar A, Cohan DS, Cox DD, Kim B-U, Boylan JW. Likelihood of achieving air quality targets under model uncertainties. Environmental Science & Technology 2011;45(1):189-196. |
R833665 (Final) |
Exit |
|
|
Digar A, Cohan DS, Bell ML. Uncertainties influencing health-based prioritization of ozone abatement options. Environmental Science & Technology 2011;45(18):7761-7767. |
R833665 (Final) |
Exit |
|
|
Ji M, Cohan DS, Bell ML. Meta-analysis of the association between short-term exposure to ambient ozone and respiratory hospital admissions. Environmental Research Letters 2011;6(2):024006. |
R833665 (Final) |
Exit Exit Exit |
|
|
Tang W, Cohan DS, Morris GA, Byun DW, Luke WT. Influence of vertical mixing uncertainties on ozone simulation in CMAQ. Atmospheric Environment 2011;45(17):2898-2909. |
R833665 (Final) |
Exit Exit Exit |
Progress and Final Reports:
Original AbstractThe perspectives, information and conclusions conveyed in research project abstracts, progress reports, final reports, journal abstracts and journal publications convey the viewpoints of the principal investigator and may not represent the views and policies of ORD and EPA. Conclusions drawn by the principal investigators have not been reviewed by the Agency.